Transcription
Southern Oregon University Fact Book2018Table of ContentsSOU Mission Statement . 3SOU Profile Overview & Facts-at-a-glance . 5Enrollment Trends . 13Applications & Admissions . 14Headcount and FTE Enrollment . 15Retention & Graduation . 31Average GPA and Retention . 32Graduation Rates . 33Degrees Conferred . 35Tuition & Financial Aid . 38Faculty & Staff . 45Employee Counts/Categories . 48Written byJake Scott, Research Analyst,for theOffice of Institutional Researchhttps://inside.sou.edu/irOffice of Institutional ResearchPage 2 of 50
Mission StatementSouthern Oregon University is an inclusive, sustainable, university for the futurethat guides all learners to develop the knowledge, capacities, and audacity toinnovate boldly and create lives of purpose.SOU Mission:Southern Oregon University is a regionally-engaged learning community committed to being theeducational provider of choice for learners throughout their lives. We inspire curiosity and creativity,compel critical thinking, foster discovery, and cultivate bold ideas and actions. We achieve studentsuccess, professional preparation, and civic engagement through service excellence, evolvingtechnologies, and innovative curriculum. We foster access, equity, inclusion and diversity in thought andpractice. We prepare our learners to be responsible, engaged citizens in our democracy. We promoteeconomic vitality, sustainability, cultural enrichment, and social well-being in our region, the state, thenation, and the world.Office of Institutional ResearchPage 3 of 50
Fall 2018 Contact InformationAdmissionsCampus AdministrationToll Free: 1 (855) 470-3377President's OfficeIn Oregon: (541) 552-6411Phone: (541) 552-6111Email: admissions@sou.eduFax: (541) 552-6337http://www.sou.edu/admissions/Email: nt/Enrollment ServicesAcademic and Student AffairsPhone: (541) 552-6600Phone: (541) 552-6114Fax: (541) 552-6614Fax: (541) 552-6115Email: esc@sou.eduEmail: affairs/Graduate StudiesPhone: (541) 552-6113Email: studies/Development & SOU FoundationPhone: (541) 552-6127Fax: (541) 552-6126Email: rsity HousingPhone: (541) 552-6371Fax: 541-552-6380Email: housing@sou.eduhttp://www.sou.edu/housing/Finance & AdministrationPhone: (541) 552-6319Fax: (541) 552-6337Email: n Oregon UniversityMarketing & CommunicationsPhone: (541) 552-7246Media Inquiries: (541) 552-6186http://www.sou.edu/marketing/Office of Institutional ResearchPage 4 of 50
Office of Institutional ResearchPage 5 of 50
History at a Glance1855 – City of Ashland, originally called Ashland Mills town, officially founded.1872 – Ashland Academy founded by Rev. Joseph H. Skidmore and Annie Hill Skidmore.1878 – The Academy was incorporated as the Ashland Academy and Commercial College.1879 – School sold and renamed Ashland College and Normal School (ACNS).1881 – First graduating class of ACNS.1882 – Gov. of Oregon signs bill recognizing ACNS as an official state school.1886 – Closed due to financial trouble, no evidence of the state supporting the institution.1887 – Reopened as Ashland State Normal School after fundraising.1890 – Closed due to lack of enrollment.1895 – Reopened as Southern Oregon State Normal School after a series of deals.1899 – The institution begins receiving state appropriations.1932 – The unofficial name of Southern Oregon Normal School (SONS) becomes official.1934 – Drama Professor Angus Bowmer founds the Oregon Shakespeare Festival.1938 – Receives full accreditation from the American Association of Teachers Colleges.1939 – Renamed to Southern Oregon College of Education.1941 – Authorized to offer the first advanced degree, a B.S. in elementary education.1956 – Renamed to Southern Oregon College, no longer just a school of education.1966 – The entire Faculty Council resigns leading to work on a new faculty constitution.1975 – Renamed to Southern Oregon State College.1997 – Renamed to Southern Oregon University.2007 – Created the College of Arts and Sciences.2013 – Implemented House Model with Green and Social Justice Houses.2015 – Became an Independent public body, Board of Trustees founded.Office of Institutional ResearchPage 6 of 50
Office of Institutional ResearchPage 7 of 50
Academic Calendar2018-2019Priority RegistrationNon-Admit RegistrationNew Student OrientationQuarter beginsLast day to add courses, change sections, or registerFall 2018 Winter 2019 Spring 2019May 21Nov 5Feb 25Sept 10Dec 24Mar 18Sept 20-23Sept 24Jan 7Apr 1Sept 28Jan 11Apr 5Last day to pay fees without penaltyLate add fee ( 100) for any classes added after this dateLast day for tuition refund for dropped coursesSept 28Oct 5Oct 8Jan 11Jan 18Jan 21Apr 5Apr 12Apr 15Last day to drop a course w/o being resposible for a gradeLast day to add a course or change sectionsLast day to change "Audit" optionLast day to change P/NP optionLast day to submit course withdrawalOct 19Oct 19Oct 19Nov 9Nov 26Feb 1Feb 1Feb 1Feb 22Mar 11Apr 26Apr 26Apr 26May 17Jun 3Final examinationsQuarter endsDec 3-7Dec 7Mar 18-22Mar 22Jun 10-14Jun 14Thanksgiving HolidayMartin Luther King, Jr. holiday observedMemorial Day holiday observedOffice of Institutional ResearchPage 8 of 50Nov 22-23Jan 21May 27
Academic Offerings2018-2019MajorsBachelor of Arts or ScienceArtBiologyBusiness AdministrationAccounting, Hospitality & TourismManagement, MarketingChemistryChemistry/Biochemistry, Forensic ChemistryCommunicationCommunication Studies, Digital Cinema, SocialMedia & Public EngagementComputer ScienceCriminal JusticeEarly Childhood DevelopmentEconomicsElementary EducationEmerging Media & Digital ArtsEnglishEnvironmental Science & PolicyFinancial MathematicsHealthcare AdministrationInterdisciplinary StudiesInternational StudiesMathematicsMathematics – Computer ScienceMusicNursing (offered via OHSU)Outdoor Adventure LeadershipPolitical SciencePsychologySociology & AnthropologySpanish Language & CultureTheatreActing, Costuming, Directing, Dramaturgy, Sound,Stage Lighting, Stage Management, Stage SceneryBachelor of Applied ScienceManagementCommunity Public Health, Data Analytics,Personnel ManagementHealth & Physical EducationHistoryHuman ServicesInnovation & LeadershipBachelor of Fine ArtsArtCreative WritingTheatreBachelor of MusicMusicMusic Education, PerformanceGraduate DegreesMaster of Arts in French Language TeachingMaster of Arts in Spanish Language TeachingMaster of Arts in TeachingMaster of Arts or Science in Clinical MentalHealth CounselingMaster of Arts or Science in EducationMaster of Business AdministrationMaster of Business Administration: ArtsManagement ConcentrationMaster of Business Administration (OnlinePrograms)Office of Institutional ResearchPage 9 of 50Master of Education / Special EducationProgramMaster in Management (MiM)Master in Interdisciplinary StudiesMaster of Music in PerformanceMaster of Outdoor Adventure and ExpeditionLeadershipMaster of Science in Environmental EducationMaster of Theatre Studies in Production &Design
Academic Offerings2018-2019MinorsApplied StatisticsArtArt HistoryBiologyBusiness AdministrationChemistryCommunication StudiesCreative WritingCriminal JusticeDigital CinemaDigital JournalismEarly Childhood DevelopmentEconomicsEducationEmerging Media & Digital ArtsEnglishEnvironmental tional StudiesLatin American StudiesMathematicsMathematics EducationMilitary ScienceMusicNative American StudiesOutdoor Adventure LeadershipPhilosophyPolitical SciencePsychologyRhetoric & ReasonShakespeare StudiesSocial JusticeSociology & AnthropologySpanishPre-professional ProgramsChiropractic MedicineDental HygieneDentistryLawMedical TechnologyMedicineOccupational TherapyOptometryPharmacyPhysical TherapyPhysician’s AssistantPsychology, Counseling, SocialWork, or Human ServiceVeterinary MedicineChiropractic: University ofWestern StatesDental Hygiene: Oregon Instituteof TechnologyMedical Technology: OHSUOptometry: Pacific UniversityCertificatesAccounting, Post-baccalaureateApplied Finance and EconomicsBusiness Information SystemsCultural Resource ManagementInteractive Marketing andE-CommerceOffice of Institutional ResearchPage 10 of 50Management of HumanResources (Communication)Management of HumanResources (CMHR) (Business)Native American StudiesNonprofit ManagementRegional Studies and AppliedResearchSustainability LeadershipWine Business Certificate
Hannon Library CollectionLibrary Collection Books268,472339,488Electronic Books208,879-Gov. Documents -TotalCataloged Print DocumentsCataloged croficheVHS & DVD VideosAudio ent Periodical SubscriptionsPrint - journals and newspapers, paidElectronic - Unique titles in databasesSUBTOTALElectronic Reference Resources (paid databases)Streaming videoStreaming audioIndividual TracksDiscs/AlbumsOffice of Institutional ResearchPage 11 of 5053927,05927,598722,4711,998,381130,596
Office of Institutional ResearchPage 12 of 50
Enrollment TrendsOffice of Institutional ResearchPage 13 of 50
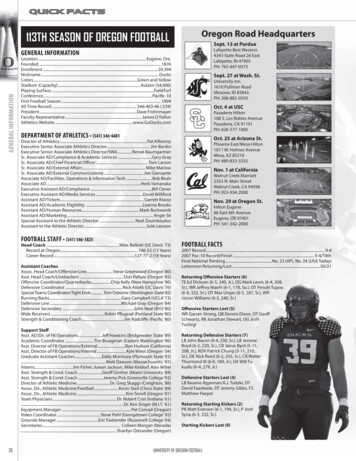
ENROLLMENT TRENDSApplications and Admissions for Fall TermResident FreshmenNon-Resident FreshmenTotal Freshmen2017Applied 5%2018Applied 6%Resident TransferNon-Resident TransferTotal 220860.8%4,0153,18879.4%3,8962,91474.8%Grand TotalApplications and Admissions for End ofFourth Week in Fall Terms .0%74.0%72.0%20152016Applied* Source SOU Institutional ResearchOffice of Institutional ResearchPage 14 of 50Admitted20172018Percentage Admitted70.0%
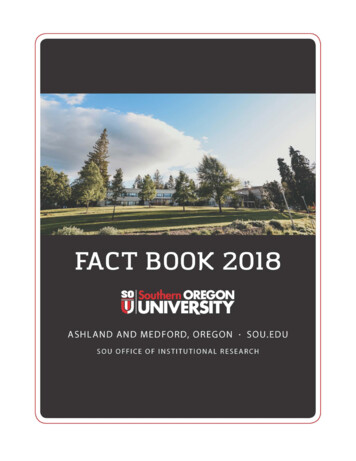
ENROLLMENT TRENDSFall 2018 Headcount and FTE EnrollmentTotal FallHeadcountFall 017% Change from2017 to 3434,4024,2934,3844,203-4.1%Fall Headcount and Annual FTE Enrollment per otal Fall HeadcountFall FTE Enrollment* Source SOU Institutional Research** FTE does not include Nursing Enrollment*** Starting in 2010, Advanced Southern Credit students were admitted in Fall instead of WinterOffice of Institutional ResearchPage 15 of 50
ENROLLMENT TRENDSFall Enrollment by Student e NongraduateNonadmit UndergraduateSubtotal UndergraduateMaster'sPostbaccalaureate GraduateNonadmit GraduateSubtotal GraduateGrand Total% Change from2017 to ,114-0.4%Fall Enrollment per Year by Student Level7,0006,2006,0006,0886,1396,114Nonadmit Graduate5,000Postbaccalaureate GraduateMaster's4,000Nonadmit UndergraduatePostbaccalaureate 1,000020152016* Source SOU Institutional ResearchOffice of Institutional ResearchPage 16 of 5020172018
ENROLLMENT TRENDSFall Enrollment by Racial/Ethnic GroupAmerican Indian/Alaskan NativeAsian/Pacific IslanderBlackHispanicSubtotal All MinoritiesWhiteDeclined to Respond or UnknownGrand ,139% Change from2017 to 6151,4536,11420.5%-35.5%-0.4%Fall Enrollment per Year byMinority Racial/Ethnic n/Pacific IslanderAmerica Indian/Alaska Native400200020152016* Source SOU Institutional ResearchOffice of Institutional ResearchPage 17 of 5020172018
ENROLLMENT TRENDSAge by Student LevelUnder 18UndergraduateGraduateNon Admit UGNon Admit GRTotal21-24UndergraduateGraduateNon Admit UGNon Admit GRTotal2015 2016 2017 20182014 2015 2017 20181926939 1,038958 1,06418-20UndergraduateGraduateNon Admit UGNon Admit GRTotal1,444 1,483 1438 1308646549823131263885971,547 1,584 1,522 1,43525-29UndergraduateGraduateNon Admit UGNon Admit 21232245340-49UndergraduateGraduateNon Admit UGNon Admit 0284308688982195097130-39UndergraduateGraduateNon Admit UGNon Admit 324458650 and OverUndergraduateGraduateNon Admit UGNon Admit 0298465* Source SOU Institutional ResearchOffice of Institutional ResearchPage 18 of 501,801 1,656 1,741 1,585667691 1061,867 1,732 1,832 1,691
ENROLLMENT TRENDSAge by Student LevelFall 2018 Enrolled Student Age by Level1,8001,6001,4001,200Under 1818-201,00021-2425-2980030-3940-4950 and Over6004002000UndergraduateGraduate* Source SOU Institutional ResearchOffice of Institutional ResearchPage 19 of 50Non Admit UGNon Admit GR
ENROLLMENT TRENDSAverage Age by Student LevelFreshmanSophomoreJuniorSeniorPostbacc NongraduateNon-Admit UndergraduateAverage 645.3Graduate MastersPostbacc GraduateNon-Admit GraduateAverage GraduateAverage Age of Students by LevelStart of Fall rSeniorPostbacc Nongraduate2420Non-Admit UndergraduateGraduate MastersPostbacc GraduateNon-Admit Graduate1002018* Source SOU Institutional Research** Age at Start of TermOffice of Institutional ResearchPage 20 of 50
ENROLLMENT TRENDSGender by Student LevelMaleUndergraduateGraduateNon Admit UndergradNon Admit GraduateTotal2015FemaleUndergraduateGraduateNon Admit UndergradNon Admit GraduateTotal201620172018% Change from2017 to 6%Fall Enrollment per Year by 0162017* Source SOU Institutional Research** SOU permits individuals to report gender as Other or UnknownOffice of Institutional ResearchPage 21 of 502018
ENROLLMENT TRENDSFall Enrollment by FT/PT StatusPart TimeUndergraduateGraduateNon Admit UGNon Admit GRTotal2015201620172018% Change from2017 to .4%Full TimeUndergraduateGraduateNon Admit UGNon Admit .4%37.0%38.0%37.8%41.5%Percent Part TimeFall Enrollment per Year by FT/PT rt Time* Source SOU Institutional ResearchOffice of Institutional ResearchPage 22 of 502017Full Time2018
ENROLLMENT TRENDSFall 2018 FTE Enrollment by 8%82.72.1%172.14.4%143.13.7%Biological SciencesBusinessComm/JournalismComputer ScienceEducationEnvironmental StudiesHealth Education1Humanities/Fine ArtsMathPhysical SciencesSocial 6%100.0%922.54,217.721.9%100.0%Fall 2018 FTE Enrollment by xcludes Nursing FTE2"Other" includes area, ethnic, cultural, gender, and group studies; family and consumer sciences/human sciences; libraryscience; military science, leadership, and operational art; multi/interdisciplinary studies; park, recreation, leisure, andfitness studies; science technologies/technicians; homeland security, law enforcement, firefighting, and related protectiveservices; engineering and engineering tech; and public administration and social service professions.* Source SOU Institutional Research** Total FTE is slightly different from FTE reported elsewhere due to timingOffice of Institutional ResearchPage 23 of 50
ENROLLMENT TRENDSFall FTE Enrollment by DisciplineBiological SciencesBusinessComm/JournalismComputer ScienceEducationEnvironmental 5169.22018266.8457.6188.082.7339.1159.9Health Education1Humanities/Fine ArtsMathPhysical SciencesSocial 7.7Other2TotalFall FTE Enrollment by Discipline Per 1801Excludes Nursing FTE2"Other" includes area, ethnic, cultural, gender, and group studies; family and consumer sciences/human sciences; libraryscience; military science, leadership, and operational art; multi/interdisciplinary studies; park, recreation, leisure, andfitness studies; science technologies/technicians; homeland security, law enforcement, firefighting, and related protectiveservices; engineering and engineering tech; and public administration and social service professions.* Source SOU Institutional Research** Total FTE is slightly different from FTE reported elsewhere due to timingOffice of Institutional ResearchPage 24 of 50
ENROLLMENT TRENDSEnrollment by Previous AttendanceContinuing w/o InterruptionReturning After AbsenseNew Admits from High School or GEDNew Admits from Colleges & UniversitiesNew 746446198169666,119Enrollment by Previous Attendance7,000New Non-Admits6,000New Admits fromColleges & Universities5,0004,000New Admits from HighSchool or GED3,000Returning AfterAbsense2,000Continuing w/oInterruption1,000020152016* Source SOU Gray Book ReportsOffice of Institutional ResearchPage 25 of 5020172018
ENROLLMENT TRENDSEnrollment by Geographic CurryDeschutesDouglasGilliamGrantHarneyHood illUnknown CountyTotal Oregon* Source SOU Institutional ResearchOffice of Institutional ResearchPage 26 of 3131404753314020244,1074,0952214,080
ENROLLMENT TRENDSEnrollment by Geographic Origincontinued State of WashingtonState of CaliforniaState of IdahoState of AlaskaState of HawaiiOther U.S. StatesForeignUnknown Geog. SourceTotal OtherGrand Enrollment by Geographic Origin Fall 2018Alaska, 48Hawaii, 91Other U.S.States, 266Foreign, 101Idaho, 35California, 1,269Oregon, 4,080Washington,148* Source SOU Institutional ResearchOffice of Institutional ResearchPage 27 of 50
ENROLLMENT TRENDSFall International Student ong KongIndiaJapanMexicoSaudi ArabiaSouth KoreaTaiwanThailandUnited 421152018International Student Enrollment Fall 2018454035302520151050* Source SOU Institutional ResearchOffice of Institutional ResearchPage 28 of 5021114071190398130311101
ENROLLMENT TRENDSFall Transfers From Oregon Community CollegesBlue eLinn-BentonMt. HoodPCCSouthwesternTreasure ValleyUmpquaRCCTotal Oregon 23420187271141010189117186Transfers from Community Collegesexcluding RCC during Fall 2015-2018201816141210201582016620174201820* Source SOU Institutional Research** Includes only undergraduate transfer studentsOffice of Institutional ResearchPage 29 of 50
ENROLLMENT TRENDSNew Fall Transfers from Other 292234282186222505516554546551554438Other InstitutionsOregon CCOther InstitutionsGrand TotalFall Transfers from OUS Institutions OSUPSU* Source SOU Institutional Research** Includes only undergraduate transfer studentsOffice of Institutional ResearchPage 30 of 50UOWOU
Retention & GraduationOffice of Institutional ResearchPage 31 of 50
RETENTION & GRADUATIONAverage GPA and RetentionFirst Time, Full Time, Degree Seeking Freshmen Fall CohortCohortBase Cohort SizeIncoming GPA% Retained at SOUthe following 7.6%72.1%68.7%Incoming GPA and Retention Rate of Freshmen Fall 080%Incoming 0%10%2008200920102011201220132014CohortIncoming GPA* Source SOU Institutional ResearchOffice of Institutional ResearchPage 32 of 50Retention Rate2015201620170%Retention Rate3.50100%
RETENTION & GRADUATIONFreshmen Cumulative Graduation Ratewithin 6 years highlightedGraduation 2014201520162009-10 2010-11 2011-12 2012-13 2013-14 2014-15 2015-16 2016-17 .6%40.4%37.9%35.9%25.1%3.0%0.1%Freshmen Graduation Rate Within 6 200420072008Fall CohortGraduation Rate* Source SOU Institutional Research** Undergraduate Degrees Awarded to First Time, Full Time FreshmenOffice of Institutional ResearchPage 33 of %41.8%27.8%4.6%0.3%
RETENTION & GRADUATIONTransfer Graduation Ratewithin 6 years highlightedGraduation 2014201520162009-10 2010-11 2011-12 2012-13 2013-14 2014-15 2015-16 2016-17 8%48.8%43.9%35.7%18.5%0.7%Transfer Graduation Rate Within 6 200520062007CohortGraduation Rate* Source SOU Institutional Research** Undergraduate Degrees Awarded to Transfer StudentsOffice of Institutional ResearchPage 34 of %48.0%46.9%38.9%16.7%
RETENTION & GRADUATIONUndergraduate Degrees Awarded by MajorBiological/life Computer and information sciencesEducationEnglishForeign languages and literatureHistoryHomeland Security, law enforcement, firefighting,and protective servicesInterdisciplinary studiesMathematics and statisticsNatural resources / environmental scienceParks and recreationPhysical sciencesPsychologySocial sciencesVisual and performing artsTotal2014-15 2015-16 2016-17 21759207663119804UG Degrees Awarded During 2017-18180160140120100806040200* Source SOU Institutional Research** Note: Primary and Secondary Majors IncludedAwarded a Degree anytime within the academic yearOffice of Institutional ResearchPage 35 of 5066281025651392681128646350930501810081132916
RETENTION & GRADUATIONMinor Degrees AwardedArt and Art HistoryBiologyBusiness AdministrationChemistryCommunicationComputer ScienceCriminology & Criminal JusticeEducationEmerging Media & Digital ArtsEnvironmental StudiesHealth, P.E., & LeadershipHistory & Political ScienceLang., Literature & PhilosophyMathematicsMusicPsychologySocial Sci., Policy, & CultureTheatre 14231489759328269407291Minors Awarded During 2017-20181009080706050403020100* Source SOU Institutional Research** Note: Primary and Secondary Minors IncludedAwarded a Minor any time within the academic yearOffice of Institutional ResearchPage 36 of 502017-18141129103721213616628128865011342
RETENTION & GRADUATIONUndergraduate Degrees Awardedby Ethnicity and Gender2014-15MaleAmerican Indian/Alaskan NativeAsian/Pacific IslanderBlackHispanicWhiteOther1FemaleAmerican Indian/Alaskan NativeAsian/Pacific 78339618512599Total Undergraduate Degrees Awarded byGender per 4-152015-16Male2016-172017-18Female* Source SOU Institutional Research1Includes Multiple Ethnicities, Declined to Respond, Unknown, or None of the Above** Note: Primary and Secondary Majors IncludedAwarded a Degree within the Academic YearOffice of Institutional ResearchPage 37 of 50
Tuition & Financial AidOffice of Institutional ResearchPage 38 of 50
TUITION & FINANCIAL AIDAnnual Tuition and Fee dentNon-Resident% Change2008-09 2009-10 2010-11 2011-12 2012-13 2013-14 2014-15 2015-16 2016-17 2017-18 2018-19 from 0,83217,35521,2432.0%2.0%*based upon 15 credit hours for undergraduates and 12 credit hours for graduatesInflation Adjusted Against 2008-09 Dollars% Change2008-09 2009-10 2010-11 2011-12 2012-13 2013-14 2014-15 2015-16 2016-17 2017-18 2018-19 from ,92714,20317,38814,28817,4890.6%0.6%*Source OUS Fact Book & SOU Enrollment Services**Inflation adjustment indexed against the Portland-Salem Consumer Price IndexOffice of Institutional ResearchPage 39 of 50
TUITION & FINANC
Last day to change P/NP option Nov 9 Feb 22 May 17 Last day to submit course withdrawal Nov 26 Mar 11 Jun 3 Final examinations Dec 3-7 Mar 18-22 Jun 10-14 Quarter ends Dec 7 Mar 22 Jun 14 Thanksgiving Holiday Nov 22-23 Martin Luther King, Jr. holiday observed Jan 21 Memorial Day holiday observed May 27 Academic Calendar 2018-2019