Transcription
Stock Market Indicators:Margin DebtYardeni Research, Inc.June 23, 2022Dr. Edward Yardeni516-972-7683eyardeni@yardeni.comMali Quintana480-664-1333aquintana@yardeni.comPlease visit our sites atwww.yardeni.comblog.yardeni.comthinking outside the box
Table Of ContentsTable Of ContentsMargin DebtJune 23, 2022 / Stock Market Indicators: Margin Debt3-6Yardeni Research, Inc.www.yardeni.com
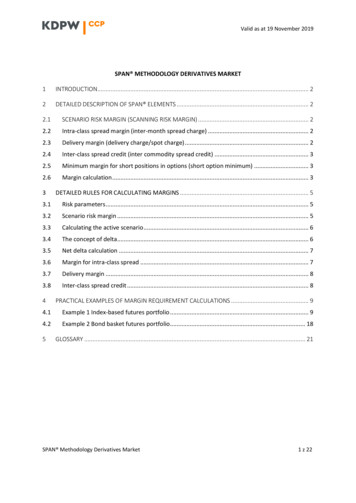
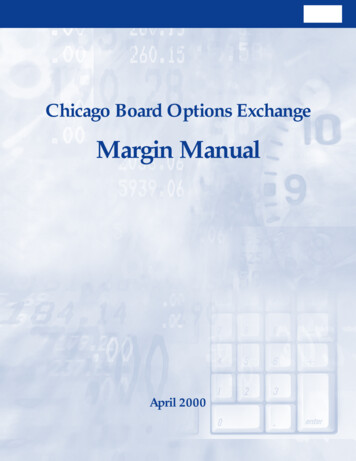
Margin DebtFigure 1.96050MARGIN DEBT & WILSHIRE 5000900840780Margin Debt*(billion dollars) (752.9)72040May6/22660Wilshire 5000Market Cap(trillions) 25* Debit balances in margin accounts at broker/dealers. Beginning in 1997 data are debit balances in customers’ securities margin accounts.Note: Shaded red areas are S&P 500 bear market declines of 20% or more. Yellow areas show bull markets.Source: New York Stock Exchange through December 1996, FINRA thereafter, and Haver Analytics.Figure 2.3.02.83.0MARGIN DEBT*(as a percent of Wilshire 1.41.21.2yardeni.com1.01.095 96 97 98 99 00 01 02 03 04 05 06 07 08 09 10 11 12 13 14 15 16 17 18 19 20 21 22 23 24 25* Debit balances in margin accounts at broker/dealers.Source: New York Stock Exchange through December 1996, FINRA thereafter, and Haver Analytics.Page 3 / June 23, 2022 / Stock Market Indicators: Margin DebtYardeni Research, Inc.www.yardeni.com
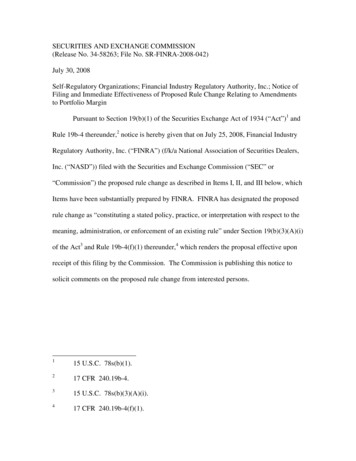
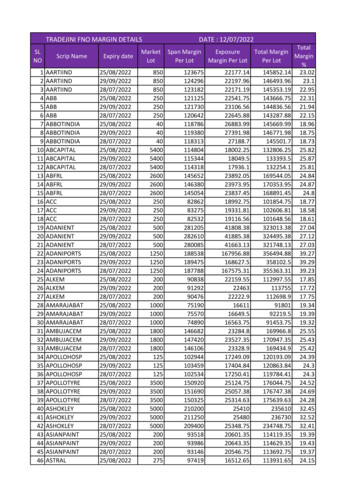
Margin DebtFigure 3.400350400MARGIN DEBT*(yearly change, billion -50-100May-150-100-150yardeni.com-200-20095 96 97 98 99 00 01 02 03 04 05 06 07 08 09 10 11 12 13 14 15 16 17 18 19 20 21 22 23 24 25* Debit balances in margin accounts at broker/dealers.Note: Shaded red areas are S&P 500 bear market declines of 20% or more. Yellow areas show bull markets.Source: New York Stock Exchange through December 1996, FINRA thereafter, and Haver Analytics.Figure 4.100100MARGIN DEBT*(yearly percent change)505000Mayyardeni.com-50-5095 96 97 98 99 00 01 02 03 04 05 06 07 08 09 10 11 12 13 14 15 16 17 18 19 20 21 22 23 24 25* Debit balances in margin accounts at broker/dealers.Note: Shaded red areas are S&P 500 bear market declines of 20% or more. Yellow areas show bull markets.Source: New York Stock Exchange through December 1996, FINRA thereafter, and Haver Analytics.Page 4 / June 23, 2022 / Stock Market Indicators: Margin DebtYardeni Research, Inc.www.yardeni.com
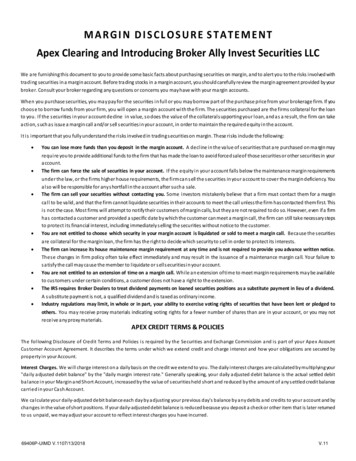
Margin DebtFigure 5.100050MARGIN DEBT & S&P 500800Margin Debt*(billion dollars) (752.9)S&P 500 Market Cap (32.1)40May6/15600304002020010yardeni.com0095 96 97 98 99 00 01 02 03 04 05 06 07 08 09 10 11 12 13 14 15 16 17 18 19 20 21 22 23 24 25* Debit balances in margin accounts at broker/dealers.Source: New York Stock Exchange through December 1996, FINRA thereafter, and Standard & Poor’s.Figure 6.44MARGIN DEBT(as a percent of S&P 500 market cap)33May22yardeni.com1195 96 97 98 99 00 01 02 03 04 05 06 07 08 09 10 11 12 13 14 15 16 17 18 19 20 21 22 23 24 25* Debit balances in margin accounts at broker/dealers.Source: New York Stock Exchange through December 1996, FINRA thereafter, and Standard & Poor’s.Page 5 / June 23, 2022 / Stock Market Indicators: Margin DebtYardeni Research, Inc.www.yardeni.com
Margin DebtFigure 7.9509003000MARGIN DEBT & RUSSELL 3000850800750700650Margin Debt*(billion dollars)May6/232000Russell 3000 com50095 96 97 98 99 00 01 02 03 04 05 06 07 08 09 10 11 12 13 14 15 16 17 18 19 20 21 22 23 24 25* Debit balances in margin accounts at broker/dealers. Beginning in 1997 data are debit Balances in customers’ securities margin accounts.Source: New York Stock Exchange through December 1996, FINRA thereafter, and Wall Street Journal.Figure 35030025020015010050MARGIN DEBT & S&P 15006/23S&P 1500 Composite IndexMargin Debt*(billion 006506005505004504003503002502001501005095 96 97 98 99 00 01 02 03 04 05 06 07 08 09 10 11 12 13 14 15 16 17 18 19 20 21 22 23 24 25* Debit balances in margin accounts at broker/dealers.Source: New York Stock Exchange through December 1996, FINRA thereafter, and Haver Analytics.Page 6 / June 23, 2022 / Stock Market Indicators: Margin DebtYardeni Research, Inc.www.yardeni.com
Copyright (c) Yardeni Research, Inc. 2022. All rights reserved. The informationcontained herein has been obtained from sources believed to be reliable, but is notnecessarily complete and its accuracy cannot be guaranteed. No representation orwarranty, express or implied, is made as to the fairness, accuracy, completeness, orcorrectness of the information and opinions contained herein. The views and the otherinformation provided are subject to change without notice. All reports and podcasts posted onhttp://blog.yardeni.comwww.yardeni.com, blog.yardeni.com,and YRI’s Apps are issuedwithout regard to the specific investment objectives, financial situation, or particular needsof any specific recipient and are not to be construed as a solicitation or an offer to buy or sellany securities or related financial instruments. Past performance is not necessarily a guideto future results. Company fundamentals and earnings may be mentioned occasionally, butshould not be construed as a recommendation to buy, sell, or hold the company’s stock.Predictions, forecasts, and estimates for any and all markets should not be construed asrecommendations to buy, sell, or hold any security--including mutual funds, futurescontracts, and exchange traded funds, or any similar instruments.The text, images, and other materials contained or displayed on any Yardeni Research, Inc.product, service, report, email or website are proprietary to Yardeni Research, Inc. andconstitute valuable intellectual property. No material from any part of i.com,and YRI’s Apps may be downloaded, transmitted,broadcast, transferred, assigned, reproduced or in any other way used or otherwisedisseminated in any form to any person or entity, without the explicit written consent ofYardeni Research, Inc. All unauthorized reproduction or other use of material from YardeniResearch, Inc. shall be deemed willful infringement(s) of this copyright and other proprietaryand intellectual property rights, including but not limited to, rights of privacy. YardeniResearch, Inc. expressly reserves all rights in connection with its intellectual property,including without limitation the right to block the transfer of its products and services and/orto track usage thereof, through electronic tracking technology, and all other lawful means,now known or hereafter devised. Yardeni Research, Inc. reserves the right, without furthernotice, to pursue to the fullest extent allowed by the law any and all criminal and civilremedies for the violation of its rights.The recipient should check any email and any attachments for the presence of viruses.Yardeni Research, Inc. accepts no liability for any damage caused by any virus transmittedby this company’s emails, website, blog and Apps. Additional information available onrequest.requests@yardeni.com
Note: Shaded red areas are S&P 500 bear market declines of 20% or more. Yellow areas show bull markets. Source: New York Stock Exchange through December 1996, FINRA thereafter, and Haver Analytics. Figure 4. Margin Debt Page 4 / June 17, 2022 / Stock Market Indicators: Margin Debt www.yardeni.com Yardeni Research, Inc.