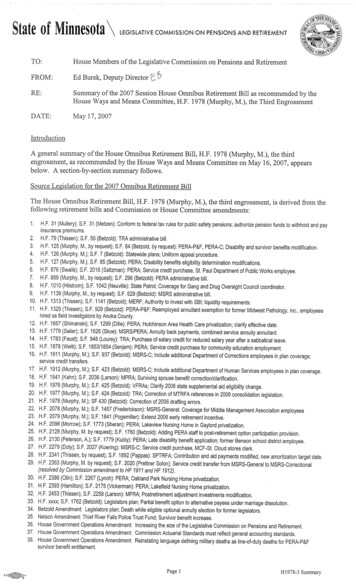
Transcription
De-risking the PlanThe Pros and Cons of Hibernationand Annuity BuyoutsDavid G. Eichhorn, CFAManaging Director, Investment StrategiesNISA Investment Advisors, L.L.C. 2014 NISA Investment Advisors, L.L.C. All rights reserved.All data presented are as of June 30, 2014, unless otherwise noted.The data supplied by NISA are based on NISA’s internal valuations and are maintained and intended only forNISA's internal use for portfolio management and performance calculation purposes. NISA does not providepricing, recordkeeping, brokerage or any related services. NISA Investment Advisors, L.L.C. is not acting in afiduciary or advisory capacity in connection with the material presented herein. NISA Investment Advisors,L.L.C. shall not have any liability for any damages of any kind whatsoever relating to this material. See otherimportant disclaimers on the last page.
Audience poll #1For a typical 60/40 pensionplan, how much market riskcan be eliminated by changingasset allocations?1) 25%2) 50%3) 75%4) 100%
Audience poll #2From which animal can welearn the most about liabilitydriven investing?1) Bear2) Bull3) Malagasy fat-taileddwarf lemur4) Bond trader
About NISATwo decades ofexperience withliability-basedstrategiesAssets under management (AUM) data as of 6/30/2014.Over 2/3rds ofour AUM in longcredit and longTreasuriesOver half ourderivativesnotionalmanaged inLDI-relatedengagements
Today’s agendaHow is funded status volatilitymeasured and managed?How do different de-risking toolsachieve different outcomes?What goes on under the hood inhibernation?
How volatile is funded status?120%Funded Dec-10Dec-11Dec-12Dec-13Source: NISA Pension Surplus Risk Index (PSRX , patent pending). Funded status reflects average funded status of PSRX constituent plans, the 100 largest US corporate defined benefit plans as determined by NISAbased on publicly available information. More information on the PSRX is available at www.nisa.com.
How can we measurefunded status tesObservedvolatilityof past dataMarket-basedestimates forequity andinterest ratevolatility
How can we managefunded status volatility?9%TRADITIONAL60% stocks,40% bonds2%HIBERNATION100% bonds0%BUYOUTAnnuity transferNISA calculations based on data from Bloomberg, Barclays, Citigroup, and JP Morgan as of 06/30/14. Funded status volatility represents an annualized one standard deviation range. Based on illustrative plans that are90% funded on a Citi AA basis with a liability duration of 12 years. Traditional strategy based on 60% global equity and 40% long duration credit fixed income allocation. Hibernation strategy based on 100% fixed incomeallocation comprised of credit and Treasury bonds.
What else is inthe de-risking sums
Today’s agendaHow is funded status volatilitymeasured and managed?How do different de-risking toolsachieve different outcomes?What goes on under the hood inhibernation?
Why do we wantto sReduceenterpriseriskManagelongevityrisk
How is enterprise risk affectedby pension de-risking?Enterprise risk before de-riskingAfter hibernation0.71xAfter buyout0.70xxSource: NISA calculations based on data from Bloomberg and Barclays as of 06/30/2014. Enterprise risk reflects annualized firm volatility for an illustrative firm with an operational volatility of 15%, a 1:1 debt to equityratio, a defined benefit pension plan that is 90% funded on a Citi Aa basis and is two times larger than the firm’s market capitalization. Pension liability and asset allocation details as described on earlier slide. Pensionvolatility and operational risk assumed to be correlated by a factor of 0.5. Analysis based on methodology described in our paper The Credit Rating Impact of Pension De-Risking available at www.nisa.com.
How can pension de-riskingpotentially impact credit rating?Hibernation 1notchBuyout?Source: NISA calculations based on data from Bloomberg and Barclays as of 06/30/2014. Credit rating impact based on distance-to-default model using data for an illustrative firm as described on previous slide.Analysis based on methodology described in our paper The Credit Rating Impact of Pension De-Risking available at www.nisa.com.
Why do we wantto sReduceenterpriseriskManagelongevityrisk Amount Uncertainty Timing
What’s the contribution profileof a traditional strategy? 1,000mmBase caseRange of outcomesContributions(present value) 800mm 600mmRange ofoutcomes5th-95thpercentiles 400mm 237 million“base case”(median) 200mm 0mmTRADITIONALSource: NISA calculations based on data as of 09/30/13 to be consistent with our paper Cash on the Barrelhead. Based on simulation analysis for hypothetical pension plan that is 90% funded versus a 1 billion PPAliability. Traditional strategy based on 60% equities and 40% fixed income. Based on our paper Cash on the Barrelhead available at www.nisa.com.
What’s the contribution profileof a hibernation strategy? 1,000mmBase caseRange of outcomesContributions(present value) 800mm 600mm 400mm 237mm 273mm 200mm 0mmTRADITIONALHIBERNATIONSource: NISA calculations based on data as of 09/30/13 to be consistent with our paper Cash on the Barrelhead. Hibernation strategy based on 100% long duration fixed income allocation and derivative-based interestrate hedge. Based on our paper Cash on the Barrelhead available at www.nisa.com.
What’s the contribution profileof a buyout strategy? 1,000mmBase caseContributions(present value)Range of outcomesBuyout price range 800mm 600mm 302mm 237mm 400mm 273mm 200mm 0mmTRADITIONALHIBERNATIONBUYOUTSource: NISA calculations, including calculations based on data from Penbridge Advisors based on data as of 09/30/13 to be consistent with our paper Cash on the Barrelhead. Base case reflects median fromsimulation analysis for traditional and hibernation cases, and average of third-party annuity price quotes for buyout. Range of outcomes reflects 5th-95th percentiles for traditional and hibernation and one standarddeviation range of prices for buyout. Based on our paper Cash on the Barrelhead available at www.nisa.com.
Pay now or pay laterContributions(present value) 400mm 300mm 200mmPPAfullyfundedBuyout base caseHibernation base case 100mmHibernation 5th-95th range 0mm012345678910 11 12 13 14 15 16 17 18 19 20YearSource: NISA calculations, including calculations based on data from Penbridge Advisors. Hibernation contributions reflect the median present value of required annual contributions plus any remaining PPA deficit infinal year based on the simulation analysis. Bars reflect annual contributions, solid lines reflect cumulative contributions, and dashed lines reflects 5th-95th percentiles range. Based on our paper Cash on the Barrelheadavailable at www.nisa.com.
How domotivations map tyriskBuyout
Today’s agendaHow is funded status volatilitymeasured and managed?How do different de-risking toolsachieve different outcomes?What goes on under the hood inhibernation?
Under the hood with ahibernation strategyDesignImplement Characterizeliability Build hedgeportfolios Understandobjectives andconstraints Manage toglidepath Design strategy Coordinate withother managersMonitor &Adjust Regularrebalancing Measure hedgeeffectiveness Adapt to changingmarket conditions
Malagasy fat-taileddwarf lemurDuring hibernation External environmentchanges Body temperature adjusts Wide range, 50-85 degreesSource: Dausmann, K.H.; Glos, J.; Ganzhorn, J.U.; Heldmaier, G. (2005). “Hibernation in the tropics: lessons from a primate”. Comparative Physiology
Hibernation responds tochanging volatility environment1.6%VolatilityRate vol0.8%Spread unded status 20%40%2%60%80%0%100%Credit allocationwith 100% fixed incomeSource: NISA calculations based on data from Bloomberg, Barclays, Citigroup and JP Morgan as of 06/30/14. Analysis based on an illustrative liability with a duration of 12 years discounted on the Citi Aa pensiondiscount curve. Funded status volatility reflects annualized funded status volatility for the illustrative plan that is 90% funded and invested in 100% fixed income (blends of credit and Treasuries) in addition to a derivativeoverlay when necessary to hedge remaining liability interest rate risk.
Today’s agendaHow is funded status volatilitymeasured and managed?How do different de-risking toolsachieve different outcomes?What goes on under the hood inhibernation?Q&A
DisclaimersThis material has been prepared by NISA Investment Advisors, L.L.C. This document is for informationand illustrative purposes only and does not purport to show actual results. It is not, and should not beregarded as investment advice or as a recommendation regarding any particular security or course ofaction. Opinions expressed herein are current opinions as of the date appearing in this material only andare subject to change without notice. Reasonable people may disagree about the opinions expressedherein. In the event any of the assumptions used herein do not prove to be true, results are likely to varysubstantially. All investments entail risks. There is no guarantee that investment strategies will achieve thedesired results under all market conditions and each investor should evaluate its ability to invest for a longterm especially during periods of a market downturn. No representation is being made that any account,product, or strategy will or is likely to achieve profits, losses, or results similar to those discussed, if any.No part of this document may be reproduced in any manner, in whole or in part, without the prior writtenpermission of NISA Investment Advisors, L.L.C., other than to your employees. This information isprovided with the understanding that with respect to the material provided herein, that you will make yourown independent decision with respect to any course of action in connection herewith and as to whethersuch course of action is appropriate or proper based on your own judgment, and that you are capable ofunderstanding and assessing the merits of a course of action. NISA Investment Advisors, L.L.C. does notpurport to be experts in, and does not provide, tax, legal, accounting or any related services or advice.Tax, legal or accounting related statements contained herein are made for analysis purposes only and arebased upon limited knowledge and understanding of these topics. You may not rely on the statementscontained herein. NISA Investment Advisors, L.L.C. shall not have any liability for any damages of anykind whatsoever relating to this material. You should consult your advisors with respect to these areas. Byaccepting this material, you acknowledge, understand and accept the foregoing.
our AUM in long credit and long Treasuries Over half our derivatives notional managed in LDI-related engagements Two decades of experience with liability-based . Wide range, 50-85 degrees Source: Dausmann, K.H.; Glos, J.; Ganzhorn, J.U.; Heldmaier, G. (2005). "Hibernation in the tropics: lessons from a primate". Comparative Physiology