Transcription
ECE 494: Laboratory ManualElectrical Engineering Laboratory IV(Part A: Energy Conversion)Version 1.3Dr. Edwin CohenDr. Sol RosenstarkDepartment of Electrical and Computer EngineeringNew Jersey Institute of TechnologyNewark, New Jerseyc 2003 New Jersey Institute of TechnologyAll rights reserved
ContentsLaboratory PracticeECE Laboratory Goals . . . . . . . . . . . . . . . . . . . . . . . . . . .The Purpose of a Technical Report . . . . . . . . . . . . . . . . . . . .Laboratory Grades . . . . . . . . . . . . . . . . . . . . . . . . . . . . .iiiiiiiiivThe Formal Laboratory ReportInstructions For Graphs . . . . . . . . . . . . . . . . . . . . . . . . . .vviiECE 494A Laboratory Safety RulesxExperiment 1 — Three Phase Power MeasurementsBackground . . . . . . . . . . . . . . . . . . . . . . . . . . . . . . . . .Power Measurements on 3-φ Systems . . . . . . . . . . . . . . . . . . .123Experiment 2 — Separation of Eddy Current and Hysteresis Losses 6Background . . . . . . . . . . . . . . . . . . . . . . . . . . . . . . . . .6Eddy Current and Hysteresis Losses . . . . . . . . . . . . . . . . . . .8Experiment 3 — Performance CharacteristicsBackground . . . . . . . . . . . . . . . . . . . . .Magnetization Characteristics . . . . . . . . . . .Characteristics of a Shunt Generator . . . . . . .Characteristics of a Compound Generator . . . .of DC Generators 11. . . . . . . . . . . . 12. . . . . . . . . . . . 14. . . . . . . . . . . . 15. . . . . . . . . . . . 16Experiment 4 — Load Tests on a Three-Phase Induction Motor 18Background . . . . . . . . . . . . . . . . . . . . . . . . . . . . . . . . . 18Three-Phase Induction Motor — Load tests . . . . . . . . . . . . . . . 20Experiment 5 — Power Transformer Open and Short Circuit TestsBackground . . . . . . . . . . . . . . . . . . . . . . . . . . . . . . . . .Open Circuit Test . . . . . . . . . . . . . . . . . . . . . . . . . . . . .Short Circuit Test . . . . . . . . . . . . . . . . . . . . . . . . . . . . .Excitation Characteristics . . . . . . . . . . . . . . . . . . . . . . . . .i2425262830
Laboratory PracticeThere are four core electrical engineering laboratories, beginning with EE 291.Each laboratory is designed to fill specific needs in the curriculum while insuring that each student grows into a responsible, competent professional person.Since each laboratory is unique, operating policies differ, but there are certainuniversal requirements for all Electrical and Computer Engineering (ECE) laboratories.1. All ECE laboratory reports shall follow the format outlined on the ECElaboratory Cover Sheets (bookstore).2. No food or beverage is to be brought into the ECE laboratories. Smokingis not permitted in the laboratory.3. Safe engineering practice shall be followed in all experimental work. Particular care shall be taken around line voltages, electrical machinery andspecial apparatus. All instructors and students shall know the location ofthe main disconnect for their laboratory area.4. Laboratory periods are assigned for specific classes. The heavy use ofthe laboratory facilities makes it virtually impossible to reschedule anylaboratory. Instructors shall weigh laboratory participation as part of thecourse grade.5. Students may work in the laboratory only with proper supervision. Students wishing to use an operating laboratory shall request permission fromthe instructor assigned for those periods. Work accomplished outside thenormal class period shall be signed by the instructor who is assigned forthose periods.6. Defective test equipment shall be tagged by the instructor after verification that the item is not functioning properly. Instruction books for allequipment may be borrowed from the ECE stockroom library for use during the laboratory period. They must be returned to the ECE stockroombefore the end of the period.ii
We intend to provide the best experimental and test facilities within our resources for every student doing laboratory work in the ECE department. Pleasehelp us by learning to check your test equipment and being able to troubleshootyour experimental setups quickly and accurately.ECE Laboratory Goals1. The main goal of these laboratories is to introduce the student to a broadrange of basic engineering practice.2. Another goal is to develop, for each student, practical technological skillsused to solve engineering problems.3. The student will learn the art and practice of technical communicationsby writing technical reports that are clear, concise and correct.4. Oral presentations, group discussions and informal critiques will be usedto stimulate critical thinking while in the laboratory environment.5. Finally, the laboratory provides an understanding of physical magnitudes,and the opportunity to examine elements of system behavior which arenot explained by idealized mathematical treatment.The Purpose of a Technical Report1. A good technical report should demonstrate to the supervisor that therequired experimental work was performed with satisfactory results.2. An engineering college report provides practice in the art of technicalwriting.3. The individual discussions and conclusions in a group laboratory reportallow each student to develop a deeper understanding of the laboratorywork, and to use creativity in improving or applying practical laboratoryexperiences.4. The technical report is usually written with the aid of references. Skills inlearning how to find out are valuable professional assets that are associatedwith professional engineering and technical communications.iii
Laboratory GradesIt is very difficult to evaluate individual performance where a group effort isinvolved unless methods are employed to provide some individualization to thelaboratory work.Each instructor has the responsibility to insure that all students are provided the best opportunities to develop their technological skills. To maintainreasonable standards of performance, the instructor may assign students withunique skills to various laboratory groups. In essence, this arrangement becomesa student helping student proposition.College should be a unique experience for everyone. To make the most ofthis opportunity, it is necessary to learn how to learn. One’s peers can be ofgreat assistance here. Communication with them can be very rewarding and isdistinctly encouraged.There is no violation of professional ethics in studying the reports of otherpersons. It is a violation of professional ethics to use another’s work withoutdirect reference or written permission. Professional responsibility does requirethat credit be given to others from whom concepts, ideas and quotations havebeen used.Where students have jointly prepared a group report, each part of the reportshould bear the name and signature of the person responsible for that part ofthe report.iv
The Formal LaboratoryReportThe purpose of the laboratory report is:1. To provide an accurate account of the work that was performed in thelaboratory.2. To present in a clear manner the data that was accumulated, and theconclusions that were drawn from it.3. To interpret the results and discuss them in the light of the underlyingtheory.For a report to be useful, it must be logically arranged so that it is clear tothe reader. The description of the various procedures must be accurate and theresults obtained must be as precise as the measurements permit.The format of a formal laboratory report is somewhat flexible depending onthe particular requirements of the persons concerned, (company policy, government specifications, course requirements, and so on). For the laboratory workin the Department of Electrical and Computer Engineering the following formatand sequence of presentation will be required for a formal report.1. Title Sheet and CoverThe appropriate title sheet-cover is available at the college bookstore.This cover provides spaces for the experiment title, names of the groupmembers, data and other information. It should be completed in ink ortypewritten. All other parts of the report should be written in ink ortypewritten unless otherwise specified.2. Abstract of SynopsisThis summary includes the apparatus tested, the type of results obtainedand a summary of conclusions reached. The purpose is to provide a concentrated survey of what experimental work was accomplished.v
3. ProcedureThe section consists of a concise description of the apparatus used, themanipulations made, and the observations taken. Reference should bemade to the appropriate circuit diagrams that follow later in the report.The procedure should not be a mere copy of the “Instructions” printed inthe laboratory manual.4. Final connection DiagramThe connection diagrams should be complete within themselves. All pertinent information concerning ratings and stockroom numbers of the measuring equipment and apparatus tested should be included. Standardelectrical symbols as listed in the EE 11 Manual should be used. A neatpencil diagram will be acceptable, if suitable for photocopying.5. Data Sheets(a) The observed laboratory data should be placed at the end of thereport. The original laboratory data should be taken in ink or ballpoint pen and should have no erasures. All information includingmeter numbers, meter scales, meter factors, must be recorded. Correction of recorded data is made in the laboratory by drawing a linethrough the incorrect entry and writing in the new entry.(b) The translated laboratory data should follow the connection diagrams. This data should be a summary of the laboratory measurements in final form. All meter multiplying factor computationsshould be carried out before entering readings on the final data sheet.All reports of the experiment should be identified on the data sheet bya descriptive title and reference made to the proper circuit diagram.The use of such references as “Part I” should be avoided.6. Computations and ResultsThe computations should be made in a logical manner in simple computation form, with a table of results that follows. The method should beexplained to the reader and all terms and symbols defined; any formulasor equations taken from reference material should be properly footnoted.The final results should appear in tabular form presented in a manner thatmakes them stand out. This usually requires some individual planning. Ingeneral all curves that are plotted in a report are preceded by a supportingtable of results found in the “results” section.7. CurvesSee “Instructions for Graphs.”Note: In some cases special graph paper (semi-log, etc.) will be required.This will be pointed out in the “procedure” portion of the laboratorymanual.vi
8. Phasor DiagramWhen phasor diagrams are required they should be plotted, to scale, onquadrille ruled paper. A scale should be chosen so that a quantitativeappraisal of the shortest vector can be made. A neat pencil diagram willbe acceptable if it is suitable for photocopying.9. Discussion and ConclusionsTopics for discussion are usually suggested in the instructions. These suggestions provide a minimum framework around which the student shouldbuild a discussion. The discussion section provides the student with thegreatest opportunity for originality in thought and logical reasoning. Athoughtfully clear discussion can greatly increase the value of a report.It is often possible to provide clear explanations by means of curves ordiagrams, and these should be used where applicable.Conclusions, results, comments on sources of error and their probablemagnitude should be made. In some instances recommendations are inorder. The discussion of results should be a student’s individual effort.10. BibliographyA complete bibliography presented in standard form must be included.This bibliography must appear if footnotes are used. The bibliographyshould also include any credits to the work of other individuals, even ifunpublished, unless this was accomplished through footnotes.11. English StyleThe report should be written in past tense third person impersonal.Instructions For GraphsMaterialsGraphs are to be consistent with good drafting style. Curves should be drawn onan adequate standard co-ordinate paper. They should be turned to be readablefrom left to right or from bottom to top (never from top to bottom). All figuresshould be captioned in a manner similar to that used in this manual.Preparing Graphic SheetsGraphs must indicate where, when and by whom the work was done. They musthave a descriptive title. The graph sheets must contain enough information tomake them sufficiently complete to be considered separately from the rest of thereport.vii
Whenever possible, the meaning of the graph should be clarified by theaddition of a small drawing somewhere on the sheet indicating, for example,how voltages were applied to the circuit or what measurements were made.Place axes inside the printed edge; do not write in the white margins. Bothaxes of a graph must be marked with the scale and name of the quantity e.g.,voltage (not V), and the corresponding units.Choose a scale interval such that each main division represents 1, 2, or 5units or a multiple of ten times 1, 2, or 5.Enlargement of a graph scale sometimes provides greater precision. However,nothing will be gained if, at the smaller scale, the plotted points already exhibitscattering about the “average” line. It is also useless to expand the scale to thepoint where one unit in the last significant figure is represented by much morethan a few divisions of the graph paper.Start both scales at the origin (0, 0). In the case where a large part of thegraph sheet, say 50 %, would be left unused, the origin may be omitted providedit has no significance in the interpretation of the graph.When the range of the horizontal variable is very broad, a uniform scalemay result in an overcrowding of the experimental points taken in the lowerpart of the scale. This problem may be solved by dividing the horizontal rangeinto several parts and plotting a separate graph for each of these parts, using auniform scale. However, a single plot covering the whole range is often desirableand a logarithmic scale is then found to be more convenient than a uniformscale. Semilog graph paper is recommended in this case.Before using a semilog graph paper it is important to ascertain that it hasa suitable number of cycles. A cycle represents a decade, that is, the numericalvalue of the variable at the end of the cycle is equal to ten times its value atthe beginning of the cycle. Thus if the variable to be plotted takes on valuesfrom 2 to 425, three decades will be used, namely, 1 to 10, 10 to 100, and 100to 1000. In this case a 3-cycle semilog paper is needed. Likewise, if the valuesgo from 14 to 35000, four cycles are needed to show the intervals 10 to 100, 100to 1000, 1000 to 10,000, and 10,000 to 100,000.Plotting PointsIn plotting a graph from experimental data, the plotted points should alwaysbe identified by a small circle, square or similar item. In plotting a graphfrom an analytical expression, use enough points to determine a smooth curve.The curve should go exactly through the points, which should not be circled ordistinguished in any way.viii
Drawing CurvesIn plotting a graph of experimental values, draw a smooth average curve whichmay or may not pass through most of the plotted points. When the propercurve is drawn, the plotted points will exhibit a random scattering on each sideof the curve and will, on average, be as close as possible to the curve. Anexperimental curve should never show a special wave or bump by virtue of asingle plotted point. Such complications in the curve would require that severalpoints indicate the trend.Interpreting GraphsOne of the purposes for a graph is to provide the writer of the report (as well asthe reader) an overall picture of the data. Sometimes it is this picture which isthe desired conclusion. A direct proportion is indicated by a graph only whenthe graph is a straight line passing through the origin. Frequently, there is asimple explanation available to show why the graph misses the origin. A noteto that effect in the discussion of the graph is desirable in such cases.In determining the slope of a tangent or of a straight line graph, use as longa straight segment as possible. Read values off the straight line; do not useplotted values.Remember that tabulated experimental values contain experimental errors.The graph is a means of averaging out this error. A value read from the “smoothaverage” curve is likely to be closer to the “true” value than the plotted valueswhich the curve misses.Multiple GraphsWhenever any information can be derived from the comparison of two graphs,or whenever two curves represent the same of similar tests, they should beplotted on the same sheet with the same axes. When several graphs are plottedon the same axes, distinguish between them by lettering a descriptive word orphrase along each curve. If the plotted points of two graphs tend to mingle, usedifferent identifying marks for each set of points.ix
ECE 494A LaboratorySafety RulesRead ALL of the following rules carefully, and remember them while workingin the laboratory.1. Never hurry. Haste causes many accidents.2. Always see that power is connected to your equipment through a circuitbreaker.3. Connect the power source last. Disconnect the power source first.4. Never make wiring changes on live circuits. Work deliberately and carefully and check your work as you proceed.5. Before connecting the power, check your wiring carefully for agreementwith the wiring diagram for an accidental short-circuit and for loose connections.6. Check out the supply voltage to make sure that is what you expect. Forexample: AC or DC, 120V, 208V or 240V.7. Do not cause short-circuits or high currents arcs. Burn from arcs may bevery severe even at a distance of a few meters. Report all electrical burnsto your instructor.8. Be careful to keep metallic accessories of apparel or jewelry out of contact with live circuit parts and loose articles of clothing out of movingmachinery.9. When using a multiple range meter always use the high range first todetermine the feasibility of using a lower range.10. Check the current rating of all rheostats before use. Make sure that nocurrent overload will occur as the rheostat setting is changed.x
11. Never overload any electrical machinery by more than 25% of the ratedvoltage or current for more than a few seconds.12. Select ratings of a current coil (CC) and potential coil (PC) in a wattmeterproperly before connecting in a test circuit.13. Do not permit a hot leg of a three phase 208V supply, or of a 240V or120V supply to come in contact with any grounded objects, as a dangerousshort-circuits will result.xi
Experiment 1 — ThreePhase Power MeasurementsObjectives To demonstrate the line and phase relations in 3-phase balanced networks. To study and demonstrate the two wattmeter method of measuring thepower in 3-phase networks.Equipment Five digital multi-meters from the stockroom. Two wattmeters with 0 - 300 watts scale. Three resistors with values very close to each other. One three-phase variac. (The one mounted on a small platform withcasters which looks like a transformer with a wheel on top.)References Richard Dorf, Introduction to Electric Circuits, pp. 777-793, 2nd edition,John Wiley & Sons, Inc., 1993. D. Johnson, J. Johnson, J. Hilburn, Electric Circuit Analysis, pp. 409-432,2nd edition, Prentice Hall, N. J., 1992.1
BackgroundThree-phase balanced networks are used in the power industry for reasons ofeconomy and performance. Three-phase generators and motors run smoothly,with no torque pulsations, unlike single phase machines. In addition balancedthree phase systems may be operated as three wire or four wire systems, withmuch less copper needed for the power delivered as compared with three singlephase systems.At a power generating plant, the windings of a three phase machine arearranged to provide three voltages, each 120 apart in time and, in the commonbalanced system, usually all of the same magnitude. These three voltage sourcesmay be connected in a wye (Y) or a delta ( ) configuration. Three phase loadsmay also be connected in wye or delta connections. The wye connection has acentral node to which a neutral wire may be joined, but the delta connection isa three wire system without a node for a neutral (or ground) connection.To measure power in a 3-phase system, it would seem necessary to use threewattmeters, each connected to neutral for a common terminal, and each responding to a line-to-neutral voltage and a line current. One would then addup the powers indicated on each wattmeter. Analysis of such a circuit showsthat one wattmeter is redundant, hence the two-wattmeter method of measuring3-phase power was developed for three wire systems. This method is satisfactoryeven if the loads are unbalanced. It is necessary to connect the wattmeters taking into account the polarity of their coils. When the current enters the markedterminal of the current coil and the voltage positive is connected to the markedterminal of the voltage coil, the reading represents power absorbed. In thatcase the algebraic sum of the wattmeters determines the total load power. Inreactive circuits it may be necessary to reverse the current coil of one wattmeterin order to get an upscale deflection. This reading is taken as negative whenthe total power is determined algebraically.If a 3-phase system has four wires, it is necessary to use three wattmeters,unless it is known that the system is balanced and therefore no current is flowingin the neutral wire. For any balanced N wire system it is necessary to use N 1wattmeters to measure the total power.2
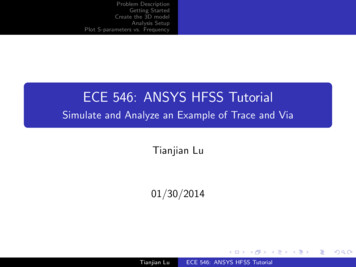
BW2c3 phase loadACCCI3InnSFigure 1.1: The balanced three phase wye connection.Power Measurements on 3-φ Systems1. Measure resistor values before the experiment; their values should beclosely matched.2. A voltage distribution panel is located on the side of the bench. Use avoltmeter to verify that the voltage is 208 volts between phases.3. Connect the three-phase wye circuit as shown in figure 1.1. Note that allmeasurements in this experiment are AC. Estimate all instrument readingsfor a source voltage of 100 V between phases. Select your meter scalesaccordingly.4. Read the wiring diagram on the three-phase variac carefully and adjustthe output to be 100 volts between phases.5. Without connecting the neutral, measure and record all currents, voltages(line and phase), and power. Record the results in table 1.1.Note: There are two sets of connections needed for a wattmeter to work.The terminals marked Amp should be in series with the load whose poweris to be measured. The terminals marked Volts should be in parallel withthe load whose power is to be measured. The Volt side has three connectors. When the 150 volt connector is used with the connector marked , the wattmeter will read up to 300 watts. When the connector marked300 volts is used with the one marked , the wattmeter reading must bedoubled. For example, if 120 watts is read on the meter and the 300 voltand connectors were used, then the power measured will be 240 watts.Note: If the deflection of the wattmeter is in the wrong direction (the3
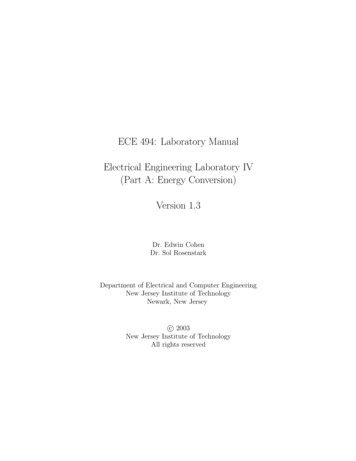
voltmetersaammeterswattmetersI1CCVLVL3 phase loadAIp1W1PCVp2I2bVLPCIp2BIp3CW2CCcI3Figure 1.2: The balanced three phase Delta connection.needle wants to go below the scale), disconnect the power supply andsimply reverse the connection on the current side of the wattmeter. Thewattmeter reading is then negative.6. Connect an ammeter from the neutral of the resistor circuit to the neutralof the three-phase variac and observe the current flow. The current shouldbe read on the 300 mA (or lower) scale.7. Measure all currents, voltages and power readings. Record all measurements in table 1.1.8. Connect the 3-phase circuit as shown in figure 1.2. Measure and recordall currents, voltages and power readings.Note: There will not be enough ammeters for measuring all the line andphase currents at the same time. Measure the line currents first, thenreconnect to measure the phase currents.Report1. Calculate the total load power, using the current and voltage data, by twodifferent methods.2. Tabulate the total load power from the calculations and from the twowattmeter measurement method.3. Verify phase and line voltage/current relationship.Discussion Questions1. Discuss any differences or similarities for the data obtained for the Yconnection with or without neutral connection.4
Table 1.1: Data sheet for Y and connected load.YY w/o neutral w/ neutral connectionLine VoltageVabin voltsVbcVcaPhase Voltage VAN—in voltsVBN—VCN—PowersW1in wattsW2Line/PhaseI1 /Ip1CurrentsI2 /Ip2in ampsI3 /Ip3IN——ResistorRAin ohmsRBRC2. Would the results be affected if wattmeter 2 were placed to measure theline current b-b’ and both wattmeter potential coils were brought to linec, instead of line b.3. Show a diagram for using only one wattmeter to measure the power in onephase of a balanced three-phase load.5
Experiment 2 — Separationof Eddy Current andHysteresis LossesObjectivesTo separate the eddy-current and hysteresis losses at various frequencies andflux densities using the Epstein Core Loss Testing equipment.Equipment One low-power-factor (LPF) wattmeter from the stockroom. Two digital multimeters from the stockroom. One Epstein piece of test equipment. (It is mounted on a 3 ft 3 ft slideequipped square platform stored in a cabinet and weighs 22 lbs.) Single Phase Variac. (Of cylindrical shape, it weighs about 15 lbs, and isabout 10 inches in diameter and about 12 inches tall.)References M. I. T. Staff, Magnetic Circuits and Transformers, pp. 144-154, JohnWiley and Sons, 1985. Vincent Del Toro, Basic Electric Machines, pp. 34-38, Prentice Hall, 1990.BackgroundDesigners of electrical machines must know the magnetic characteristics of thematerial they use in order to predict the performance of their finished products.In this experiment core losses resulting from eddy currents and hysteresis in6
steel sheets will be measured. The Epstein test frame is a special one-to-onetransformer having provisions for inserting the sample where it serves as a core.The testing procedure is specified by the American Society for Testing Materials(ASTM).Description of the ApparatusThe windings are on four sections of hollow square fiber, each 1.57 1.57 inchessquare and about 17.25 inches long. Each section is wound with 150 turns ofNo. 18 wire. These turns are wound parallel to each other and in the sameplane so that the primary and secondary turns lie alternately adjacent to eachother in order to improve their magnetic coupling. The core material used isArmco 6M (USS Transformer 66).The four sections are arranged to form a square. Primary turns on allsections are connected in series. The secondary turns are also connected inseries.The sample to be tested consists of 10 kg (22 lbs) of strips 3 cm wide and59 cm long. One half of the sample is cut with the grain and the other half iscut across the grain. Four equal bundles are made of the specimen and eachbundle is tightly taped and placed in a section of the winding. The four endsare then butted together in the form of a square with a piece of 0.004 inch thickpaper in each joint, and all joints made as tight as possible.Because of the tight coupling between the primary and secondary coils, thevoltage induced in them by the AC magnetic flux is the same. Since the primarywinding carries the current which establishes the magnetic flux in the core, thevoltage applied to the primary winding includes the ohmic voltage drop due tothe resistance of that winding. The secondary winding, on the other hand, isopen-circuited; hence, its terminal voltage is equal to the induced voltage. Thelatter is given byEs 4.44f Ns (Bm A)(2.1)withA ml·p(2.2)where,. . . . .p .A .f NsBmmlnumber of secondary turns 600maximum flux density in W b/m2weight of bundle of strips 10 kgtotal length of strips 2 m3(2.3)(2.4)(2.5)(2.6)density of steel in kg/m 7700cross-sectional area of bundle strips(2.7)(2.8)frequency of AC supply.(2.9)7
Substituting the values for Ns , m, l and p, we getEs 1.73 f Bm(2.10)In order to separate the eddy-current loss (Pe ) and hysteresis losses (Ph )when only total power loss (W ) is measured, the following calculations must beperformed.PhPeWf nKh B m f2Ke Bm f 2Ph Pen2 Ke Bm f Kh Bmf(2.11)(2.12)(2.13)where Kh and Ke are constants related to the material of the transformer coreand its volume.In (2.13) we see that if (W/f ) is plotted against f for fixed Bm , a straightnline is obtained whose slope is Ke Bm and y-axis intercept Kh Bm. The hysteresispower loss for that value of Bm is then obtained by multiplying the y-interceptby the frequency. The corresponding eddy-current loss is the slope multipliedby the frequency squared. The procedure is repeated for each value of Bm .nTo obtain the value of Kh , the logarithmic values of Kh Bmobtained aboveare plotted against log Bm . The slope of the resulting straight line is n and itsy-intercept is log Kh . Thus Kh and n can be obtained. Similarly, by plotting2log Ke Bmagainst log Bm as a straight line of slope 2, log Ke can be obtainedand, hence, Ke .An alternator-dc motor set is used as a variable frequency AC voltage supply.The frequency can be changed by varying the motor speed. The magnitude ofvoltage can be altered by varying the alternator field current.Note: Only the instructor can change the frequency and the maximum ACvoltage. The students can then obtain fractions of the supplied voltage byturning the single-phase variac.Eddy Current and Hysteresis Losses1. Complete table 2.1 using (2.10).2. Connect the circuit as shown in figure 2.1.3. Connect the power supply from the bench panel to the INPUT of thesingle phase var
1. All ECE laboratory reports shall follow the format outlined on the ECE laboratory Cover Sheets (bookstore). 2. No food or beverage is to be brought into the ECE laboratories. Smoking is not permitted in the laboratory. 3. Safe engineering practice shall be followed in all experimental work.