Transcription
Statement ofHal Salzman, Ph.D.ProfessorE.J. Bloustein School of Planning & Public PolicyJ.J. Heldrich Center for Workforce DevelopmentRutgers UniversityHearing on:“Immigration Reforms Needed to Protect Skilled American Workers”Submitted to theSenate Committee on the JudiciaryU.S. SenateMarch 17, 2015
Mr. Chairman and members of the Committee, thank you for inviting me to speak on the topic of“Immigration Reforms Needed to Protect Skilled American Workers,” and in particular on high-skilllabor demand and supply, and the size and impact of the high skill guestworker labor force. My analysisdraws on several decades of workforce research on technology industries, globalization, and severalrecent, in-depth studies of STEM labor supply and, currently, on STEM educational pathways andattainment. This research was conducted with my colleagues Leonard Lynn at Case Western ReserveUniversity, Lindsay Lowell at Georgetown University, and Daniel Kuehn, American University, and isfunded by the Sloan Foundation and the National Science Foundation.1Assessing approaches to immigration reform for high skill workers involves, at the core of the issue,understanding whether the nation benefits from technology firms using their current levels of high-skillguestworkers and the likely impact of various legislative changes proposed. Let me start with a point onwhich nearly all are in agreement: guestworker flows should be something greater than zero, andsomething less than 145 million (the size of the U.S. workforce). Thus, the issue is not about whether ornot to have guestworkers; it is about determining the right number and the policies governing their workconditions. In terms of high-skill guestworkers, primarily on H-1B and L visas, determining the rightnumber, or evaluating whether increases or decreases in the number are best for the economy, and impacton the American worker, we want to know: Is there a shortage that impedes business productivity andgrowth and national prosperity? Answering this question depends fundamentally on examining theevidence about three issues:(1) The adequacy of supply of U.S. STEM graduates and workers;(2) The size of current and proposed guestworkers flows;(3) Impact on U.S. workforce, on innovation capacity, on the nation.When considering the issues of whether there are enough U.S. students and workers to fill STEM jobs,whether industry has a real labor shortage or is just dissatisfied with the time and effort it takes to find theworkers it wants, or is dissatisfied with the wages it needs to pay to get the workers it wants, let me saythat there is no single study that conclusively answers those questions; our measures are often impreciseor at an aggregate level that may not address the situation in each and every firm or industry. What wewant to consider, thus, is what is indicated by the preponderance of evidence, and what are the mostdirect and relevant measures of the demand for, and impact of, STEM guestworkers.My colleagues and I have examined the key questions using multiple methods, data, and indicators—fromfield work and interviews at firms to analysis of large, national datasets. The preponderance of evidenceis fairly clear that:(1) The U.S. supply of top performing graduates is large and far exceeds thehiring needs of the STEM industries, with only half of new STEM graduates1The projects are supported through grants from the Alfred P. Sloan Foundation and the National ScienceFoundation, (Human and Social Dynamics Program, #SES-0527584; Social Dimensions of Engineering, Scienceand Technology #0431755). Expert research assistance and analysis was provided by David Hersh, and SusanFerrara. The views expressed are those of the author and should not be attributed to Rutgers University, the J.J.Heldrich Center or the E.J. Bloustein School.1 P age
finding jobs in a STEM occupation (and only a third of all STEM graduates in theworkforce hold a STEM job);(2) All market indicators, such as wages and employment rates, suggest that, withfew exceptions, an ample supply of labor is available given current and projecteddemand (demand for computer science graduates, as stated by the IT industry, canbe met by just half to two-thirds of the current annual supply of U.S. graduates);(3) Guestworker supply is large and highly concentrated in the IT industry; it islikely a factor in the flat wage levels in the IT industry and, perhaps, for asubstitution of young, entry-level guestworkers for experienced, incumbent, U.S.workers;and, most importantly,(4) The predominant function of IT guestworker visa programs is to facilitate theoffshoring of IT work—that is, the ability of firms to move IT work from the U.S.to offshore locations is highly dependent on their supply of H-1B and L visas fortheir companies. These are companies such as IBM, Accenture, Deloitte, Ernst &Young as well as the internationally-based firms such as Infosys, Wipro, and TCS.The second, and growing, use of guestworkers is by product firms and U.S.-basedservice firms to staff their workforces for largely domestic-based projects. Thelargest H1B visa sponsors among these would include Microsoft, Google, Intel,Oracle, Apple, and Amazon (Top 100 H1B Visa Sponsors, 2013). There are thena number of smaller firms that provide, in aggregate, significant staffing servicesboth temporary and permanent. These firms supply guestworkers to a range ofother firms and are more often identified as those offering substantially lowerwages and engaging in substandard labor practices.These findings suggest that:(5) The large use of guestworkers by firms in each of these segments combine, in aggregate, todistort the STEM labor market, with the number of guestworkers equal to two-thirds of currententry-level and early-career hiring; it is high-skill guestworker policies, rather than marketcompetition, that currently determine working conditions and job opportunities for U.S. STEMworkers, with diminished opportunities for students and workers who wish to pursue a career inthe IT industry. 2(6) Current guestworker visa policies for students and new graduates appear to provide incentivesto colleges and universities to establish Masters programs that, as their business model, almostexclusively recruit foreign students into lower quality programs that provide easy entry into theU.S. labor market, further expanding the supply of entry-level STEM workers.(7) Proposed high-skill guestworker legislation would expand the supply of guestworkers tolevels greater than the total number of new technology jobs; that is, these visa changes wouldprovide enough guestworkers to fill every new job opening in the IT workforce with a reserveNB: my use of “U.S. workers” and domestic workers/workforce denotes both native and immigrantworkers, and both citizen and permanent resident (green card) workers; that is, from a labor marketperspective, the labor pool is segmented into those workers in the U.S. who comprise the labor pooldirectly available to employers as distinct from the guestworker labor pool which is available onlythrough policies and conditions set by Congress.22 P age
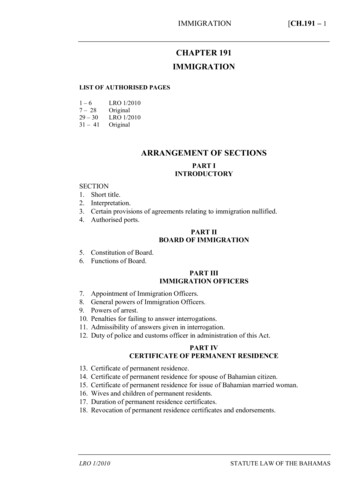
large enough to allow firms to legally substitute young guestworkers for their incumbentworkforce, both directly and through expanded offshoring.(8) “Green Cards for Grads” provisions in I-Squared and other bills would further distort the U.S.higher education system, providing incentives for colleges and universities to establish, or expandcurrent Masters programs as “global services” that offer a green card for the price of a graduatedegree, and that are offered primarily or even exclusively for foreign students and directly orindirectly exclude U.S. students.In sum, current policies and the proposed changes in high skill guestworker visas and immigrationpolicies that increase the supply of high skill guestworkers are likely to exacerbate the alreadydeteriorating labor force conditions and career prospects for STEM graduates and workers. Notably, it isonly the IT industries that claim worker shortages whereas nearly all other STEM fields haveacknowledged the need to address problems of oversupply and, in many science fields, poor careerprospects for STEM graduates.1. The supply of STEM graduatesThe U.S. STEM workforce numbers about 7.5 to 8 million, or about 5 percent of the workforce. Thecomputer occupations comprise about half (48.5%) of the STEM workforce at 3.7 to 4 million workers. Ifwe use the BLS projections for IT job growth, which is comprised of replacements (for those leaving theworkforce because of retirements and job separations—layoffs and quits) and growth of the workforce,the IT industry needs approximately 124,000 new workers each year. Mircosoft’s Washingtonrepresentative and counsel Brad Smith (in his Congressional testimony) uses an earlier BLS projection ofan annual increase of 120,000, and the trade organization code.org, echoed by the Computing ResearchAssociation, use 150,000 as the expected annual demand for new IT workers (Harsha, 2014). Smith andthese associations then assert that the BLS workforce growth estimates represent the demand forcomputer science graduates. Matched against annual computer science graduation of 67,000 in 2012, theclaim of a supply shortage is made. It is these statistics and claims that are repeated widely.However, such claims misinterpret the BLS workforce projections for the computer occupations inasserting it is a demand for computer science graduates. For example, Daniel Costa conducted a detailedstudy of these computer science shortage claims by Microsoft and other companies and shows theevidence does not support these claims because, among other reasons, “[i]t is a well-known fact thatcomputer science graduates are not the only source of new hires in computing .less than one-fourth toless than one-half of workers in computing occupations have a computer science degree” (Costa, 2012).In fact, of those currently in computer occupations, only 14 percent hold a computer science degree andanother 4 percent have electrical engineering (EE) degrees. Since that reflects the education level of theentire current IT workforce, of all ages, it could understate the current cohort education levels.Examining recent cohorts of all new entrants into IT occupations who have a post-secondary education,we find 34 percent have a bachelors or master computer science degree (See Figure 1); of just the pool offour-year college graduates entering computer occupations, 46 percent have a computer science degree.About 36 percent of entrants into computer occupations do not have any four year degree. Thus, weestimate that demand for new workers in computer occupations with a computer science degree asapproximately 29 percent of the BLS projection of total demand for new workers (65% of new workforceentrants in computer occupations have a four-year degree and 46% of those have a degree in computerscience, or 29% of all new workforce entrants). Using the actual educational composition of the computeroccupations as an estimate of hiring demand by education and degree, the supply of computer sciencegraduates needed to meet industry demand would be approximately 36,500 computer science graduates3 P age
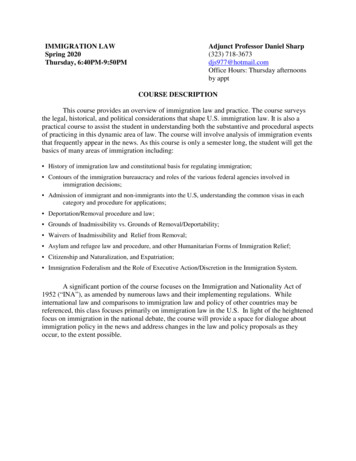
each year (based on the BLS projection of 124,000 new jobs). Figure 2 shows the historical graduationnumbers of computer science graduates.Figure 1: Education of IT workforce with postsecondary educationSource: BPS/NCES; calculations by authorCurrent graduation rates indicate that projected employment demand specifically for computer science(CS) graduates can be met by about half of the current supply of 70,000 Bachelors CS graduates eachyear, and the balance of demand can be met by those graduating with a range of other degrees, as is thehistorical pattern. Even if current industry hiring is for a much greater level of computer scientists thanhistorical hiring patterns, the current pool of graduates would provide sufficient numbers of computerscientists to meet industry demand. Our analysis of a large, nationally representative survey of a recentcollege cohort by the National Center for Educational Statistics finds that only two-thirds of computerscience graduates went into IT jobs in 2009 (that would include all IT jobs, not just those for formallydefined as computer occupations). Of those not landing an IT job, half said they found a better jobelsewhere. Fully one third reported there were no IT jobs available (although this was the year after thestart of the Great Recession, this is only slightly lower than the historical trend; Salzman, et al., 2013).Also worth noting is that an additional 64,341 students earned an Associates degree, certification orlicensure in IT in 2012, also far exceeding the expected growth of 44,600 new IT workers with less than aBachelors degree for work in the computer occupations (many of whom do not require an Associatesdegree, certification or licensure).4 P age
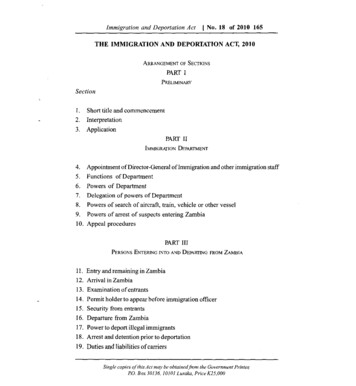
Figure 2: Number of Computer Science Graduates sBachelors30,00020,00010,0000STEM beyond ITThe demand for guestworkers and the various claims of “shortages” often discuss the labor marketdemand as a more general STEM workforce/industry problem. As noted above, guestworkers arepredominantly employed in the IT industry, and are predominantly used to support offshore softwaredevelopment, with a second significant use to provide lower cost labor for positions in the U.S., eitherdirectly for software product firms or for their subcontractors and personnel staffing firms. If there reallywere a shortage of technical and scientific talent in the U.S., we should observe it in other STEMindustries, not just in IT. In fact, most of the other STEM occupations and industries –science,engineering, and math—should have workforce that are more difficult to develop given the moredemanding requirements and longer time period required for education and training. Of all the STEMfields, “T”, which is almost exclusively computer science at the four-year college degree level, and math(also an IT “feeder” major) are the least demanding fields of all the STEM disciplines in terms of STEMcredit hours.In Figure 3, which plots the distribution of credit hours by major (of those graduating at four-yearcolleges), the computer science and math majors take far fewer STEM credits than either science orengineering graduates. It should, thus, be easier to expand the number of computer science and mathmajors than science and engineering majors given current resources.5 P age
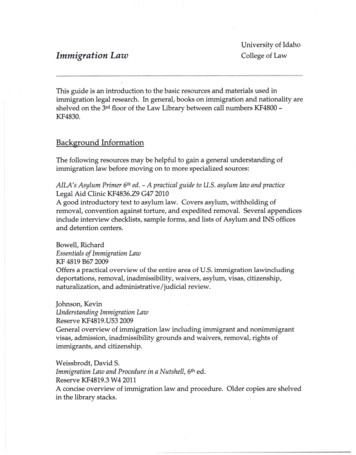
Figure 3: Credit Hours by Graduating Major.03Kernel density estimate0.01Density.02Life&Phys ScienceMathCS/ITEngineering30507090110Transcript: STEM: credits earned130150kernel epanechnikov, bandwidth 1.7234Source: BPS/NCES; calculations by authorYet, science and engineering firms are not claiming they need guestworkers to address a shortage. In fact,studies of science careers finds there is a glut of Ph.D. life scientists resulting in poor employmentprospects for new graduates and post-doctoral scientists (e.g., Teitelbaum 2008; Stephan, 2012; Freeman,2004; NIH, 2012). The National Institutes of Health has developed a program to help new biomedicalPh.D.s find alternative careers in the face of “unattractive” job prospects in the field (NIH, 2012). TheNIH Director’s “Broadening Experience in Scientific Training” (BEST) program was launched threeyears ago in response to findings by many researchers and the NIH Advisory Committee to the Director(ACD) Biomedical Workforce Task Force which found few career opportunities for biomedical scientistsin traditional science fields; this program is intended to address the oversupply of biomedical scientists bydeveloping alternative career paths they can pursue. Overall, in the science fields, there are twice asmany university graduates at the Bachelors level than the number who enter into a science occupationevery year. Similarly, engineering schools graduate 50 percent more graduates than find jobs inengineering each year (see Figure 4); the one engineering area where there has been a shortage, petroleumengineering, is the exception that proves the rule (see discussion of petroleum engineers, below).6 P age
Figure 4: Occupational field of STEM college majors one year after graduation, 2009If we examine the entire workforce, of all incumbent workers currently employed, a recent study by theU.S. Census Bureau finds that of those who have a STEM degree, only 36% are employed in a STEMfield (U.S. Census Bureau, 2012). This is consistent withFigure 5: Highest Degree in S&E and Occupationthe National Science Foundation’s analyses of field ofdegree and occupation. Figure 5 shows the NSF analysisof degree holders and occupation, showing less than a thirdof science and engineering degree holders are in a scienceor engineering occupation. Although some portion of theSTEM degree holders who are not in a formal STEM jobare no doubt working in jobs utilizing their STEMeducation, the evidence suggests there is still a very largesupply of STEM educated workers available to STEMindustries if there were demand for them. The evidencedoes not reflect a deficit in the number of STEM graduatesin the workforce or in our current annual production ratesof STEM graduates.7 P age
Rather than “shortages,” the concern about the STEM workforce overall is about the worsening careerprospects and indications that supply far in excess of demand weakens the labor market in these fields,motivating students to pursue careers elsewhere. This was the finding in our analysis of changes in thecomposition of STEM graduates going into STEM jobs over the past three decades. We found thatalthough the overall supply remained strong, fewer of the highest performing students were going intoSTEM jobs (Lowell, et al., 2009). Other STEM workforce researchers find similar outcomes andevidence supporting similar conclusions. Even the lead author of a widely-cited study that asserted theneed for more STEM graduates, Tony Carnevale of Georgetown University’s Center on Education andthe Workforce, said, “If you’re a high performing math student in America, from a purely economic pointof view, it’s crazy to go into STEM” (Light and Silverman, 2011). And, in fact, many of the top studentsflock to Wall Street and corporate law firms and other non-STEM jobs.It is thus curious that claims about “STEM shortages” only assert a need to fill IT jobs for which,paradoxically, the vast majority are not filled by STEM graduates. Nor do most IT jobs require theeducation or training of a STEM degree (which, in any case, is the least demanding of all STEM fields interms of STEM credit hours.) Moreover, these shortage claims rest almost entirely on employer reportsabout the difficulties they face in hiring.Fieldwork research, including ours (Lynn and Salzman, 2010; Salzman, 2000) finds that reports of hiringdifficulties often reflect unrealistic expectations. Traditionally, during tight labor markets, such as beforethe dot.com crash, employers will hire good candidates who may not be “perfect,” but the firms willinvest in training them. However, recent studies of employer recruiting find a decrease in recruitmentintensity and little evidence of efforts to address unmet hiring needs. Peter Cappelli (2012) of theWharton School concludes that employers have become willing to wait, hoping for the perfect candidate,the “purple squirrel,” believing that unemployment is high and there must be someone who will notrequire training. Because it is a slow economy, there is less urgency to fill positions quickly and a longersearch time is possible.Do Markets Work? The case of Petroleum Engineering3Petroleum engineering offers an important case of observed labor market shortages and the marketresponse of firms and students. It is instructive to consider in light of current claims about market failurein the IT sector and industry’s assertion that they are unable to obtain the needed supply of graduates fromU.S. colleges and universities. This case is of further interest because, as noted above, engineering is themost demanding college major in terms of credit hours, technical content, and time to completion whereascomputer science and math degrees have the lowest course hour distribution of the STEM fields,suggesting increases in engineering supply should be more difficult to achieve than in other fields.In the 1970s, the building of the Trans-Alaskan Pipeline and increased oil exploration in other regions ledto rapidly increasing demand for petroleum engineers. By 2002, however, Occupational Outlook forecastan employment decline “because most of the petroleum-producing areas in the United States already havebeen explored” (BLS, 2004), and this continued to be the forecast through the 2008 edition ofOccupational Outlook. In the most recent edition, 2014-2015, however, the BLS forecast changed to a3This section is excerpted from Lynn, Salzman and Kuehn (2015) “Dynamics of Engineering Labor Markets:Petroleum Engineering and Responsive Supply” in Freeman, R. and H. Salzman (eds.) Engineering in a GlobalEconomy (forthcoming, 2015) NBER and University of Chicago Press.8 P age
projected employment increase of 26 percent over the coming decade because “petroleum engineersincreasingly will be needed to develop new resources, as well as new methods of extracting more fromexisting sources.” The shift to greater exploration followed the 2008 oil price spike, which also increasedthe returns to investments in types of oil extraction that were previously cost-prohibitive (e.g., tar sands),thus increasing the demand for petroleum engineers, especially those with new skill sets.The number of job openings began to exceed the number of graduates around 2002, even though therestill had been no overall workforce growth. This was because of retirements and little hiring since theearlier oil boom and hiring expansion of the 1970s and 1980s. In some interviews with managers in oilcompanies in the mid-2000s, we found high levels of concern because the large cohort of engineers hiredin the 1970s and 1980s was retiring just as the firms were launching large development and maintenanceprojects. This underlying demand was then exacerbated by the oil price spike, which intensifiedexploration efforts as higher oil prices made previously unprofitable exploration profitable.The response to this confluence of events – little hiring for many years, a current workforce that wasaging and retiring and sudden increase in oil exploration—led to a classic textbook example of marketdisequilibrium. The earlier shortage had already led to increases in starting salaries, but with the oil pricespike petroleum engineering starting salaries rose even further, becoming the highest of all fields ofengineering for new bachelor’s degree graduates (National Association of Colleges and Employers,2010). Starting salaries jumped from an already high 43,674 in 1997 to 50,400 in 1999. Startingsalaries rose further to 55,987 in 2003, 61,516 in 2005 (Bureau of Labor Statistics, 2004, 2006), and 86,220 in 2010 (National Association of Colleges and Employers, 2010).In all these years, petroleum engineering salaries were higher than other engineering salaries but, untilbefore the spike in demand, the petroleum engineering starting salary premium was relatively small. Forexample, the 1997 43,674 starting salary for petroleum engineers was only slightly greater than that forthe second highest paid engineering field, chemical engineers, who received an average starting salary of 42,817. In 2010, however, the starting salary of 86,220 for petroleum engineers was much higher thanthat of the second highest field, still chemical engineering, which was only 65,142 (National Associationof Colleges and Employers, 2010).In response to this and other market signals the number of new petroleum engineering degrees awardedby U.S. universities more than tripled (American Oil & Gas Reporter, 2010). In just the period from2007-2008 to 2010-2011, U.S. university petroleum engineering departments increased the number ofPh.D. graduates from 39 to 95. Texas A&M and Colorado School of Mines more than tripled their outputof new graduates from 42 to 128 and 32 to 100, respectively. Reports from some petroleum engineeringprograms indicate an even greater increase in demand in subsequent years (TTU, 2010). The dramaticincrease in petroleum engineering followed the steep rise in starting salaries, which in turn reflected anobservable increase in industry demand. This would seem to be a clear textbook case of efficient andresponsive market functioning. It seems to show that normal market mechanisms, namely wage increases,can dramatically and quickly increase supply.2.Guestworker Flows4H-1B nonimmigrant visa use is dominated by the IT sector. Under international trade law, the UnitedStates may not restrict the annual number of H-1B visas to fewer than 65,000 annually, but U.S. law hasbeen amended to provide an additional 20,000 visas for foreign STEM graduates of U.S. universities, andthere is no cap on the number of H-1Bs sponsored by nonprofit employers such as universities.4This section is excerpted from Salzman, et al., (2013).9 P age
The next largest visa used by STEM employers is the L-1 visa for intracompany transferees. The L-1 hastwo categories, the L-1A for executives and managers (it permits work for up to seven years) and the L1B for employees with “specialized knowledge” (it permits work for up to five years). Spouses andchildren of L-1 workers may be admitted with an L-2 visa, which grants the L-2 holder workauthorization for the same amount of time as the principal L-1 holder. There are no caps on the L visa,and its use has increased over time.An unknown but substantial proportion of foreign students on F-1 nonimmigrant student visas changestatus directly to the H-1B visa if sponsored by an employer, while many other foreign students first workafter graduation through the Optional Practical Training (OPT) program. The permitted stay to workunder the OPT was two years in the past, but it has been changed to 12 months. In 2008, however, theprogram was extended by 17 months for graduates in STEM fields, meaning that these graduates canwork on OPT status for a total of 29 months.5 Another temporary visa that often supplies workers for ITjobs is the O-1 visa for workers of extraordinary ability (10,590 total O-1 visas were issued in 2012).Figure 6 shows the annual number of visas issued to guestworkers in the relevant visa categories, i.e., theH-1B, the L, and foreign-student OPT workers (see Appendix A for method and calculations). Thenumber of workers hired in these visa categories has been growing over time. The H-1B trends reflect thebooming demand during the dot-com bubble years and a congressional cap that was raised to 195,000 (itdropped down to 65,000 in 2003). The H-1B numbers dropped sharply after 2001, only to rise again upuntil the recession of 2008. Use by employers of all of the guestworker visa programs declined followingthe crash of the economy in 2008, but it has been increasing since that time. In FY2011, theseguestworker visa programs totaled 372,000 workers.Figure 65The government’s rationale for the 17-month extension was to “reduce some of the hardship imposed by the H-1Bvisa cap.” At the time the extension was created, the H-1B cap for the fiscal year was reached quickly, and the OPTprogram was intended to allow employers to keep STEM graduates employed in the country while they waited foran H-1B visa to become available (Thibodeau 2008).10 P a g e
The predominant employers of guestworkers are either in the IT industry or in non-IT industries but withIT occupations to fill. For the H-1B workers, about 50 percent are approved for employment in formallydefined IT occupations.6 There are no official, detailed statistics on the occupational categories of L-1visa holders, but a 2006 study by the Department of Homeland Security (DHS) Office of the InspectorGeneral (OIG) concluded that the evidence suggested the L-1 visa was effectively “The Computer Visa.”The study noted that, although “the L-1 visa program is not specifically tailored for the computer orinformation technology (IT) industries, the positions L-1 applicants are filling are most often related tocomputers and IT.” In addition, “.nine of the ten firms that petitioned for the most L-1 workers werecomputer and IT related outsourcing firms that specialize in labor from India.[and] almost 50 percent ofthe L-1B (specialized knowledge) petitions.named beneficiaries born in India.” (DHS 2006, 4) Otheranalysts have also concluded that the L-1 visa is primarily used for the IT industry and IT occupations,and that the number of all L visas has been steeply increasing since the Inspector General’s report in2006. There are no publicly available data on the number of L-2 visa holders (for spouses of L-1 visaholders) who have been granted employment authorization by DHS or where they are employed. Thereare also no publicly available occupational or employer data on initial OPT visas (the maximum 12month work permit provided to all college graduates on an F-1 visa), but we obtained data on the 17month OPT-STEM extension applicants for 2008 through early 2013. Our analysis found the vastmajority (77 percent) were for IT occupations and/or IT firms (the other major group is biomedical andpharmaceutical industries). Because these guestworker programs are clearly used most intensively by theIT industry and for IT occupations, we focus our analysis on the IT workforce to identify the role ofguestworkers and potential workforce impacts.The H-1B and F-1/OPT guestworker visa categories are primarily for workers with at least a bachelor’sdegree, though the H-1B category does permit use of experience as a degree equivalent.7 Ex
Foundation, (Human and Social Dynamics Program, #SES-0527584; Social Dimensions of Engineering, Science and Technology #0431755). Expert research assistance and analysis was provided by David Hersh, and Susan Ferrara. The views expressed are those of the author and should not be attributed to Rutgers University, the J.J.