Transcription
UNITED STATES CONSUMER LAWATTORNEY FEE SURVEY REPORT2010-2011Ronald L. Burdge
United States Consumer LawAttorney Fee Survey Report 2010-2011Conducted ByRonald L. BurdgeBurdge Law Office Co. LPA2299 Miamisburg Centerville RoadDayton, OH 45459-3817Voice: 937.432.9500Fax: 937.432.9503Email: Ron@TheLawCoach.comCopyright 2011 by R.L.Burdge but licensed as follows:United States Consumer Law Attorney Fee Survey Report 2010-2011 byRonald L. Burdge is licensed under a Creative CommonsAttribution-NonCommercial-NoDerivs 3.0 Unported License.Use of this work to aid in the determination of a reasonable attorney fee isnot considered a commercial use by the author and specific consent to usethis work in that manner is waived by the copyright holder.Permissions beyond the scope of this license may be available atwww.TheLawCoach.com .Creative Commons Licensing is explained /
This work is dedicated to the private and public practice members of theConsumer Law bar across the United States and its territories whotirelessly dedicate their careers to helping consumers and businesses findjustice every day in our legal system. Without their participation thispublication would not have been possible.And a special thanks is extended to Ira Rheingold, Executive Director of theNational Association of Consumer Advocates, and Jon Sheldon, with theNational Consumer Law Center, for their leadership, friendship, advice andtireless support of this project over the years.Ronald L. Burdge
Table of Contents1. Introduction. . . . . . . . . . . . . . . . . . . . . . . . . . . . . . . . . . . . . . . . . . . . . . . . . . . 1Error Rate. . . . . . . . . . . . . . . . . . . . . . . . . . . . . . . . . . . . . . . . . . . . . . . . . 3Methodology. . . . . . . . . . . . . . . . . . . . . . . . . . . . . . . . . . . . . . . . . . . . . . 3Section 508 Compliance. . . . . . . . . . . . . . . . . . . . . . . . . . . . . . . . . . . . . 4The Average and the Median: What it Means to You. . . . . . . . . . . . . 5Geographic Areas Defined. . . . . . . . . . . . . . . . . . . . . . . . . . . . . . . . . . . 6Interpreting the Findings. . . . . . . . . . . . . . . . . . . . . . . . . . . . . . . . . . . . . 72. Summary Profile of the Typical US Consumer Law Attorney. . . . . . . . . 103. National Average Table for All Firms by Region. . . . . . . . . . . . . . . . . . . . 124. State Percentage Change Table, 2000 thru 2011. . . . . . . . . . . . . . . . . . . . 145. Average Hourly Rates by Years in Practice Tables by Region. . . . . . . . . 17Atlantic Region Firms. . . . . . . . . . . . . . . . . . . . . . . . . . . . . . . . . . . . . . . 18California Region Firms. . . . . . . . . . . . . . . . . . . . . . . . . . . . . . . . . . . . . 19Florida Region Firms. . . . . . . . . . . . . . . . . . . . . . . . . . . . . . . . . . . . . . 20Mid West Region Firms. . . . . . . . . . . . . . . . . . . . . . . . . . . . . . . . . . . . . 21New York Region Firms. . . . . . . . . . . . . . . . . . . . . . . . . . . . . . . . . . . . 22North East Region Firms. . . . . . . . . . . . . . . . . . . . . . . . . . . . . . . . . . . 23Ohio Region Firms. . . . . . . . . . . . . . . . . . . . . . . . . . . . . . . . . . . . . . . . 24Pacific Region Firms. . . . . . . . . . . . . . . . . . . . . . . . . . . . . . . . . . . . . . . 25South Region Firms. . . . . . . . . . . . . . . . . . . . . . . . . . . . . . . . . . . . . . . . 26Texas Region Firms. . . . . . . . . . . . . . . . . . . . . . . . . . . . . . . . . . . . . . . . 27US Territories Region Firms. . . . . . . . . . . . . . . . . . . . . . . . . . . . . . . . 28West Region Firms. . . . . . . . . . . . . . . . . . . . . . . . . . . . . . . . . . . . . . . . 296. Median & Average Summary Tables by Region. . . . . . . . . . . . . . . . . . . . 30Explanation of Tables. . . . . . . . . . . . . . . . . . . . . . . . . . . . . . . . . . . . . . 30Atlantic Region. . . . . . . . . . . . . . . . . . . . . . . . . . . . . . . . . . . . . . . . . . . . 31California Region. . . . . . . . . . . . . . . . . . . . . . . . . . . . . . . . . . . . . . . . . . 32Florida Region. . . . . . . . . . . . . . . . . . . . . . . . . . . . . . . . . . . . . . . . . . . . 33Mid West Region. . . . . . . . . . . . . . . . . . . . . . . . . . . . . . . . . . . . . . . . . . 34New York Region. . . . . . . . . . . . . . . . . . . . . . . . . . . . . . . . . . . . . . . . . . 35North East Region . . . . . . . . . . . . . . . . . . . . . . . . . . . . . . . . . . . . . . . . 36i
Ohio Region. . . . . . . . . . . . . . . . . . . . . . . . . . . . . . . . . . . . . . . . . . . . . . 37Pacific Region. . . . . . . . . . . . . . . . . . . . . . . . . . . . . . . . . . . . . . . . . . . . . 38South Region. . . . . . . . . . . . . . . . . . . . . . . . . . . . . . . . . . . . . . . . . . . . . 39Texas Region . . . . . . . . . . . . . . . . . . . . . . . . . . . . . . . . . . . . . . . . . . . . . 40US Territories Region. . . . . . . . . . . . . . . . . . . . . . . . . . . . . . . . . . . . . . . 41West Region. . . . . . . . . . . . . . . . . . . . . . . . . . . . . . . . . . . . . . . . . . . . . . 427. Regional Summary Profiles. . . . . . . . . . . . . . . . . . . . . . . . . . . . . . . . . . . . 43Summary Profile of the Atlantic Region. . . . . . . . . . . . . . . . . . . . . . . 44Summary Profile of the California Region. . . . . . . . . . . . . . . . . . . . . 46Summary Profile of the Florida Region. . . . . . . . . . . . . . . . . . . . . . . . 47Summary Profile of the Mid West Region. . . . . . . . . . . . . . . . . . . . . 48Summary Profile of the New York Region. . . . . . . . . . . . . . . . . . . . . 49Summary Profile of the North East Region. . . . . . . . . . . . . . . . . . . . 50Summary Profile of the Ohio Region. . . . . . . . . . . . . . . . . . . . . . . . . . . 51Summary Profile of the Pacific Region. . . . . . . . . . . . . . . . . . . . . . . . 52Summary Profile of the South Region. . . . . . . . . . . . . . . . . . . . . . . . . 53Summary Profile of the Texas Region. . . . . . . . . . . . . . . . . . . . . . . . . 54Summary Profile of the US Territories Region. . . . . . . . . . . . . . . . . . 56Summary Profile of the West Region. . . . . . . . . . . . . . . . . . . . . . . . . 578. Survey Techniques. . . . . . . . . . . . . . . . . . . . . . . . . . . . . . . . . . . . . . . . . . . 589. Cases Employing Use of Survey Data. . . . . . . . . . . . . . . . . . . . . . . . . . . . 5910. Additional Cases on Use of Survey Data. . . . . . . . . . . . . . . . . . . . . . . . . 6011. Recommendations for Future Survey Data. . . . . . . . . . . . . . . . . . . . . . . 62About the Editor. . . . . . . . . . . . . . . . . . . . . . . . . . . . . . . . . . . . . . . . . . . . . . . 62ii
1. IntroductionThis report publishes the results of the United States Consumer LawAttorney Fee Survey for 2010-2011. Attorneys in every state and the USTerritories took part in the national survey and the results are the mostcomprehensive since our research work began on the subject in 1999.Consumer Law is recognized as a specialty area of law1 dealing withissues arising from transactions involving one or more persons acting asindividuals or as a family. It typically includes the legal fields ofbankruptcy, credit discrimination, consumer banking, warranty law, unfairand deceptive acts and practices, and more narrow topics of consumer lawsuch as consumer protection rights enabled by specific statutes such as theFair Credit Reporting Act, the Uniform Consumer Sales Practices Act, stateand federal lemon laws, and many others.Section 2 of this Survey Report is the Summary Profile of the TypicalUS Consumer Law Attorney, a collective approach to the entire surveyresults which yields a detailed picture of key aspects of the typical USConsumer Law practitioner in the United States and its territories. It isbased on the survey results as a whole.Section 3 contains the National Average Table for All Firms andreports the regional average hourly rates according to small and large firmclassification and including both attorney rates and paralegal rates. Thistable gives a broad overview at a glance with easy side by side comparisonsof key data. It also allows the reader to see the relative survey participationfrom each of the 12 surveyed regions.Section 4, the State Percentage Change Table, 2000 thru 2011,reflects the state by state changes in hourly rate averages based on statedata. This section contrasts year 2000 rates, the first year of the surveyreports that were based on data compilation that began in 1999, with thehourly rate averages in this year’s Survey Report. This table shows the1As said by the Ohio 9th District Court of Appeals, “[c]onsumer law is a specialtyarea that is not common among many legal practitioners.” Crow v. Fred Martin MotorCo., 2003-Ohio-1293 (Summit App. No. 21128).1
actual increases and decreases in hourly rates as well as the percentage ofchange from oldest data to current data.Section 5 includes the Average Hourly Rates by Years in PracticeTables by Region because years in practice is a primary factor in thedetermination of a reasonable hourly rate. These tables report, on aregional basis, the average hourly rates according to only the number ofyears an attorney has been practicing law.Section 6, the Regional Median & Average Summaries Tables, reportsmedian and average analyses and the results of key survey questions on aregional approach. Added scaling in these tables gives greater analysisopportunities for the reader’s consideration. An explanation of terms in thetable precedes the actual Regional Median & Average Summaries Tables.Section 7 contains the Regional Summary Profiles analyses whichreports a summary profile of the typical Consumer Law attorney in each ofthe 12 regions in the survey. It provides a collective approach to eachregion’s survey results, which yields a more detailed summary picture ofkey aspects of the typical US Consumer Law practitioner in each surveyRegion.Prior studies have shown that the factors most influencing an hourlyrate are an attorney’s years in practice, location of practice, and size of firm.These factors are variously surveyed and reported in this publication. Moredetailed location of practice data, and related customized data in relation tolocale, is published in the separately available Regional Reports and isavailable upon request.In compiling this report, an invaluable contribution was made bymembers of the National Association of Consumer Advocates andConsumer Law attorneys across the United States and its territories whowere invited to participate during 2010.Information was collected for individual data as of end of year 2010.As previously, an on-line survey service was utilized to gather and tabulatethe results with safeguards in place to limit data input per surveyparticipant to one region.2
Similar studies were undertaken annually since 1999. The objective ofthese studies was to determine the demographics of Consumer Lawpractitioners, including attorney hourly billing rate, firm size, years inpractice, concentration of practice, primary and secondary practice areaprevalence, paralegal billing rates and other data.The collected information has been condensed into this nationalreference to provide benchmarks to assist Consumer Law attorneys as theymanage their practice.Because of the still-increasing involvement of paralegals and lawclerks in non-administrative day to day aspects of legal practice, data is alsocompiled on regional paralegal hourly rates.The data is reported in several tables below, allowing the reader toconsider the data from several viewpoints of selected factors or criteria. Inaddition, more detailed regional data with explanatory charts is available inthe twelve separately published Regional Survey Reports, available onrequest.Error RateA hand review conducted of all data received during this survey wascompared with the data reported in the previous survey. The resultsindicated an error rate of less than one percent, a number substantiallylower than the error rate of most surveys.MethodologySurvey results are based on the results of an on-line survey fieldedduring 2010 and consisting of 9 key data questions. The survey wasadministered via email, ordinary mail, facsimile and telephonic invitationsto a confidential, web-based questionnaire.The entire active membership of the National Association of3
Consumer Advocates (except for persons employed in public employmentor education) along with other known Consumer Law practitioners fromaround the United States and its territories was surveyed.Invitations to participate were also randomly sent to attorneysdisclosed through internet search engine results conducted on a nationallevel as well as randomly selected physical telephone book specialty listingswhere available. Invitations to participate were also randomly sent toattorneys identified through court filings in various jurisdictions and barassociation directories where available.To help practitioners understand and interpret the data below, a briefexplanation of the data may help.Section 508 ComplianceThe United States Consumer Law Attorney Fee Survey is the onlyonline survey program that is Section 508 Certified. This means that thesurvey program on which this survey runs meets all current US FederalSection 508 certification guidelines.Section 508 is a Federal law that outlines the requirements to makeonline information and services accessible to users with disabilities. Thegovernment web site that outlines the requirements and helpful linksregarding section 508 is located on the internet at this page:http://www.section508.gov/. All Federal agencies are required to use 508certified software and technologies when available.The Voluntary Product Accessibility Template, or VPAT?s purpose, isto assist Federal contracting officials and other buyers in makingpreliminary assessments regarding the availability of commercial"Electronic and Information Technology" products and services withfeatures that support accessibility. The VPAT was developed by theInformation Technology Industry Council (ITI) in partnership with the U.S.General Services Administration (GSA).Use of the VPAT means that this survey is built on programming that4
includes a text element for every non-text element of the survey web page,web pages are designed so that all information displayed with color is alsoavailable without color, all parts of the survey are readable without havingto open another window, and other techniques to enable disabled personsto fully participate in every aspect of the Fee Survey.It is important for the Fee Survey to be able to reach the broadestrange of potential respondents possible to provide the reader with the mostaccurate results. By including survey feedback from the disableddemographic, the Fee Survey ensures a more representative population isable to participate so their economic demographics may be included in theFee Survey results.The Average and the Median: What it Means to YouTo help practitioners understand and interpret the data in this report,a brief explanation of common data terminology in this report is necessary.The tables below use some terms whose meaning may not be clear tomany Consumer Law practitioners.The average (sometimes called the arithmetic average) is calculatedby adding the values of all responses, then dividing by the number ofresponses.Example: Five responses are reported, 3, 4, 6, 8 and 12. The averageis calculated by adding their values (3 4 6 8 12 33), then dividingby the number of responses (5). Thus, the average is 33 / 5 6.6.The median has a different meaning. It is the middle value of a seriesof values, which is initially rank-ordered from low to high. By definition,half the numbers are greater and half are less than the median. Both meanand median values are used in this survey report as a pointer for the centralarea of survey results without regard to the average.Statisticians variously agree that using the median as a statisticreduces the effect of extreme outer numbers (extremely high or low values,5
such as 12 in the above example). Using an average takes all numbers intoaccounting.Example: Five responses are reported, 3, 4, 6, 8 and 12. The medianis the middle number of the order of distribution, 6. Note, however, thatthe average of this same distribution of numbers is 6.6.The median literally is the value in the middle. It represents the midway point in a sequence of numbers. It is determined by lining up thevalues in the set of data (in this fee survey that would be all of theindividual fee rate responses logged in the survey) from the smallest on upto the largest. The one in the dead-center is the median number.The median is not the average of the numbers (you don’t addanything) in the list, but merely the center of the list. Some statisticians saythat using the mean (instead of the average) gives less weight to theindividual fee rates that are on the outer limits of the survey responses andis more likely to direct the survey to the real center of the responses.Because the median number is commonly not the same as theaverage number, being either slightly above or below it, we are includingboth results in this year’s survey results.Geographic Areas DefinedThe data has been compiled in twelve geographic regions, includingseveral states identified as their own region. This is loosely based on acombination of three factors: the long-established Altman-Weil2 regionaltables, the quantity of Consumer Law attorneys that were readily identifiedas practicing in each state, and the geographic proximity of any one state toa nearby overall region.2Altman Weil, Inc. provides management consulting services exclusively to legalorganizations. Its clients include law firms, law departments, governmental legal officesand legal vendors of all sizes and types throughout North America, the U.K. and abroad.The Altman Weil website address is http://www.altmanweil.com/ .6
Atlantic:CaliforniaFloridaMid West:New YorkNorth East:OhioPacific:South:TexasUS Territories:West:DC, DE, NC, NJ, PA, VA, WVIA, IL, IN, KS, MI, MN, MO, ND, NE, SD, WICT, MA, MD, ME, NH, RI, VTAK, HI, OR, WAAL, AR, GA, KY, LA, MS, OK, SC, TNPuerto Rico, Guam, American Samoa, US Virgin IslandsAZ, CO, ID, MT, NM, NV, UT, WYSince this survey work first began in 1999, the states of California,Florida, New York, and Ohio have consistently had a larger overall quantityof Consumer Law practitioners than other states. For that reason, thesefour states are treated in the national survey report as being their ownregion.The national survey report takes a national view of the survey data. Aseparately published report is available on request for each of the 12regions in the survey, providing more detailed, specific and slightlydifferent survey data with explanatory charts for the reader’s review andfurther analysis.In response to requests for even more detailed data, this year’s surveyadded a new question which obtains from each survey participant thespecific area of the region where each participant maintains their firmoffice. The responsive data enabled an even more localized set of data to begenerated for geographic areas within each of the 12 regions.Interpreting the FindingsAn hourly rate is commonly impacted by several factors, includingyears of practice, firm size, practice location, degree of practiceconcentration, reputation, advertising, personal client relationships, andother factors. As a result, the information presented here is for7
informational purposes only and may or may not be indicative of aparticular attorney’s reasonable hourly rate without further, more detailedanalysis of the available and other data.A Summary Profile of the Typical US Consumer Law Attorney ispresented at the outset of this survey report in order to provide a summaryprofile of the average US Consumer Law attorney and their practice. It maybe viewed as the average of all survey responses nationwide.The National Average Table for All Firms by Region provides an at aglance view of the averages for respondents by the 12 survey regions.Presented in table format, it allows for quick and easy comparison of keydata across several regions but is intended to only provide a summarystatement of the key data and should be considered in tandem with theother data reported herein.The Average Hourly Rates by Years in Practice Tables by Regionpresents an analysis of the impact that years in practice in Consumer Lawhas on the average attorney hourly rate. Each region has its own table ofsurvey results with years in practice being divided in 9 time frames withless than one year and more than 31 years bracketing the outer limits ateach end. One might think that longevity of practice would dictate anincreasingly higher hourly rate and these tables report survey results thattests that assumption and, in some cases, variations are observed. Currenteconomic trends outside of this survey test that assumption even furtherbut are not considered in this survey.The Median and Average Summaries Tables by Region are presentedto give an overview of the practice of Consumer Law lawyers in each region.Note the use of both average and median results in this section, with themedian used to reduce the effect of extremely high or low values in somedata. These tables also show the difference in survey results whencomparing the average hourly rates and the median hourly rates, a factorconsidered by some statisticians to arrive at what they consider to be moreneutral or accurate survey results.Where necessary, insufficient data is represented by a dash markinstead of a numerical entry in the column.8
9
2. Summary Profile of the Typical US Consumer LawAttorneyThis section summarizes key statistics derived from the survey whenviewed from a national approach. Emphasis here is on the averageConsumer Law attorney in the United States without regard for any specificsurvey factor.The typical Consumer Law attorney is in a small office of 4 or fewerpractitioners. Not a single region was dominated by larger firms. The USTerritories region was the only region that reported 100% employed 4 orfewer attorneys. At the other end of the spectrum is New York whichreported that 59.4% were firms employing 4 or fewer attorneys.The typical Consumer Law attorney has been practicing law for 17.3years. All regions reported in the range from 14 years to 20.9 years inpractice.15.4% of all Consumer Law attorneys have been in practice less than 5years, a decrease from the last survey report’s 19% but still slightly belowthe previous survey report’s 16%.The average percentage of more-experienced attorneys (those with 31or more years of practice) is 17.25%. However, the region with the largestpercentage of more-experienced attorneys is the Pacific with 39.5%.The average of less-experienced attorneys (those with less than 5years of practice) is 15.4%. However, the region with the largest percentageof less experienced attorneys is also the Pacific with 5.2%.49.2% of all firms reported that their practice consists of 90-100%Consumer Law issues. This figure is a dramatic drop from the last surveywhen 82.7% was the level reporting their practice to fall in the 90-100%range of Consumer Law.The average Consumer Law practice is still supplemented in largestpart by Bankruptcy work (10 of the 12 regions in the survey), as it has beenfor several years. In the US Territories Region, however, Bankruptcy work10
is reported as the largest area of the practice with other general ConsumerLaw work ranking in second place.The typical Consumer Law firm employs 1 paralegal (1.7 to be precise)whose hourly billable rate averages 95.8. In the last survey report, thetypical Consumer Law firm employed 1 paralegal but the hourly billablerate was 96, which was itself a slight increase from the previous survey’s 93.25.The average hourly rate for the typical Consumer Law attorney(regardless of all other factors) is 304, down very slightly from the lastsurvey report’s of 305, which was itself a drop of the prior report of 307.The median Attorney hourly rate is 300, up from last year’s 293and still below the preceding survey’s report of 308.The median 25% Attorney hourly rate (the point at which 25% of allsurvey participants reported an hourly rate lower than this number) is 241, compared to 240 in the last survey. The median 75% Attorneyhourly rate is 355, compared to 365 in the last survey.The median 95% Attorney hourly rate is 480, compared to 443 inthe last survey.The typical Consumer Law firm lawyer has not changed their hourlyrate in the last 15.6 months. In the last survey it was an average of 17months since the hourly rate had been changed in the average firm.11
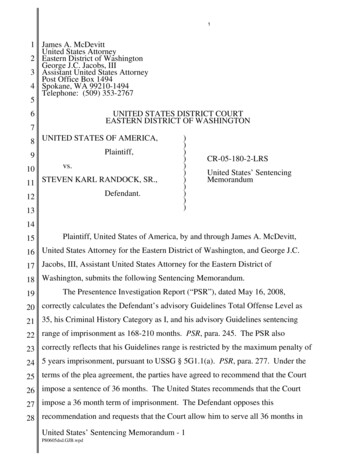
3. National Average Table for All Firms by RegionThis Table does not take into consideration the factors of the degree of concentration or years ofpractice, among other things, all of which will have a large impact on any particular person’s hourly rate.Region:% of TotalSurveyResponsesFrom ThisRegion:SmallFirm % ofRegion( 5)LargeFirm % ofRegion( 5)Small FirmAverageAttorneyRate In thisRegionLarge FirmAverageAttorneyRate In thisRegionSmall FirmAverageParalegalRate In thisRegionLarge FirmAverageParalegalRate In thisRegionAtlantic(DC DE NCNJ PA 3350453121153Florida6.780.919.131234010296Mid West(IA IL INKS MI MNMO ND NESD WI)20.175.224.828438181125New York4.659.440.63233099611012
Region:% of TotalSurveyResponsesFrom ThisRegion:SmallFirm % ofRegion( 5)LargeFirm % ofRegion( 5)Small FirmAverageAttorneyRate In thisRegionLarge FirmAverageAttorneyRate In thisRegionSmall FirmAverageParalegalRate In thisRegionLarge FirmAverageParalegalRate In thisRegionNorth East(CT MAMD ME NHRI 2Pacific(AK HI ORWA)5.471.128.9281356105107South(AL AR GAKY LA MSOK SC 87USTerritories3.31000175-53-West(AZ CO IDMT NM NVUT WY)5.180.619.4300230947513
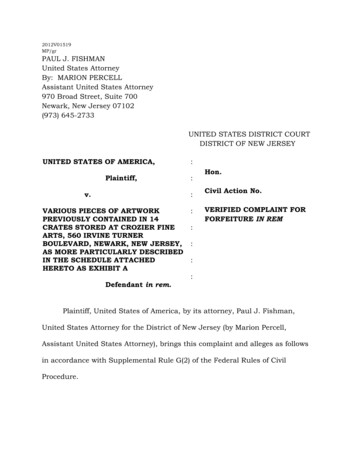
4. State Percentage Change Table, 2000 thru 2011The purpose of this table is to provide a historical perspective on theaverage hourly rates reported by small and large firms in the United Statesand its Territories since these Survey Reports began with the first reportpublished in year 2000. This table also provides the only state-specific datafor every state in the survey.This table reflects the state by state changes in hourly rate feeaverages spanning back to year 2000, the first year of this Survey Reportwhich was based on data compilation that began in 1999. This table showsthe increases and decreases in hourly rates as a percentage of change fromcurrent to oldest data. For instance, if the average hourly rate for a smallfirm in a given state was 200 in year 2000 and current data showed it tobe 300, then the percentage column would indicate a change of 150%.In all cases the data goes back as far as possible to establish a baselineto draw comparisons for the percentage of change calculations made belowbut in a few cases the data may not go back to the report issued in year2000 because of lack of data; in that event the percentage change is acontrast of the oldest data available with year 2009 data.For the Baseline columns in this chart, the regional data is usedwhere a state is a part of a region since state specific data only becameavailable in 2010.For the 2011 Data columns in this chart, the data is the average of alldata obtained for each particular state. Where state data only existed foreither a small firm or a large firm, but not both, the data appears in thistable for both.The percentage of 2000 Data column represents the change that hasoccurred for that state since the oldest data available (i.e., for Alabama, theSmall Firm rate has increased 167.6% since 2000, from 170 to 285).The Small Firm and Large Firm definitions in this table are the sameas those used throughout this Survey Report, i.e., a “small firm” has 4 orfewer attorneys and a “large firm” has five or more attorneys.14
U.S. StateBaseline 2011 Baseline 2011 % of 2000 % of 2000Sm Firm Data Lg Firm DataDataData(2000) Sm Firm (2000) Lg Firm Sm Firm Lg 92362175362189207New192387238387202163HampshireNew Jersey137365238365266153New Mexico192368175368192210New York170323238309190130No. Carolina150266225275177122No. ma13724023824017510115
OregonPennsylvaniaRhode IslandSo CarolinaSo ashington DCWest VirginiaWisconsinWyomingUS 95204145110116871161371788210016420112314610788
5. Average Hourly Rates by Years in Practice Tables byRegionThese regional tables are intended to provide the reader with a quickand easy way of determining the average
and federal lemon laws, and many others. Section 2 of this Survey Report is the Summary Profile of the Typical US Consumer Law Attorney, a collective approach to the entire survey results which yields a detailed picture of key aspects of the typical US Consumer Law practitioner in the United States and its territories. It is