Transcription
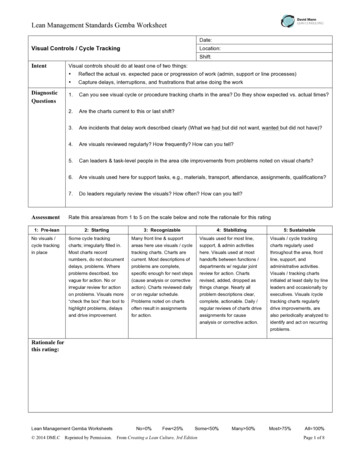
Lean Management Standards Gemba WorksheetDate:Visual Controls / Cycle sessment1: Pre-leanVisual controls should do at least one of two things: Reflect the actual vs. expected pace or progression of work (admin, support or line processes) Capture delays, interruptions, and frustrations that arise doing the work1.Can you see visual cycle or procedure tracking charts in the area? Do they show expected vs. actual times?2.Are the charts current to this or last shift?3.Are incidents that delay work described clearly (What we had but did not want, wanted but did not have)?4.Are visuals reviewed regularly? How frequently? How can you tell?5.Can leaders & task-level people in the area cite improvements from problems noted on visual charts?6.Are visuals used here for support tasks, e.g., materials, transport, attendance, assignments, qualifications?7.Do leaders regularly review the visuals? How often? How can you tell?Rate this area/areas from 1 to 5 on the scale below and note the rationale for this rating2: Starting3: Recognizable4: Stabilizing5: SustainableNo visuals /Some cycle trackingMany front line & supportVisuals used for most line,Visuals / cycle trackingcycle trackingcharts; irregularly filled in.areas here use visuals / cyclesupport, & admin activitiescharts regularly usedin placeMost charts recordtracking charts. Charts arehere. Visuals used at mostthroughout the area, frontnumbers, do not documentcurrent. Most descriptions ofhandoffs between functions /line, support, anddelays, problems. Whereproblems are complete,departments w/ regular jointadministrative activities.problems described, toospecific enough for next stepsreview for action. ChartsVisuals / tracking chartsvague for action. No or(cause analysis or correctiverevised, added, dropped asinitialed at least daily by lineirregular review for actionaction). Charts reviewed dailythings change. Nearly allleaders and occasionally byon problems. Visuals moreor on regular schedule.problem descriptions clear,executives. Visuals /cycle“check the box” than tool toProblems noted on chartscomplete, actionable. Daily /tracking charts regularlyhighlight problems, delaysoften result in assignmentsregular reviews of charts drivedrive improvements, areand drive improvement.for action.assignments for causealso periodically analyzed toanalysis or corrective action.identify and act on recurringproblems.Rationale forthis rating:Lean Management Gemba Worksheets 2014 DMLCReprinted by Permission.No 0%Few 25%Some 50%From Creating a Lean Culture, 3rd EditionMany 50%Most 75%All 100%Page 1 of 8
Lean Management Standards Gemba WorksheetDate:Standard Accountability ProcessesLocation:Shift:IntentStandard accountability processes: Accountability processes should convert problems/opportunities noted on visuals, the floor, or fromsuggestions to task assignments – for cause analysis and/or corrective action in a daily Post-It (or equivalent) process for briefer tasks, a weekly A3 process for longer ones.DiagnosticQuestionsAssessment1: Pre-lean1.How are improvement assignments and projects managed here: visually, by spreadsheet or list, or notat all?2.Are regular (daily or weekly) meetings held here to make new task assignments to address problems andfollow up on overdue assignments?3.Do the regular meetings here have clear purpose and agenda – other than today’s anticipated work?What is it?4.Do visual controls/cycle tracking charts result in task assignments to address interruptions, delays,capacity losses?5.How many area leaders are familiar with and able to apply basic project management approaches – likework breakdown structures and dependencies – in thinking though and defining task assignments?6.How well integrated are support, customer or supplier groups in this area’s improvement activities?Rate this area/areas from 1 to 5 on the scale below and note the rationale for this rating2: Starting3: Recognizable4: Stabilizing5: SustainableNo regularlyDaily or weekly start up /Team or area (line & supportAccountability meetings crisp,Using the accountabilityoccurringteam meetings heldgroup) meetings regularlyagenda followed, attendanceprocesses is routine in thevisual processregularly for improvement(daily/weekly) held to make,faithful. Small assignments toarea. All leaders regularlyto make ortask assignments; manyfollow up on improvementvisual accountability board;use basic projectfollow up onare completed on time.task assignments. Taskslarger ones to A3 projects.management tools totaskSome assignments are toposted visible to all.Green/red coding is routine.determine taskassignmentssupport or admin groupsAttendance is consistent;Tasks from many sources, notassignments, dependencies,forvs. line area, or are mademost tasks are completed,just visuals but also employeedurations. Support andimprovementin response to majormost on time, most leaderssuggestions, gemba walks,admin representativesbased onproblems. Some usinguse green/red coding for onsupport areas. Many in arearoutinely participate in lineidentifiedgreen / red coding for ontime or late task completion.use project management skillsaccountability process andproblems ortime completion or pastTasks respond to both major,on project work. Customerhave their own. Customer’sdelays.due tasks.minor incidents. Muchperspective is a given.perspective informs mostreference to customer/ user/assignments, admin,patient perspective.support, frontline.Rationale forthis rating:Lean Management Gemba Worksheets 2014 DMLCReprinted by Permission.No 0%Few 25%Some 50%From Creating a Lean Culture, 3rd EditionMany 50%Most 75%All 100%Page 2 of 8
Lean Management Standards Gemba WorksheetDate:Leader Standard Work sment1: Pre-leanLeader standard work should reflect process focus: The closer to the task execution level, the more frequent the focus (admin., support processes,production/pt. care). Should reflect “go to the place, talk with the people, look at the process” for all levels of leadership. Review of visuals (current? Quality of entries? Regular in-shift review?), accountability (assignments linkedto problems from visuals), follow up on improvement in leaders’ standard work (faithful execution ofredefined processes.1.Do leaders in this area have standard work? Do they follow it? Do they routinely have it with them? Canleaders describe how standard work has helped them be more effective (if they see it that way)?2.Are task level people in this area aware of the content of their leaders’ standard work?3.Are leader standard work documents used as working “diaries” to record notes and observations? Dosuperiors meet with subordinate leaders to review these documents periodically? Ever? How often?4.How often do this area’s superiors review subordinate leaders’ standard work for updating based on newissues and changes, e.g. resulting from accountability board tasks?5.Is there a defined place where completed standard work documents are stored for a few months? Is itused?6.Has leader standard work been used in this area to facilitate transitions between leaders?7.Is leader standard work focused on compliance or improvement or balanced?Rate this area/areas from 1 to 5 on the scale below and note the rationale for this rating2: Starting3: Recognizable4: Stabilizing5: SustainableNo leaderLeader standard workStandard work exists for allAll leaders in the area carry,All transitions between leadersstandard workexists for a few positions.line leaders in area: team,follow, and use their standardinclude review (possible(LSW) inIt’s rarely carried, issupervisor, manager. Mostwork as a daily working record.revision), and walk through ofplace.followed sporadically. Thehave their standard workAll superiors regularly reviewLSW. All new leaders followoriginal content has notwith them, follow it, use itsubordinate leaders’ LSWLSW from day one on job.been revised, refined. Mostas working record of thedocuments with them weekly.Weekly LSW document reviewleaders view it as a checkday. Most leaders can giveAll leaders can talk about howwith superior used asthe box activity to driveexamples illustrating howLSW benefits them and themonitoring, communication,compliance with definedleader standard work hasprocess. LSW is revised toand improvement method.processes with little or nohelped them and sustainedreflect and sustain processDefined process for turn-in,emphasis on improvement.improvements.changes.storage LSW documents.Rationale forthis rating:Lean Management Gemba Worksheets 2014 DMLCReprinted by Permission.No 0%Few 25%Some 50%From Creating a Lean Culture, 3rd EditionMany 50%Most 75%All 100%Page 3 of 8
Lean Management Standards Gemba WorksheetDate:Value Stream essment1: Pre-leanValue Stream Maps (VSMs) should do two things: Show the step-by-step movement of information, patients, and/or material through an area (or an entirevalue stream) that produces value for a customer, user, or patient – internal or external. Communicate process performance measures (safety, quality, time, cost), process problems, andimprovement plans.1.Are value stream maps visible here? If so, do they show current and planned future states and measures?2.Are improvements planned for the area (or complete value streams) visibly posted? Can people explainthem?3.Are VSMs used to identify, communicate, track, and measure process improvements in the area?4.Do VSMs show planned kaizens, completion status of kaizens, and improvement targets in current vs.future state performance measures? Can people explain the maps, kaizens, and measures?5.Who prepares value stream maps here? How many of this area’s leaders are proficient value streammappers?Rate this area/areas from 1 to 5 on the scale below and note the rationale for this rating2: Starting3: Recognizable4: Stabilizing5: SustainableNo mapsSome techThe area has visible plans forCurrent state and 90-dayVSMs regularly used in thevisible. Mapsspecialists in areaimprovement; many of whichfuture state maps showingarea’s communications. Frontnot used asknow how to map:shown on current and futureimprovement goals (measures)line leaders teach value streampart of area’smost leaders do not.state VSMs as planned or activeand activities (kaizens) aremapping. All area leaders areimprovementMaps, when present,kaizens. Some VSMs showvisible in the area. Most peopleproficient mappers. Area usesplanning. Few,show current statecurrent vs. future measures withcan explain them. All leadersposted VSMs to show itsif any, in areaonly. Maps may betargets for improvements (suchcan map, use VSMs toimprovement plans. The area’sknow how toposted but are out ofas in turnaround and throughputsystematically identifyperformance (down to the team)map.date.times, % value add time, patientimprovements large and small.is reflected in the current statesafety incidents, productivity,Completion status of kaizens ismeasures summary on its VSMuptime, yield, etc). Many peopleshown on the VSMs, linked to(e.g. turnaround and throughputcan explain the maps andproject plans, and showntimes, % value add time, safetymeasures. Many leaders arevisually as status of progressand incidents, patient andproficient mappers and drawagainst 90-day goals.customer satisfaction,productivity, uptime, yield).their own VSMs.Rationale forthis rating:Lean Management Gemba Worksheets 2014 DMLCReprinted by Permission.No 0%Few 25%Some 50%From Creating a Lean Culture, 3rd EditionMany 50%Most 75%All 100%Page 4 of 8
Lean Management Standards Gemba WorksheetDate:Process Assessment1: Pre-leanProcess Definition should reflect two things: Line and support tasks should be documented and the documentation should be readily accessible Documentation matches current practice; execution is consistent with documentation across people andshifts.1.Are there documented definitions for all line and support processes? Where is the documentation located?2.Is the documentation current; does it match actual practice?3.Is standard work available for production tasks? For all levels of staffing, if applicable? Is it posted?4.For repetitive processing areas, are operator balance charts available for each level of staffing, and postedin the areas they reflect?5.Are definitions available, and posted for tasks in the management process (e.g., who maintains trackingcharts, standard meeting agendas, standard work for leaders, etc.)?6.Are Job Instruction Training tools (job breakdown sheets) used for process documentation? For training?Who maintains them? Are they current? Examples?Rate this area/areas from 1 to 5 on the scale below and note the rationale for this rating2: Starting3: Recognizable4: Stabilizing5: SustainableProcessDiscussions in progressStandard methods,Most areas that operate withExpected performance for alldocumentationto update and convertprocedures, step-by-stepmultiple levels of staffing haveregularly occurring tasks andeither indocumentation to useablecharts with expected times,task balance charts withprocesses (even if infrequent)binders or ITformat for a few areas onas applicable, are visible inexpected times as applicable.have been defined andsystem notthe floor. Some task/worksome areas for one level ofProcesses are defined for alldocumented. Processreadilybalance charts visible, butstaffing. In repetitive areasproduction tasks and mostdocumentation is eitheraccessible.most not current and for(e.g., processing orregularly occurring managementdisplayed or accessible atMostone staffing level. Inassembly), standard workprocesses. Processpoint of use. Actual practicedocumentationrepetitive areas, standardor standardized proceduredocumentation is kept at thematches processis out of date –work with expected taskcharts with times arepoint of use or application and isdocumentation; evidence thatdoes nottimes posted, but mostavailable for som
Lean Management Standards Gemba Worksheet Lean Management Gemba Worksheets No 0% Few 25% Some 50% Many 50% Most 75% All 100% 2014 DMLC Reprinted by Permission.