Transcription
2021REPORT CARD FOROHIO’SINFRASTRUCTUREOhio Section of the American Society of Civil EngineersINFRASTRUCTUREREPORTCARD.ORG/OHIO
RIDGES DAMS DRINKING WATER ENERGY HAZARDOUSARKS RAIL ROADS SCHOOLS SOLID WASTE TRANSIT WARIDGES DAMS DRINKING WATER ENERGY HAZARDOUSARKS RAIL ROADS SCHOOLS SOLID WASTE TRANSIT WARIDGES DAMS DRINKING WATER ENERGY HAZARDOUSARKS RAIL ROADS SCHOOLS SOLID WASTE TRANSIT WARIDGES DAMS DRINKING WATER ENERGY HAZARDOUSARKS RAIL ROADS SCHOOLS SOLID WASTE TRANSIT WARIDGES DAMS DRINKING WATER ENERGY HAZARDOUSARKS RAIL ROADS SCHOOLS SOLID WASTE TRANSIT WARIDGES DAMS DRINKING WATER ENERGY HAZARDOUSEVEES PARKS RAIL ROADS SCHOOLS SOLID WASTE TRAWASTEWATER BRIDGES DAMS DRINKING WATER ENERGYWASTE LEVEES PARKS RAIL ROADS SCHOOLS SOLID WASRANSIT WASTEWATER BRIDGES DAMS DRINKING WATERHAZARDOUS WASTE LEVEES PARKS RAIL ROADS SCHOOWASTE TRANSIT WASTEWATER BRIDGES DAMS DRINKINGNERGY HAZARDOUS WASTE LEVEES PARKS RAIL ROADSOLID WASTE TRANSIT WASTEWATER BRIDGES DAMS DRWATER ENERGY HAZARDOUS WASTE LEVEES PARKS RAILCHOOLS SOLID WASTE TRANSIT WASTEWATER BRIDGESDRINKING WATER ENERGY HAZARDOUS WASTE LEVEES PRAIL ROADS SCHOOLS SOLID WASTE TRANSIT WASTEWARIDGES DAMS DRINKING WATER ENERGY HAZARDOUSEVEES PARKS RAIL ROADS SCHOOLS SOLID WASTE TRAWASTEWATER BRIDGES DAMS DRINKING WATER ENERGYHAZARDOUS WASTE LEVEES PARKS RAIL ROADS SCHOOOLID WASTE TRANSIT WASTEWATER BRIDGES DAMS DRWATER ENERGY HAZARDOUS WASTE LEVEES PARKS RAIL
TABLE OF CONTENTS2021 OHIO REPORT CARD COMMITTEE.2EXECUTIVE SUMMARY.3RECOMMENDATIONS TO RAISE THE GRADE.5ABOUT THE INFRASTRUCTURE REPORT CARD.6GRADING CRITERIA.62021 REPORT CARD FOR OHIO’S INFRASTRUCTURE. 7COMPARISON OF 2017 AND 2021 GRADES.8GRADING SCALE.9INFRASTRUCTURE GRADES BY CATEGORYBRIDGES.10DAMS.17DRINKING WATER. 24ENERGY. 31HAZARDOUS WASTE. 38INLAND WATERWAYS. 46LEVEES. 59PARKS. 64PORTS.73RAIL. 78ROADS. 87SCHOOLS . 96SOLID WASTE. 103STORMWATER. 108TRANSIT.119WASTEWATER. 127INFRASTRUCTUREREPORTCARD.ORG/OHIO—1
2021REPORT CARD FOROHIO’SINFRASTRUCTUREABOUT THE OHIO COUNCIL OF LOCALSECTIONS OF ASCEThe Ohio Council was organized in 1969 to focus statewide attention on issues of interest and concern to the approximately, 3,300 ASCE Membersin Ohio. There are six Local Sections in Ohio – Akron-Canton, Central Ohio, Cincinnati, Cleveland, Dayton and Toledo. Each has representation onthe Ohio Council in proportion to its membership. Each Local Section has one delegate for each full one hundred assigned members, with a minimumof two delegates regardless of the number of members assigned. The Ohio Council meets twice annually, in spring and fall. The activities of the OhioCouncil are financed by the Local Sections.OHIO REPORT CARD COMMITTEE CHAIRS AND CONTRIBUTORSReport Card Committee Chair – Dr. Charles Sawyer, P.E., F.ASCE, BCEE, QEP. Lead Hydraulic Modeler, Great Lakes and Ohio River Division, US Army Corps of Engineers,Cincinnati, Ohio.CATEGORY CHAIR AND CONTRIBUTORSBridges(Chair) Edward Adamcyk, P.E., Associate VicePresident, Arcadis US Inc.Daniel M. Cox, P.E., Regional Assistant Manager,Great Lakes and Ohio River Division, US Army Corpsof EngineersContributors: Jim Pajk, Assistant AdministratorDesign and Construction, City of Columbus,Department of Public ServiceVirginia “Autumn” Johnson, Chief, Data ManagementBranch, Planning Center of Expertise for InlandNavigation, US Army Corps of EngineersTom Less P.E., SE, ENV SP, Team Leader – Bridge/Structural EngineerRobert E. Moyer IV, P.E., Hydraulic Engineer/SeniorOperator, Water Management Division, Great Lakesand Ohio River Division, US Army Corps of EngineersDams(Chair) Dr. Troy S. O’Neal, Ph. D., P.E., Dam SafetyProgram Manager, Great Lakes and Ohio RiverDivision, US Army Corp of Engineers.Drinking Water(Chair) Frank Duran P.E., BCEE, Senior Project,Jacobs Engineering Group Cincinnati, OhioContributor: Nick Winnike, P.E., Retired SeniorProject Manager, Jacobs Engineering Group,Cincinnati, Ohio.Energy(Chair) Gary M. Bramble P.E., Retired DP&L/AES,Hamilton, OhioContributor: Jason Montgomery P.E., ProjectManager, Energy Services of WoolportColumbus, OhioHazardous Waste – (Chair) Dr. Charles S. Sawyer,P.E., F. ASCE, Lead Hydraulic Modeler, Great Lakesand Ohio River Division, USACE, Cincinnati, OhioInland Waterways(Chair) John D. Cheek, P.E., Technical Manager,Inland Navigation Design Center, US Army Corps ofEngineersContributors William R. Chapman III, P.E., Chief,Operations and Regulatory Division, Great Lakes andOhio River Division, US Army Corps of EngineersLevees(Chair) David M. Lasoki, P.E., Levee Safety ProgramManager, US Army Corps of Engineers .Contributor: Jacob M. Nienaber, P.G., Levee SafetyProgram Manager, Great Lakes and Ohio RiverDivision, US Army Corps of Engineers, Cincinnati,Ohio.Parks(Chair) Gina Beim, P.E., MCDA Consulting LLC,Cleveland, Ohio.Contributors: Sonya Burns, P.E., Civil/EnvironmentalEngineer, Haley & Aldrich, Inc., Cleveland, Ohio;Tom Less, P.E., SE, ENV SP, Team Leader, Bridge/Structural Engineer, Woolpert; Bruce A. Rankin,RLA, Design Director, Senior Landscape Architect,Woolpert; Dr. Krishna Mazumder, Post DoctoralResearcher, Civil & Environmental Engineering,University of Kansas; Dan Konschak, E.I.T., CivilEngineer, CT Consultants, Inc., Cleveland, Ohio.Ports(Chair) Nicholas LaPointe, P.E., Director, Planningand Capital Development, Cleveland-CuyahogaCounty Port Authority, Cleveland, OhioContributor: Jade Davis, Vice President, ExternalAffairs, Port of Cleveland, Cleveland, OhioRail(Chair) Craig K. Hebebrand, P.E., Senior Project Manager,Acadis US Inc., Cleveland, Ohio.Road(Chair) Mike Pniewski, P.E. P.S., Lucas CountyEngineer, Lucas County Engineer’s Office, Ohio.Schools(Chair) Dr. Esmaeel Asadi, Structural Engineer,TranSystems Corporation, Cleveland, Ohio.Solid Waste(Chair) Mike Stepic, P.E., RS, BCEE, Senior Engineer,Seneca Engineering LLC, Akron, Ohio.Contributors: Sherry E. Voros, P.E., EnvironmentalEngineer, Seneca Engineering LLC, Akron,Ohio; Scott Perry, Director of Operations andMaintenance, Solid Waste Authority of Central Ohio,Grove City, Ohio; Steven M. Viny, CEO, EnvisionHoldings, Cleveland, Ohio; Bruce Schmucker, P.E.,Vice President of Engineering and EnvironmentalAffairs, Clark-Floyd Landfill LLC, Jefferson, In.Stormwater(Chair) George Remias, P.E. Manager of StrategicSupport, North East Ohio Regional Sewer District(NEORSD), Cleveland, Ohio.Transit(Chair) Mike Schipper, P.E. Deputy General Managerfor Engineering & Project Management, GCRTA,Cleveland, OhioWastewater(Chair) Lita Laven, P.E., Project Manager III, NorthEast Ohio Regional Sewer District, Cleveland, Ohio.Contributors: Adam Hoff, P.E., President, HoffConsulting Services, LLC, Maumee, Ohio; Tony Klimek,P.E., Project Manager, Metropolitan Sewer District ofGreater Cincinnati, Ohio.Database Manager for Report Card Content – PeterNarsavage, P.E., Senior Geotechnical Engineer, E.LINFRASTRUCTUREREPORTCARD.ORG/OHIO2
2021REPORT CARD FOROHIO’SINFRASTRUCTUREEXECUTIVE SUMMARYAt its fall meeting, held October 4, 2019, the American Society of Civil Engineers (ASCE) Ohio Council of Local Sections (Ohio Council) formed a committee to develop a report card on the state of Ohio’s infrastructure following themethodology used by the ASCE to assess our nation’s infrastructure. Ohio last underwent a similar effort in 2009. Dr.Charles Sawyer was appointed Chairperson of the report card committee to put together a team of volunteers to developthe report. The Committee assessed the following sixteen infrastructure areas: bridges, dams, drinking water, energy, hazardous waste, inland waterways, levees, parks, ports, rail, roads, schools, solid waste, stormwater, transit and wastewater. Asummary of key findings for each infrastructure category is in the accompanying brochure of this report.ASCE gave the nation’s infrastructure an overall grade of D (poor) in 2017, the same as in 2013. ASCE will be updatingits national infrastructure grade in March 2021. The Ohio committee’s overall assessment gives Ohio’s infrastructure agrade of C-. While slightly better than the current national average, Ohio’s infrastructure is mediocre and exhibits significant deterioration. Condition and capacity are areas of serious concern with strong risk of failure.What does Ohio’s infrastructure do? Every day it: Facilitates the movement of goods throughout the state and region Provides water for drinking and other uses Manages wastewater, stormwater, hazardous waste and solid waste Provides energy where needed Supports the economy Supports the quality of life of residentsAn analysis of Ohio’s infrastructure reveals a mixed performance.Some of the state’s privately owned infrastructure such as electric utilities and rails have seen increases in funding whileroads, ports, inland waterways and many other types of public infrastructure are in dire need of increased funding. Themajority of Ohio’s bridges, dams, levees, drinking water distribution systems and ports are approaching or have exceededtheir design life expectancy. Ohio’s deficient dams need about 300 million for rehabilitation. Levee systems are nearly50 years old and in need of risk assessments given that they provide flood risk reduction for more than 151,000 peopleand 27.5 billion in property. Inland waterways need approximately 120 million to address critical maintenance over thenext 15 years and funding for operation and maintenance of park land is inadequate. Protecting Ohio’s water resourcesby managing stormwater run-off and improving water quality by sustained wastewater infrastructure improvement is ofhigh priority. Surface water from Lake Erie and the Ohio creeks and rivers are the source of clean drinking water for manyOhioans. Ohio requires a considerable high-quality infrastructure to thrive, not only among competitive states in the U.S.,but to compete among modern world economies.INFRASTRUCTUREREPORTCARD.ORG/OHIO3
2021REPORT CARD FOROHIO’SINFRASTRUCTUREOhio roadways and bridges carry the third highest freight volume in the U.S. They also accommodate the sixth most vehicle miles travelled, making the state an essential tool in the national economy. While surface transportation, rail, portsand inland waterways are all meeting the needs of Ohioans presently, continued investment is needed to ensure that thesesystems can sustain increased volumes in the future, expand the local economy and ensure no sector is left behind. Suchinfrastructure systems are indispensable for the various industries in Ohio, particularly goods producing sectors such asmanufacturing, agriculture and mining. These goods need to be safely and efficiently moved within Ohio, across the country and out of the U.S., for the nation to maintain long-term global competitiveness.The state’s transit systems need to become an immediate priority. With so many travelers coming through Ohio fortourism and to gain access to other states, local businesses cannot thrive without an adequately funded transit system. Inaddition, the local economy will remain stagnant without reliable methods of transportation for all.Increased spending on Ohio’s infrastructure will have both short-term and long-term benefits. In the short run, infrastructure will stimulate economic activity and create jobs within the state. In the long run, the impacts would be more significantbecause improvements in our infrastructure: Lower the cost to deliver goods Lower prices of manufactured goods Reduce the cost of materials Reduce dependency on imports Improve the health of the work force Create greater movement of people within the state Have an overall positive effect on both businesses and consumersContinued funding of grant and low interest loan programs will be imperative as most communities have seen a significantreduction in revenue in response to the recent pandemic – a trend that will likely continue for the remainder of 2021.INFRASTRUCTUREREPORTCARD.ORG/OHIO4
RECOMMENDATIONS TO RAISE THE GRADEOhio’s infrastructure is the foundation for thriving communities and businesses. Its roads, water systems, energy grid and other infrastructure components help drive the economy, support quality of life and ensure public health and safety for residents. Unfortunately,Ohio has been underinvesting in its infrastructure for decades.In addition, the COVID-19 pandemic made an already difficult situation worse. A sizable portion of Ohio’s infrastructure systems issupported by user-generated revenue funding. Since the onset of COVID-19, the use of Ohio roads and transit are down, use of inlandwaterways and drinking water are also down. Meanwhile, municipal and state budgets are becoming more and more inadequate underunparalleled demands, meaning less support is available for parks, schools and other publicly owned infrastructure, precisely at the timemore investments should be made.However, this could be an opportunity for Ohio to reimagine its future and make infrastructure investment a centerpiece of its immediate response as well as its long-term economic recovery strategy. A renewed focus on investment, leadership and planning andpreparing for the future will help Ohio improve on the state of its infrastructure.INVESTMENT1. Ohio should consistently dedicatepublic funding from both the stateand local levels to infrastructure investment. The state should sufficientlyassess user-generated fees so that infrastructure trust funds are used onlyfor new infrastructure projects.2. To ensure long-term, sustainable funding for the federal surface transportation program, the user fee on gasolineand diesel fuel must be raised and tiedto inflation to restore its purchasingpower, fill the funding deficit and ensure reliable funding for the future.3. The state should authorize programsthat improve specific categories ofdeficient infrastructure, and then support that commitment by fully fundingthem in an expedient, prioritized manner.4. Infrastructure owners and operatorsmust charge—and Ohioans must bewilling to pay, rates and fees that reflect the true cost of using, maintaining and improving all infrastructure, including our water, waste, transportationand energy services.LEADERSHIP & PLANNINGSmart investment will only be possible withleadership, planning and a clear vision forOhio’s infrastructure. Leaders from all levels of government, business, labor and nonprofit organizations must come togetherto ensure all investments are spent wisely,prioritizing projects with critical benefitsto the economy, public safety and qualityof life, while also planning for the costs ofbuilding, operating and maintaining the infrastructure for its entire lifespan.PREPARING FOR THE FUTURE1. Develop active community resilienceprograms for severe weather eventsto establish communications systemsand recovery plans as well as reduceimpacts on the local economy, qualityof life and environment.To do so, Ohio must:1. Encourage projects that receive federalfunding use life cycle cost analysis anddevelop a plan for funding the project,including its maintenance and operation, until the end of its service life.2. Create incentives for state and localgovernments as well as the private sector to invest in maintenance and to improve the efficiency and performanceof existing infrastructure.3. Develop tools to ensure that the projects most in need of investment andmaintenance are prioritized, to leverage limited funding wisely.4. Streamline the project permittingprocess across infrastructure sectors.This should include safeguards to protect the natural environment, providegreater clarity to regulatory requirements, bring priority projects to realitymore quickly and secure cost savings.5. Identify infrastructure projects attractive to private sector investment andpublic-private partnership.INFRASTRUCTUREREPORTCARD.ORG/OHIO52. To ensure long-term utility, consideremerging technologies and shifting social and economic trends – such as autonomous vehicles, distributed powergeneration and storage and larger ships– when building new infrastructure, toassure long-term utility.3. Improve land use planning at the local level to consider the function ofexisting and new infrastructure, thebalance between the built and naturalenvironments and population trends incommunities of all sizes, now and intothe future.4. Support research and developmentinto innovative new materials, technologies and processes to modernizeand extend the life of infrastructure,expedite repairs or replacement and
2021REPORT CARD FOROHIO’SINFRASTRUCTUREABOUT THEINFRASTRUCTUREREPORT CARDGRADING CRITERIAMETHODOLOGYEvery four years America’s civil engineers provide a comprehensive assessment of the nation’s 16 major infrastructure categories in ASCE’s NationalInfrastructure Report Card. Using a simple A to F school report card format, the Report Card examines current infrastructure conditions and needs, assigninggrades and making recommendations to raise them. The Ohio Council of Local ASCE Sections Infrastructure Report Card Committee adopted the same simple A to F report card format, assessing relevant data and reports, consulting with technical experts and assigning a grade for each category using the following criteria:The Report Card Sections are analyzed based on the following eight criteria:CAPACITY Does the infrastructure’s capacity meet current and future demands?CONDITION What is the infrastructure’s existing andnear-future physical condition?FUNDING What is the current level of funding from alllevels of government for the infrastructure category ascompared to the estimated funding need?FUTURE NEED What is the cost to improve the infrastructure? Will future funding prospects address the need?OPERATION AND MAINTENANCE What is theowners’ ability to operate and maintain the infrastructure properly? Is the infrastructure in compliance withgovernment regulations?PUBLIC SAFETY To what extent is the public’s safetyjeopardized by the condition of the infrastructure andwhat could be the consequences of failure?RESILIENCE What is the infrastructure system’s capability to prevent or protect against significant multihazard threats and incidents? How able is it to quicklyrecover and reconstitute critical services with minimumconsequences for public safety and health, the economy,and national security?INNOVATION What new and innovative techniques,materials, technologies, and delivery methods are beingimplemented to improve the infrastructure?INFRASTRUCTUREREPORTCARD.ORG/OHIO6
2021 REPORT CARD FOROHIO’S DSENERGYSCHOOLSHAZARDOUSWASTESOLID WASTEINLANDWATERWAYSSTORMWATERLEVEESTRANSITPARKS .ORG/OHIO7
2021REPORT CARD FOROHIO’SINFRASTRUCTURECOMPARISON OF 2017 AND 2021 GRADESOHIOCategoryOhio 2021National 2017BridgesC C DamsC-DDrinking WaterD DEnergyCD Hazardous WasteD D Inland WaterwaysD DLeveesDDParksC-D PortsCC RailBBRoadsDDSchoolsC D Solid WasteB-C StormwaterD N/ATransitDD-WastewaterC-D Overall GPAC-D INFRASTRUCTUREREPORTCARD.ORG/OHIO8
2021REPORT CARD FOROHIO’SINFRASTRUCTUREGRADING SCALEEXCEPTIONAL: FIT FOR THE FUTUREThe infrastructure in the system or network is generally in excellent condition, typically new or recently rehabilitated, andmeets capacity needs for the future. A few elements show signs of general deterioration that require attention. Facilities meetmodern standards for functionality and are resilient to withstand most disasters and severe weather events.GOOD: ADEQUATE FOR NOWThe infrastructure in the system or network is in good to excellent condition; some elements show signs of general deterioration that require attention. A few elements exhibit significant deficiencies. Safe and reliable with minimal capacity issues andminimal risk.MEDIOCRE: REQUIRES ATTENTIONThe infrastructure in the system or network is in fair to good condition; it shows general signs of deterioration and requiresattention. Some elements exhibit significant deficiencies in conditions and functionality, with increasing vulnerability to risk.POOR: AT RISKThe infrastructure is in poor to fair condition and mostly below standard, with many elements approaching the end of theirservice life. A large portion of the system exhibits significant deterioration. Condition and capacity are of significant concernwith strong risk of failure.FFAILING/CRITICAL: UNFIT FOR PURPOSEThe infrastructure in the system is in unacceptable condition with widespread advanced signs of deterioration. Many of thecomponents of the system exhibit signs of imminent failure.INFRASTRUCTUREREPORTCARD.ORG/OHIO9
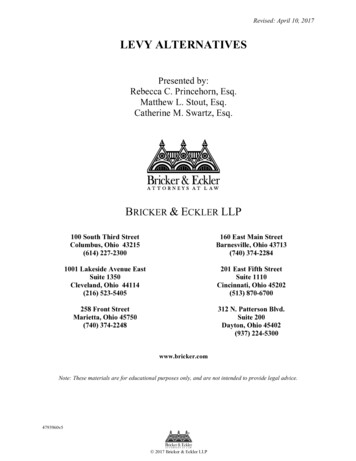
BRIDGESBRIDGESGRADE: C EXECUTIVE SUMMARYOhio is home over 44,000 bridges, of which 58% are rated in good condition, 36% are in satisfactory or fair condition and 6% are inpoor condition. There are 2,012 (4.5%) bridges that require a reduced load capacity and 200 that are closed altogether. Starting in 2018,the Ohio legislature enabled counties to generate additional revenues for improving their local transportation network by levying a 5permissive fee on vehicle registration, though increases have not been uniformly adopted across the state. In 2019, state leaders raisedthe state’s gas tax from 28.0 cents to 38.5 cents. Overall, Ohio faces a significant funding shortfall, particularly in addressing the state’sfuture needs. Funding has remained static and is not indexed to inflation, while the system continues to age at a faster rate than repairsor replacements occur. While funding challenges limit the number of annual repairs or replacements, an increased emphasis on systempreservation has helped to hold off the growing needs of Ohio’s bridges.INFRASTRUCTUREREPORTCARD.ORG/OHIO10
2021REPORT CARD FOROHIO’SINFRASTRUCTUREFIGURE 1: OHIO BRIDGE CONDITION SUMMARYINTRODUCTIONThe Ohio Revised Code (ORC) defines a bridge as any structure of 10 feet or more clear span, or 10 feet or more in diameter, situatedon, above or below a highway, and requires all bridges to be inspected annually. The Federal Highway Administration (FHWA) NationalBridge Inventory (NBI) defines a bridge as a structure that is 20 feet or longer and requires an inspection frequency of two years. Ohio’s10-foot-long bridge definition and greater inspection frequency places a higher level of responsibility on bridge owners in the state; Ohiois the only state in the U.S. with this requirement. The annual bridge inspection requirement along with the significant number of bridgesin the state inventory requires additional staffing and other resources to inspect, report and load rate all bridge structures. The table belowsupports this point by identifying the bridge distribution by length based on the ORC:TABLE 1: OHIO BRIDGESNUMBERBRIDGES IN OHIO44,736Total number of bridges over 10-foot span30,805Total number of bridges over 20-foot span13,931Additional Ohio Bridges between 10- and 20-foot span27,162Total number of FHWA/NBI BridgesState of Ohio national rankings Second greatest number of bridges, second only to Texas Fourth highest volume of interstate lane miles (6,800) Fifth highest traffic volume Third largest quantity of truck traffic on the interstateINFRASTRUCTUREREPORTCARD.ORG/OHIO11
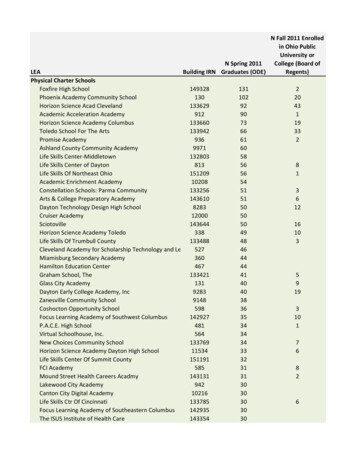
2021REPORT CARD FOROHIO’SINFRASTRUCTUREWhile ODOT has invested significant resources on major bridges in the state including the I-90 George V. Voinovich Bridge ( 573.6million), the I-480 structures over the Cuyahoga Valley ( 227.8 million) and the I-71 Jeremiah Morrow ( 88.1 million), funding remainsa challenge for the replacement of the bi-level Brent Spence Bridge and adjoining roadways over the Ohio River which carry both I-71 andI-75 ( 2.6 billion), and recently suffered a major truck fire and shutdown for emergency repairs.CONDITION AND CAPACITYMAP-21 Rulemaking defines bridge condition general appraisal ratings in the following ranges: Good (9-7); Fair (6-5); Poor (4-0).ODOT has established a systemwide goal of having an average general appraisal rating of 6.8. This goal demonstrates ODOT’s effortto judiciously use limited resources across a large infrastructure portfolio including interstate and freeway pavement, interchanges,traffic signing, safety features and other operations and maintenance commitments.TABLE 2: BRIDGE CONDITION SUMMARY BASED ON STATEWIDE, 2020 ODOT BRIDGE 9944,736Below 100% Total Deck AreaLegal osed 02,012Nationally, the average bridge age is 45 years, which is just five years shy of the typical 50-year design life expectancy. The averageage of a bridge in Ohio is 46 years, with 48% of ODOT bridges and 42% of all bridges in Ohio 50 years or older.It is also recognized by owners that a bridge’s service life is often longer than its design life, requiring additional repair and rehabilitationinvestment as the bridge continues to age. 17% of Ohio’s bridges are now older than 75 years. To correct this backlog and achieve theState’s system goal of bridges below a 75-year design life by 2045, over 52% of Ohio’s bridges (23,078) will need major rehabilitationor replacement between 2020 and 2045. This equates to 923 bridges per year, a replacement rate 1.8 times higher than the replacement of 507 bridges per year from the last twenty years.INFRASTRUCTUREREPORTCARD.ORG/OHIO12
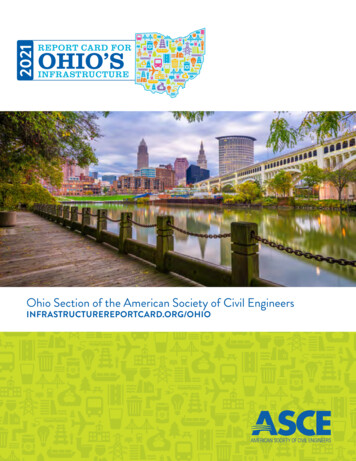
FIGURE 2: OHIO BRIDGE AGE DISTRIBUTION BASED ON STATEWIDE, 2020 ODOT BRIDGE INVENTORYFUNDING AND FUTURE NEEDFunding for transportation projects in Ohio comes from several revenue streams. Funds are derived from taxes, both federal and stateon gasoline and diesel fuels, permissive license tag fees, income tax, tolling and other sources. Per ODOT Fiscal Year (FY) 2019 AnnualReport, revenue for FY19 amounted to 3.23 billion.FIGURE 3: ODOT FUNDING DISTRIBUTIONSTATEWIDE(FIGURE COURTESY OF ODOT DISTRICT 12)The primary revenue source is gas tax revenue fromgasoline and diesel fuel. The current Ohio per-gallontax rates are 38.5 cents for gasoline and 47 cents fordiesel. A federal tax of 18.4 cents for gasoline and 24.4for diesel per gallon is also levied. In 2019, Ohio H.B.62 increased the per-gallon gas and diesel rates 10.5cents and 19.0 cents per gallon, respectively, for thefirst time since 2006. The federal per-gallon rates havenot increased since 1993. According to the ODOTFY19 Division of Finance Financial and Statistical Report, the State Motor Fuel tax comprises approximately 93% of the total state revenue ODOT receives.ODOT established a nine-member Transportation Review Advisory Council (TRAC) in 1997 with the purposeINFRASTRUCTUREREPORTCARD.ORG/OHIO13
2021REPORT CARD FOROHIO’SINFRASTRUCTUREof assisting project selection and prioritization of major new projects.
Operator, Water Management Division, Great Lakes and Ohio River Division, US Army Corps of Engineers Levees (Chair) David M. Lasoki, P.E., Levee Safety Program Manager, US Army Corps of Engineers . Contributor: Jacob M. Nienaber, P.G., Levee Safety Program Manager, Great Lakes and Ohio River Division, US Army Corps of Engineers, Cincinnati, Ohio.