Transcription
A Review of Aquatic Plant Monitoringand Assessment MethodsBy John D. Madsen and Ryan M. WersalGeosystems Research Institute, Mississippi State UniversityFor Aquatic Ecosystem Restoration FoundationMay 12, 2012
INTRODUCTIONUnderstanding the dynamics of aquatic plant populations in a given water body hasbecome increasingly important due to the introduction and spread of numerous nonnative species. These plants are generally introduced from other parts of the world, somefor seemingly beneficial or horticultural uses; however, the majority have escapedcultivation and now cause widespread problems (Madsen 2004). Non-native plants affectaesthetics, drainage, fishing, water quality, fish and wildlife habitat, flood control, humanand animal health, hydropower generation, irrigation, navigation, recreation, andultimately land values (Pimentel et al. 2000, Rockwell 2003). For example, the estimatedtotal cost of invasive aquatic plants, including management and losses, in the UnitedStates is approximately 110 million/yr (Pimentel et al. 2005). The cost of aquatic weedcontrol in irrigation districts in 17 western states was estimated to be greater than 50million/yr (Anderson 1993). Florida state agencies have spent nearly 250 million tomanage hydrilla in Florida waters over the past 30 years; if one accounts for localgovernment and local water management districts; this total approaches 750 million inmanagement costs associated with hydrilla alone (Schardt pers. comm.).The direct economic impacts, such as those listed above, are easy to quantify; howeverthere are other impacts of aquatic plants that are much more difficult to ascertain. Theseimpacts include the intrinsic benefits of aquatic habitats and the ecosystem services thesehabitats provide (Charles and Dukes 2007). Ecosystem services provide an importantportion of the total contribution to human health and welfare on this planet (Costanza etal. 1997). Globally, it is estimated that marine systems provide 21 trillion in ecosystemservices, followed by freshwater habitats at 4.9 trillion (Costanza et al. 1997). Theseestimates highlight the importance of conserving aquatic habitats and the services theyprovide to human welfare (Costanza et al. 1997). By any measure, the cost of invasion issignificant, and the investment in management and research has not kept pace in order tominimize the costs associated with invasions (Sytsma 2008).As the threat of non-native plant species increases, the development and refining ofmethods to detect, monitor, and ultimately assess management of these species is critical.However, the use of quantitative methods to monitor and assess aquatic plants has notbecome as standardized as other components in aquatic systems, such as the biotic orphysical components (Lind 1979, Madsen 1999). Pursuant to this, millions of dollars arespent every year in managing aquatic vegetation in waters throughout North America;however, only a small fraction is allocated to acquiring reliable quantitative data regardingplant populations or in assessing management techniques (Madsen and Bloomfield 1993).In many cases, quantitative assessments are left out completely due to budget constraints,untrained personnel, or a lack of understanding with respect to what methods areavailable and how to implement them effectively.There is a growing consensus among researchers and managers from all aspects of aquaticecology and management that effective and quantitative methods need be utilized orstandardized in order to maximize management efforts and monitor non-target impacts.
With respect to assessing management techniques; effective monitoring is needed toevaluate new biological control projects to determine which agents are effective and whatfactors limit or enhance their success (Blossey 2004). Often times monitoring programs areunderfunded or inadequate in scope and do not identify where and why control is or is notsuccessful (Blossey 2004). The development or improvement on methods for evaluatingnon-target impacts of herbicides are also critical, especially with respect to native speciesof concern or threatened and endangered species (Getsinger et al. 2008).Environmental factors can also have an impact on plant growth and function to structureaquatic plant communities both spatially and temporally. For submersed and emergentplant communities, zonation along a depth gradient is often observed as a function of lightavailability (Middelboe and Markager 1997). Sediment composition also influencessubmersed plant colonization and distribution (Case and Madsen 2004, Doyle 1999,Madsen et al. 2001, 2006). Floating aquatic plant growth is often limited by availablenutrients in the water column with nuisance growth following temporal changes in nutrientloading. For example, water hyacinth responds to flooding events in large riverine systemswhere during flood cycles, water moves out into adjacent lands and upon receding bringswith it an increase in nutrients to support water hyacinth growth (Kobayashi et al. 2008).In general, there are a number of factors that impact plant growth across spatial andtemporal scales; and effective management requires an understanding of aquatic plantbiology and the response of plants (both target and non-target) to management actions(Sytsma 2008). The only way to effectively achieve this is to utilize methods that candocument the distribution, growth, and abundance of aquatic plants over time (Sytsma2008).Assessment and monitoring of aquatic plants has become more important over the lastyear as the National Pollutant Discharge Elimination System (NPDES) permit program hasbeen implemented to regulate aquatic plant management activities, most notably the useof herbicides. One of the requirements included in the federal NPDES pesticide generalpermit is for the quantitative assessment of nuisance plant coverage in order to documentthat the target species exceed a nuisance threshold. Quantitative methods are also requiredto assess the impacts of management activities on target and non-target plant species.Therefore, the objectives of this paper are to 1) offer a broad overview of availablemethods that can be utilized for aquatic plant monitoring and assessment, and 2) provideguidelines regarding using these methods for assessing aquatic plants, as well as pointingout methods that are not effective for this purpose. These guidelines will cover submersed,floating, and emergent plant species for lakes and flowing waters, as well as nuisanceplanktonic and periphytic algae. The goal is to equip natural resource managers andpermit holders with the tools and justifications to address NPDES permit requirements.OVERVIEW OF AQUATIC PLANT MONITORING AND ASSESSMENT METHODSBefore undertaking any sort of monitoring or assessment program, one must correctlyidentify the species of interest. Often, when incorrect identifications occur, the processused to document species identifications is poor, including the lack of herbarium
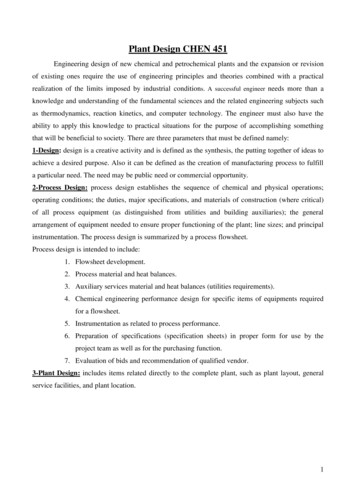
specimens (Hellquist 1993) or digital photography adequate to correct thesemisidentifications. Correct identification of both target and non-target plants are crucial inidentifying rare or threatened species, as well as aiding in delineating areas with species ofspecial concern (Hellquist 1993). Devoting time and resources to construct a properspecies list for a given water body can be invaluable in developing a management plan;furthermore, species lists are often required in the preparation of environmental impactstatements and permitting requirements (Hellquist 1993).A number of methods exist for sampling aquatic plants in order to develop a species list,determine distributions, and to estimate abundance in a given water body. These methodsrange from low cost visual estimations of plant occurrence and cover to high cost remotesensing that can sample a water body or an entire landscape. An important factor toremember when selecting a method is to choose the method that will meet the desiredobjectives for the project; but more importantly, to choose a method that is quantifiableand can be subjected to statistical analyses (Madsen and Bloomfield 1993, Spencer andWhitehand 1993). Madsen and Bloomfield (1993) summarized the importance ofcollecting quantitative as: Quantitative data are objective measurements, and relying on subjectivemeasurements leads to opinion which is not a sound basis for managementdecisions. Quantitative data can be subjected to rigorous statistical analyses that can leadto the development of scientifically based management guidelines. Quantitative data can identify management techniques that were ineffective andreduce the cost of a management program. Quantitative data can be utilized by different users other than the observer.In order to ensure that monitoring and assessment data are collected in a manner that issuitable for quantifiable analyses it is important to collect data using an appropriatesampling design. The four most common sampling designs are the completely random,stratified random, random- systematic, and systematic designs (Figure 1). In general, thecompletely random design removes biases associated with the selection of samplinglocations; however, Barbour et al. (1999) points out several limitations to this design inlarger areas. A random selection of points may place points in difficult to access orinaccessible areas, and the little information these points would provide does notcompensate for the added time it would take to sample them. The field time required tosample random points is large and would likely be an inappropriate choice for largesurveys. A random selection of points may result in the location of some points beingclumped, leaving large areas under-sampled. A completely random design would undersample rare yet important species that would be sampled using other designs.
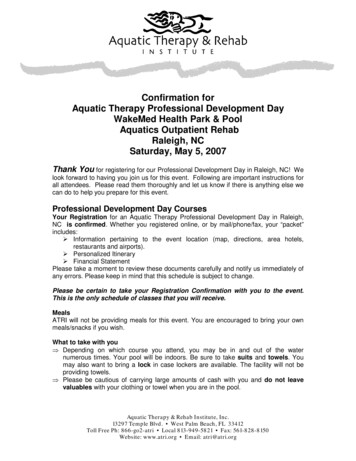
A stratified random design is typically utilized ifa gradient exists in the survey location, foraquatic surveys this could include a river orstream channel running through a reservoir. Thearea can be divided into homogenous sectionswith sampling points randomly distributedwithin each section. The systematic samplingdesign places sample locations within an areabased on grid with a pre-determined spacing.The systematic design works well for an initialsurvey as it will cover the entire water body andthe observer is more apt to find most species.Also, if data such as water depth or Secchidepth is collected at sampling locations, themaximum depth of plant colonization can bedetermined and the littoral zone delineated forfuture surveys. A random-systematic designselects areas either by random or using astratified approach, the survey is then initiatedby selecting the starting point either a randomlyor in a stratified fashion then conducted using asystematic sampling approach (Barbour et al.1999). The random-systematic design workswell if a gradient is present, or if the littoralzone is well defined thereby allowing samplinglocations to be stratified within the littoralzone.A summary of the more common aquatic plantsampling methods (including non-quantifiable)are listed in Table 1 with specific guidelinesdiscussed in later sections. The simplestestimates of plant cover and abundance can beachieved using visual observations while on awater body. Generally, total acreage isestimated for each species based on the totalarea of the water body. Visual estimations areFigure 1. A conceptual representation of planthighly subjective, are not repeatable, and highlycommunity sampling designs (A) completely random,variable among observers, making them not(B) stratified random, (C) random-systematic, and (D)systematic.amendable to statistical treatment. Also, it isvery difficult to estimate abundance of submersed aquatic plants, and as such species aremissed or underestimated.
Table 1. A summary of vascular aquatic plant monitoring and assessment methods (adapted from Madsen and Bloomfield ion* ApplicationsPointInterceptPresence/AbsenceLowLow, canbe spatially variableS,E,FSmall plot assessments, baseline surveys, whole lakemonitoring, and long- term assessmentsLineTransectPoints, QuadratsModerateModerate, can bespatially variableS,E,FSmall plot assessments, monitoring -High, depends on S,E,Fhow many people aremaking estimatesInitial survey though this method is highly subjectiveand not quantifiableSemiquantitativeVisualLowLow, canbe spatially variableS,E,FInitial surveysHighSSmall plot assessments, will over or under estimatespecies depending on compositionHigh, can be spatiallyand temporallyvariableModerate,can be temporally andspatially variableModerate,can be temporallyvariableLow-High, willdepend on theresolution of imagesLow-High, willdepend on dataunderlying the modelsS,FSmall plot assessmentsSSmall plot assessments, Long-term monitoringE,FSmall plot assessmentsE,FVisualization of data, whole lake, long-termmonitoring, not species specificS,E,FPotential predictability, estimations of futureinvasions and plant growth, evaluate effects ofalternative approachesBiomassNonDestructiveRake Fullness orModerateSpinning RakeMethodsCoring, Quadrats, HighBox Sampler, hologicalHighMeasurementsGIS, Remote Sensing ModerateMathematicalModelsLow-High*S Submersed, E Emergent, F Floating
A compromise between subjective estimates and quantitative methods would be a semiquantitative survey in which preselected areas are surveyed using a presence/absenceapproach to establish the frequency of occurrence for species (Madsen and Bloomfield1993). Divers or a plant rake can be utilized to sample submersed species. This methodwould be useful to establish basic plant community composition if a number of sites weresurveyed, and would capture more species than subjective estimates. Though again, similarto subjective estimates, these data cannot be readily analyzed and may not be adequate inestablishing thresholds to meet permitting requirements.Quantitative methods that can be utilized to rapidly collect information regarding plantoccurrence, species richness, and distribution include the point intercept and line transectand methods. These methods can be used in both small plots and in multiple locationswithin a water body to establish plant community characteristics or assess managementefficacy. Point intercept surveys are typically conducted using a pre-selected grid of pointsat a user specified interval (Madsen 1999). By pre-selecting points, it removes thesubjectivity with respect to sample locations. Once on the lake a Global Positioning System(GPS) is then used to navigate to each point where a plant rake is deployed to samplesubmersed vegetation. Emergent and floating vegetation can also be recorded at eachpoint as well. The point intercept method is very adaptable to meet the desired objectivesof a management program. More importantly, surveys are developed based on a givensampling design (random, stratified random, random-systematic, and systematic) whichallow data to be statistically analyzed to compare changes in species occurrence over timeand to assess the effectiveness of management techniques (Wersal et al. 2010). Withadvances in GPS and Geographic Information Systems (GIS) technologies, point interceptsurvey protocols can be developed, implemented, and results analyzed while still on thewater. Point intercept is a robust sampling method that is less sensitive to differences inabundance or season, but also may not register those very difference in abundance that arethe result of management activity.Line transect methods are similar to the point intercept method, however, with transectsone can collect presence/absence data, cover data, or use quadrats along transects tocollect density and abundance measurements (Grieg-Smith 1983, Madsen et al. 1996,Titus 1993, Getsinger et al. 1997). In general, the line transect method requires lesstechnology then point intercept surveys, as transects can be established and sampleswithout the use of a computer or GPS technology (Madsen 1999); though thesetechnologies are more readily available and more cost effective than in previous years andare routinely used for transect establishment. Transects can be arranged in any number ofsampling designs to capture variability within the water body as long as an appropriatenumber of transects are sampled (Titus 1993). Transect lengths can be any length fromlarge field based projects (Titus 1993), to small scale (3 cm) intervals to estimate foliagecoverage of submersed plants (Sidorkewecj and Fernández 2000). The line transectmethod is particularly useful in determining aquatic plant community characteristics insmall study sites over time and to assess management efficacy in small plots.In addition to constructing a species list through presence/absence information, often
times it is of interest to collect plant abundance data. Plant abundance is bestcharacterized using a biomass harvesting technique such as a coring device, quadrats withand without divers, ponar dredge, or the semi-quantitative rake fullness method. Biomassharvesting is labor intensive and can be subject to spatial and temporal variabilitydepending upon plant densities, plant community composition, and life history traits.However, biomass techniques provide the best information on species abundance as longas an adequate number of samples are collected to overcome issues with variability(Madsen and Bloomfield 1993, Madsen 1993). Pursuant to this, biomass techniques suchas coring devices, box corers, and dredges are the only techniques that can adequatelysample below ground plant biomass such as root crowns, rhizomes, tubers, and turions(Madsen et al. 2007, Owens et al. 2010). Though, emergent vegetation is often difficult toharvest with corers and dredges.Before undertaking a biomass sampling program, it is necessary to understand the tradeoffs between the labor involved in using the sampling device, the area of the samplingdevice, and the number of samples needed to adequately assess the target plantpopulation (Madsen 1993). For example, box corers generally have an area of 0.1 m2 andPVC coring devices and area of 0.018 m2; therefore, fewer samples are needed with thelarger sampling device to overcome issues with variability and collect a statistically-relevantnumber of samples (Downing and Anderson 1985). However, larger samplers require moreprocessing time, and therefore it may be beneficial to use a smaller sampling device andcollect more samples (Downing and Anderson 1985). For instance, a corer of 0.018 m2may require 30 samples in a given community to get a statistically-significant sample, butmay actually require less time to collect and sort than the 10 samples needed for astatistically-adequate sample with a 0.1 m2 quadrat. The spinning rake method isconducted by lowering a plant rake on a fixed pole to the bottom of the water body(Skogerboe et al. 2004, Skogerboe and Getsinger 2006, Owens et al. 2010). The plant rakeis then turned once 360 to harvest aboveground plant material. The rake head has aknown length, and when turned, serves as a circular quadrat in which an area can becalculated. Although this method is easy and low intensity, it is less precise than otherbiomass methods especially in dense vegetation (Johnson and Newman 2011) where ittends to overestimate abundance and will not sample below ground plant structures. Aswith any quantitative method, biomass techniques should be used following a samplingdesign, and in doing so, will allow for statistical analysis of collected data. To determine ifa statistically-adequate number of samples has been collected, a power analysis should beperformed on an initial set of data from the site (Madsen 1993, Spencer and Whitehead1993, Downing and Anderson 1985).To overcome the labor intensity associated with biomass techniques, some researchershave developed plant rake methods such as the rake fullness method (Indiana Departmentof Natural Resources 2007, Hauxwell et al. 2010). The rake fullness method is divides therake (and sometimes tines) into discrete increments and when plants are harvested anabundance ranking is given for each species. This method while easy and low intensity,relies on subjective ratings by an observer. Visual ratings tend not to be consistent betweenobservers and should not be relied upon as a stand-alone measurement. Pursuant to this,
Yin and Kreiling (2011) also reported potential issues with using rake methods to estimatedensity, and concluded that cross-species comparisons is not encouraged unless theefficiency of the rake method has been determined for each species being compared. Thiswould increase survey time and the overall cost of a management program.In some instances it may not be desirable to harvest biomass or use a method that maydamage existing aquatic plants, especially in the presence of rare or threatened species arein the area. In these cases, non-destructive methods could be used to estimate plantabundance, though some methods like hydroacoustics and remote sensing cannotdifferentiate plant species. Hydroacoustic sampling targets submersed aquatic plants byusing and echosounder or fathometers (depth-finders) that can record information fromthe transducer onto flash memory devices (Sabol et al. 2002, Hohausová et al. 2008,Sabol et al. 2009). The equipment needed to perform hydroacoustic surveys can be costprohibitive for most programs, but large natural resource agencies that would use thesystem regularly could map submersed vegetation for approximately 2.06/ac (Sabol et al.2009). Hohausová et al. (2008) reported a positive relationship between thehydroacoustic signal and dry biomass, though the relationship could not differentiatespecies and results would likely be influenced by the dominant species present.With respect to monitoring and assessment, hydroacoustic surveys allow for the estimationof total biovolume of plants in a given area, which could be used to quantify seasonalchanges in the whole plant community over time. Species specific information cannot bedetermined unless another sampling method like point intercept surveys are utilized toconstruct a species list.Unlike hydroacoustic surveys, remote sensing is most effective in targeting riparian,emergent and floating vegetation (Everitt et al. 2007, Liira et al. 2010, Midwood andChow-Fraser 2010, Robles et al. 2010). Remote sensing is often expensive as satelliteimages of the target area have to be purchased, specialized software is needed to analyzeimages, and trained personnel are needed to complete the analyses. However, remotesensing is useful in long-term quantification of vegetation in a given area without having toactually use survey crews year after year. It also allows for the monitoring of larger areasthan what are feasible using survey crews alone; though it is recommended to implementsome sort of ground-truthing survey to verify plant species composition and the spatialaccuracy of remotely sensed data. Other non-destructive sampling can also be done atsmaller scales to estimate abundance based on plant morphology measurements (Daoustet al. 1998, Thursby et al. 2002); however, this is typically only used on emergent orfloating vegetation as these species are readily accessible and measurements can be takeneasily.GUIDELINES FOR SAMPLING AQUATIC PLANTSWhen considering which method or methods to choose for a monitoring or assessmentprogram it is essential to consider the target species, co-occurring nontarget species, thegrowth form of the target species, and the species life history traits. Ultimately, a method
should be chosen to meet the objectives of the management plan. We have offered adecision matrix to assist in choosing a monitoring or assessment method (Table 2), andhave developed guidelines for the three growth forms of aquatic vascular plants along withplanktonic and filamentous algae. These guidelines are not meant be exhaustive ordefinitive, but are effective methods that have been verified by scientific evaluations or arerecommended in the Standards Methods for the Examination of Water and Wastewater(Rice et al. 2012) to estimate plant coverage or abundance.Long DESRequirementsWhole LakeAssessmentXXXXXCostSmall PlotAssessmentPoint InterceptLine TransectSubjective EstimateSemi- quantitative (Visual)Semi- quantitative (Rake Fullnessor Spinning Rake)BiomassPlant MeasurementsGISRemote SensingMathematical ModelingInitialSurveyTable 2. A decision matrix to guide selection for aquatic plant monitoring and assessment methods.Desired ApplicationXLowLowLowLowMarginal derateModerateHighLowSubmersed SpeciesEstimating Cover and Distribution in Lakes. The simplest quantitative approach toestimating submersed aquatic plant cover and distribution in a monitoring program is toperform a point intercept survey. The point intercept survey works well to characterize theaquatic plant community (Mikulyuk et al. 2010), and monitor trends in communitycomposition through time within a water body or system (Wersal et al. 2006, Madsen etal. 2006, Madsen et al. 2008). The point intercept method (or variations of rake methods)has become standard sampling protocol in the states of Washington (Parsons 2001),Idaho, Montana, Minnesota, and Wisconsin to collect initial plant community informationand to establish management areas.The point intercept survey works well in assessing field scale studies and operationalmanagement programs. Points can be generated in any treatment area and rapidlysampled to assess a number of small plots or effects throughout a water body in the caseof a whole lake treatment (Parsons et al. 2001, Parsons et al. 2004, Parsons et al. 2007,Parsons et al. 2009, Wersal et al. 2010, Robles et al. 2011). This method offers a morestrict assessment compared to abundance method as plants are either present or absentand will be influenced by spatial variability in plant beds. It is also important to note thatsurvey resolution will affect detection rates and it is advisable to set one grid interval and
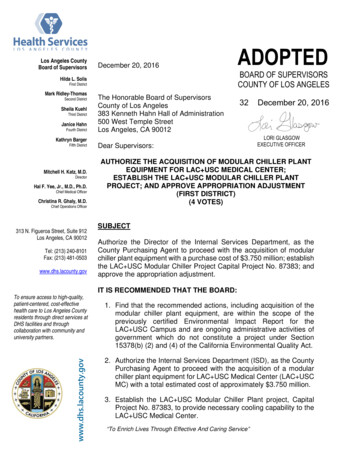
maintain that interval in successive years to make comparisons easier and moremeaningful. Also, a common misconception with this method is that data can beinterpreted as abundance; however sample points are a dimensionless unit so abundanceestimates are not possible.Estimating Cover and Distribution in Rivers. Riverine habitats are much harder to quantifysubmersed plant species characteristics due to flowing water and inaccessibility in manyareas. Submersed aquatic plants often grow in bands along the shoreline of rivers withdepth distribution limited by high flowsand unsuitable substrate. However, inlarger rivers transects have been effective inquantifying plant species cover andassessing management operations(Getsinger et al. 1997). In smaller rivers,line transects could be establishedperpendicular to the shoreline to runthrough the vegetation band towards themiddle of the river channel. Or, linetransects could be established parallel toFigure 2. Line transect sampling designs for aquatic plantthe shoreline to follow the contour of themonitoring and assessment in riverine habitats.vegetation bands, with transects evenlyspaced or in a stratified random design (Figure 2). In very small rivers or creeks, a linetransect could be established across the entire width of the channel, if flows permit, andspace transects in an appropriate sampling design.Estimating Abundance in Lakes. When plant abundance is important, biomass collectiontechniques offer the best data that is also species specific. There are a number of biomasscollection techniques and devices, and the appropriate technique should be chosen tomeet the objectives of the project, but also to adequately sample the target species. ThePVC coring device as developed by Madsen et al. (2007) works very well in samplingsubmersed aquatic plants, especially below ground reproductive structures. The PVC corercan be utilized in monitoring the abundance of native aquatic plants over time (Case andMadsen 2004, Wersal et al. 2006, Madsen et al. 2006), or non-native plant abundance insmall plots (Wersal et al. 2011). When using the PVC corer it is important to collect anadequate number of samples; we typically recommend 20-30 core samples per site. ThePVC corer does not sample emergent above ground biomass very well, especially tall plantspecies. Also, in dense beds of Eurasian watermilfoil and curlyleaf pondweed, care must betaken to ensure the coring device has cut through the vegetation and root crowns and hasbeen pushed deep enough into bottom sediments. Failure to do this will result in a lostsample and extra expenditures in labor. Owens et al. (2010) suggested that a box-corer(similar to an Eckman or Ponar dredge) may sample some species of submersed aquaticplants more effectively than the PVC coring device. However, the box-corer is large andcumbersome to operate and any benefit from using it can generally be overcome bycollecting more samples using a smaller area sampler such as the PVC corer.
Another abundance technique is for divers to set quadrats on the bottom of the lake.Sampling in this manner will allow for the collection of species specific presence/absence,species density, and biomass data. Research suggests that the diver quadrat method resultsin greater accuracy and precision with respect to abundance estimates than boat basedmethods (Capers 2000, Johnson and Newman 2011). In particular, small species and lessfrequent species are often underestimated using boat methods (Capers 2000). However, inwater methods (diver quadrat) incur more risk to perform, require special training (i.e.SCUBA), and a
year as the National Pollutant Discharge Elimination System (NPDES) permit program has been implemented to regulate aquatic plant management activities, most notably the use of herbicides. One of the requirements included in the federal NPDES pesticide general permit is for the quantitative assessment of nuisance plant coverage in order to document