Transcription
LOUISIANA PYS 2020-2023
CONTENTSLouisiana PYs 2020-2023. 1I. WIOA State Plan Type and Executive Summary . 3a. WIOA State Plan Type. 3Combined Plan Partner Program(s) . 3II. Strategic Elements . 3a. Economic, Workforce, and Workforce Development Activities Analysis . 3b. State Strategic Vision and Goals . 42c. State Strategy . 45III. Operational Planning Elements . 48a. State Strategy Implementation . 48b. State Operating Systems and Policies . 67IV. Coordination with State Plan Programs . 95V. Common Assurances (For All Core Programs). 95VI. Program-Specific Requirements for Core Programs . 96Program-specific Requirements for Adult, Dislocated Worker, and Youth Activities underTitle I-B . 96Program-Specific Requirements for Wagner-Peyser Program (Employment Services) . 126Program-specific Requirements for Adult Education and Family Literacy Act Programs . 145Program-Specific Requirements for Vocational Rehabilitation (Combined or General) . 164VII. Program-Specific Requirements for Combined State Plan Partner Programs . 230Temporary Assistance for Needy Families (TANF) . 230Employment and Training Programs Under the Supplemental Nutrition Assistance Program(Programs Authorized Under Section 6(d)(4) of the Food and Nutrition Act of 2008 (7 U.S.C.2015(d)(4))) . 240Jobs for Veterans’ State Grants . 254Senior Community Service Employment Program (SCSEP). 263Community Services Block Grant (CSBG) . 283Performance Indicator Appendix . 283All WIOA Core Programs . 283Additional Indicators of Performance . 284Other Appendices. 284Page 2
I. WIOA STATE PLAN TYPE AND EXECUTIVE SUMMARYA. WIOA STATE PLAN TYPEThis is a combined planCOMBINED PLAN PARTNER PROGRAM(S)Temporary Assistance for Needy Families program (42 U.S.C. 601 et seq.)Employment and Training programs under the Supplemental Nutrition Assistance Program(programs authorized under section 6(d)(4) of the Food and Nutrition Act of 2008 (7 U.S.C.2015(d)(4)))Jobs for Veterans State Grants Program (programs authorized under 38, U.S.C. 4100 et. seq.)Senior Community Service Employment program (programs authorized under title V of theOlder Americans Act of 1965 (42 U.S.C. 3056 et seq.))Community Services Block Grant (Employment and training activities carried out under theCommunity Services Block Grant Act (42 U.S.C. 9901 et seq.))II. STRATEGIC ELEMENTSA. ECONOMIC, WORKFORCE, AND WORKFORCE DEVELOPMENT ACTIVITIES ANALYSIS1. ECONOMIC AND WORKFORCE ANALYSISII. a. 1. A. Economic AnalysisIn 2019 Quarter 1, Louisiana’s Mining, Quarrying, and Oil and Gas Extraction industry accountedfor 4.4 percent of Louisiana’s 260.4 billion Gross Domestic Product (GDP), nearly three timesthe percentage of mining-related GDP nationally.Mining and Logging has lost 3,714 jobs from 2016 Q1, to 2019 Q1, a 9.6 percent decrease.Louisiana Workforce Commission’s (LWC) forecasts anticipate continued decline through 2026–with a projected loss of 1,599 jobs. Overall, Louisiana’s long-term outlook is encouraging. Thestate expects an 8.3 percent rise in employment - over 168,208 new jobs - through 2026.The Health Care and Social Assistance industry - a backbone of the state’s economy accountingfor 7.6 percent of Louisiana’s GDP in 2019 Quarter 1 - is the largest contributor to long termemployment growth, accounting for 20.2 percent of total forecasted new job growth through2026.Health Care and Social Assistance employment has grown 3.5 percent from 2016 Q1 to 2019 Q1.Health Care and Social Assistance accounted for 16 percent of Louisiana’s total employment in2019 Q1, and the industry is further highlighted in Existing Demand Industry Sectors andOccupations below.Louisiana’s seasonally adjusted unemployment rate has continued to decline, reaching 4.3percent in June 2019. Labor force participation declined drastically in 2015 and 2016 but hasstabilized, reaching 58.6 percent in June 2019.Louisiana is home to eight Regional Labor Market Areas (RLMAs). Positive employment growthis projected for all RLMAs through 2026. Below are the employment highlights the eightregions:Page 3
RLMA 1: New Orleans-Louisiana’s largest by nonfarm employment.o RLMA 2: Baton Rougeo Anticipates 5.1% projected growth through 2026. Three industries thatanticipate the most growth are: Health Care and Social Assistance (9.0%projected increase); Construction (8.1% projected increase); andAccommodation and Food Services (7.6% projected increase).RLMA 7: Shreveporto Anticipates 13% projected growth through 2026. Three industries thatanticipate the most growth are: Construction (26.1% projected increase);Professional, Scientific, and Technical Services (25.8% projected increase); andHealth Care and Social Assistance (15.6% projected increase).RLMA 6: Alexandriao Anticipates 6.0% projected growth through 2026. Three industries thatanticipate the most growth are: Professional, Scientific, and Technical Services(12% projected increase); Health Care and Social Assistance (10.3% projectedincrease); and Construction (10% projected increase).RLMA 5: Lake Charles- Anticipates the highest projected growth in the state.o Anticipates 5.8% projected growth through 2026. Three industries thatanticipate the most growth are Accommodation and Food Services (11.1%projected increase); Construction (10.6% projected increase); and Health Careand Social Assistance (10.1 % increase).RLMA 4: Lafayetteo Anticipates 10.1% projected growth through 2026. Three industries thatanticipate the most growth are Professional, Scientific, and Technical Services(20.2% projected increase); Administrative and Waste Services (16.7%projected increase); and Accommodation and Food Services (14.8% projectedincrease).RLMA 3: Houmao Anticipates 8.2% projected growth through 2026. Three industries thatanticipate the most growth are Professional, Scientific, and Technical Services(14.9% projected increase); Health Care and Social Assistance (11.9% projectedincrease); and Accommodation and Food Services (11.5%increase).Anticipates 6.8% growth through 2026. Three industries that anticipate themost growth are: Accommodation and Food Services (15.4% projectedincrease); Administrative and Waste Services (9.8% projected increase), andHealth Care and Social Assistance (8.8% projected increase).RLMA 8: MonroeoAnticipates 8% growth through 2026. Three industries that anticipate the mostgrowth are: Administrative and Waste Services (17.9% projected increase);Page 4
Health Care and Social Assistance (13.2% increase); and Accommodation andFood Services (12.6% projected increase).The Louisiana Workforce Commission’s Louisiana Occupational Information System (LOIS), isthe state’s Virtual Labor Market Information Web Portal. This interactive site provides userswith access to the latest Louisiana labor force, wages, population, industry employment,training schools, training programs, report for completion rates, projections, demographics,nonfarm employment, employer database, unemployment claimants, industry staffing patterns,licensed occupations, demand occupations, and career products. The LMI tables and charts andfigures that follow provide projections for Louisiana’s long-term industry growth.Sources: The preceding section cited data from the Bureau of Economic Analysis, the CurrentEmployment Statistics Program, the Local Area Unemployment Statistics Program, and LWCLong Term Industry Projections.(i) EXISTING DEMAND INDUSTRY SECTORS AND OCCUPATIONS[1]Louisiana’s long-term employment projections suggest 8.3 percent growth in employment by2026 in comparison to the projected growth rate of the United States of 6.6 percent.Table 1 shows long term growth for the state and the RLMAs. The RLMA 5: Lake Charles,anticipates the fastest growth in the long term, followed by RLMA 2: Baton Rouge.RLMA Region2016 Employment2026 ForecastLong Term Growth0Statewide2,034,9862,203,1948.3%1New Orleans585,916633,9998.2%2Baton fayette270,015286,3216.0%5Lake ,3628.0%Table 2 highlights the ten industry subsectors contributing the most new jobs in Louisianathrough 2026. Food Services and Drinking Places is expected to add the most jobs followed byAmbulatory Health Care Services and Professional and Technical astEmploymentGrowthPercentGrowthFood Services anddrinking places722168,112188,77120,65912.3%Ambulatory health care 621services99,067115,13916,07216.2%Professional andtechnical services86,609100,82514,21616.4%541Page 5
mentGrowthPercentGrowthEducational Services611164,798175,89911,1016.7%Administrative andsupport services56190,918101,62210,70411.8%Self-employed workers 7,6177.3%Social assistance62444,53550,9266,39114.4%Specialty tradecontractors23865,70071,3345,6348.6%General merchandisestores45255,37760,7315,3549.7%*North American Industry Classification SystemHigh ranking occupations are those with three, four, or five star rankings as determined by theLouisiana Workforce Commission. LWC’s star ratings system takes into account wages, jobopenings, employment, and projected growth for over six hundred occupations, both statewideand regionally. Table 3 shows the highest rated occupations contributing the most employmentgrowth in Louisiana.Star Rating Occupational Title20162026Annual 2018 AnnualEstimate Projected New Jobs AverageWage*****Registered Nurses44,62050,700610 63,973***Laborers and Freight, Stock, andMaterial Movers, Hand45,62049,910430 27,675*****General and Operations Managers 29,69032,930320 115,059****Maintenance and Repair Workers, 26,980General29,760280 36,761****First-Line Supervisors of RetailSales Workers27,57029,910230 39,169****Construction Laborers21,59023,920230 35,120***First-Line Supervisors of Food17,330Preparation and Serving Workers19,510220 32,363****Heavy and Tractor-Trailer TruckDrivers25,00027,090210 42,088****Light Truck or Delivery ServicesDrivers15,82017,900210 32,929Page 6
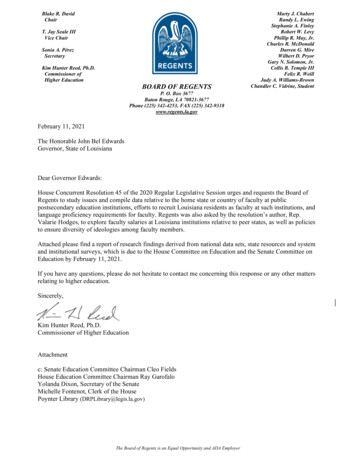
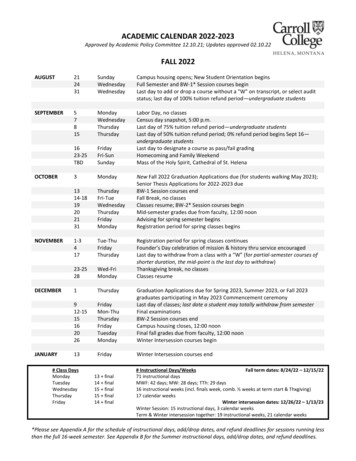
Star Rating Occupational Title20162026Annual 2018 AnnualEstimate Projected New Jobs AverageWage*****Carpenters18,23020,200200 45,909*****Elementary School Teachers,Except Special Education22,54024,160160 48,739***Customer Service Representatives 21,57023,070150 32,440*****Welders, Cutters, Solderers, andBrazers15,90017,380150 52,812*****Sales Representatives, Wholesale 23,580and Manufacturing, ExceptTechnical and Scientific Products24,900130 60,362*****First-Line Supervisors ofConstruction Trades andExtraction Workers13,20014,480130 66,034*****Accountants and Auditors12,05013,270120 66,860*****Plumbers, Pipefitters, andSteamfitters11,19012,390120 54,935*****Construction Managers5,3206,490120 99,609****First-Line Supervisors of Officeand Administrative SupportWorkers20,78021,860110 49,356***Medical Assistants5,6706,690100 28,7(ii) EMERGING DEMAND INDUSTRY SECTORS AND OCCUPATIONS[2]Figure 1: 2026 Industry Projections for Louisiana, Two-Digit NAICS: Top 10Page 7
Figure 1 provides employment growth projections on the 10 industries expected to experiencethe greatest growth by 2026. The highest growth occupation according to these projections willbe Professional, Scientific, and Technical Services. The Professional, Scientific, and TechnicalServices sector employs workers with a high degree of expertise and training. Theestablishments in this sector perform activities such as: legal advice and representation;accounting, bookkeeping, and payroll services; architectural, engineering, and specializeddesign services; computer services; consulting services; research services; advertising services;photographic services; translation and interpretation services; veterinary services; and otherprofessional, scientific, and technical services. Table 4 echoes these results.Industry SectorEmployment GrowthPercent GrowthProfessional, Scientific, and Technical Services14,21616.4%Accommodation and Food Services24,59312.2%Health Care and Social Assistance33,98811.7%Administrative and Waste Services11,43411.4%Management of Companies and 2,1178.6%Arts, Entertainment and Recreation2,4088.2%Transportation and Warehousing6,6388.1%Other Services, Except Public Administration12,9408.0%Page 8
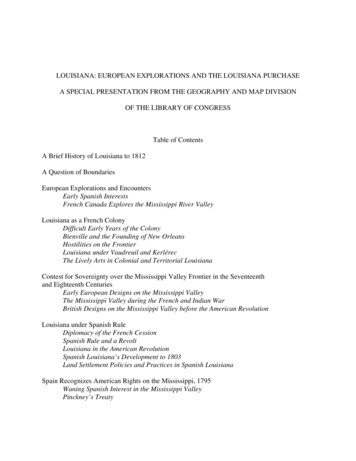
StarRatingOccupationCodeOccupation TitleGrowthRate*39-9021Personal Care Aides29.2%*35-3021Combined Food Preparation and Serving Workers,Including Fast Food21.2%**35-2014Cooks, Restaurant16.0%*****29-1141Registered Nurses13.6%****53-3033Light Truck or Delivery Services Drivers13.1%**37-3011Landscaping and Groundskeeping Workers12.8%***35-1012First-Line Supervisors of Food Preparation and Serving 12.6%Workers**37-2012Maids and Housekeeping Cleaners**37-2011Janitors and Cleaners, Except Maids and Housekeeping 11.8%Cleaners*35-2021Food Preparation Workers11.8%11.7%Figure 2: Projected Employment through 2026 in the Health Care and Social AssistanceIndustryFueled by the aging of the baby boomers, the Health Care and Social Assistance Industry isprojected to grow by 33,988 between 2016 and 2026. This growth is broken down further intothe subsectors within the Social Assistance Industry: Ambulatory health care services, Hospitals,Nursing and residential care facilities, and social assistance industries. Over two thirds of theindustry’s new job growth is attributable to employment in Ambulatory health care services andHospitals.(iii) EMPLOYERS’ EMPLOYMENT NEEDSPage 9
Louisiana has a focus on three industries - Health Care and Social Assistance, Transportationand Warehousing, and Professional, Scientific, and Technical Services. Below are employment,wage, and projections data for each industry.Industry SectorEstablishments Employment Average Weekly WageTotal, All Industries134,8161,917,345 954Health Care and Social Assistance14,856306,409 843Transportation & Warehousing4,94483,433 1,13592,994 1,307Professional and Technical Services 16,541Source: 2019 Quarter 1 Quarterly Census of Employment and WagesIndustry Sector2016Employment2026 ProjectedEmploymentLong Term ProjectedGrowthTotal, All Industries2,034,9862,203,1948.3%Health Care and SocialAssistance289,924323,91211.7%Transportation al and Technical 86,609ServicesSource: Louisiana Workforce Commission Long Term Industry ProjectionsTransportation & Warehousing2016EmploymentAnnual TotalOpeningsLaborers and Freight, Stock, and Material Movers,Hand45,6206,890Heavy and Tractor-Trailer Truck Drivers25,0002,960Light Truck or Delivery Services Drivers15,8201,950Bus Drivers, School or Special Client8,030980Captains, Mates, and Pilots of Water Vessels7,380820Source: LWC Long Term Staffing PatternsHealth Care and Social Assistance2016 Employment Annual Total OpeningsRegistered Nurses44,6203,010Nursing Assistants23,5102,990Licensed Practical and Licensed Vocational Nurses 21,0501,560Home Health Aides8,3501,400Physicians and Surgeons, All Other6,350210Source: LWC Long Term Staffing PatternsPage 10
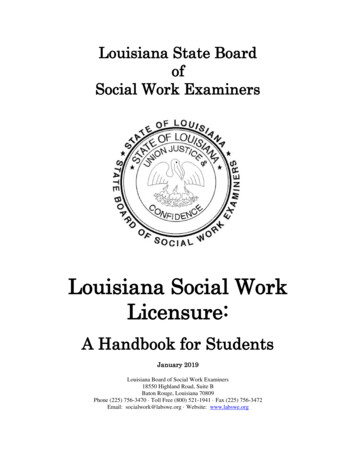
Professional, Scientific, and Technical Services 2016EmploymentAnnual TotalOpeningsBusiness Operations Specialists, All Other15,9801,690Accountants and Auditors12,0501,230Management Analysts4,070430Market Research Analysts and MarketingSpecialists2,440320Loan Officers3,690360Source: LWC Long Term Staffing Patterns[2] Louisiana Workforce Commission Short Term and Long Term Industry and OccupationalProjections[1] Louisiana Workforce Commission Long Term Industry and Occupational Projections(i) Employment and UnemploymentFigure 3: Total Nonfarm Employment, Seasonally Adjusted, LA (January 2009- June 2019)Source: Current Employment Statistics (CES) Program.According to the Current Employment Statistics survey, Louisiana nonfarm employment grewfrom 1,974,100 in January 2018 to 1,981,000 in June 2019, which is a 0.3 percent increase.Driven by strong demand from employers, Louisiana’s total nonfarm employment has risensteadily since 2010. That trend reversed through 2015 and 2016, although gains in employmenthave been posted in the recent year.Figure 4: Total Covered Employment for Selected Industries, LA: 2016 Q1 to 2019 Q1Page 11
Source: Quarterly Census on Employment and Wages (QCEW) Program.Figure 5: Over the Year (OTY) Change in Total Nonfarm and Private Sector JobsSeasonally Adjusted (SA), LA: January 2017 to June 2019Source: Current Employment Statistics (CES) programFigure 6: Year over Year Change in Total Government Jobs (SA): January 2017 to June2019Page 12
Source: Current Employment Statistics (CES) programFigure 7: United States and Louisiana Unemployment Rates: January 2009 to June 2019Source: Labor Force data produced by the Local Area Unemployment Statistics (LAUS) andCurrent Population Survey (CPS) ProgramsPage 13
Between January 2009 and June 2019 Louisiana’s unemployment decreased from 6.1 to 4.3percent. During this time the number of unemployed persons decreased from 126,727 to 90,492and the civilian labor force increased from 2,088,301 to 2,097,545.Figure 8: Initial Weekly UI Claims: January 2016 to June 2019Source: Weekly Unemployment Claims produced by Louisiana Workforce Commission.Figure 8: The above chart represents initial unemployment insurance claims by for each weekduring January 2016 to June 2019. There were 253 fewer initial claims made in the last week ofJune 2019 compared to the last week of January 2016.Figure 9: Continued Weekly UI Claims: January 2016 to June 2019Page 14
Source: Weekly Unemployment Claims produced by Louisiana Workforce CommissionLouisiana’s number of continued claimants showed a downward trend between January 2016and June 2019. There were 7,042 fewer continued claims made in the last week of June 2019compared to the last week of January 2016.Worker Profiling and Reemployment Services (WPRS) ModelChanges to the U.S. economy—including the contraction of entire industries as a result ofchanges in technology and overseas competition—have led to increases in the length ofunemployment. Unemployed workers are now less likely to be rehired by their previousemployers and are at a greater risk of long-term unemployment than in the past. As a result, theWorker Profiling and Reemployment Services (WPRS) system was established nationwidefollowing the 1993 enactment of PL 103-152. Profiling is designed to identify UI claimants whoare most likely to exhaust their regular benefits, so that they may receive reemploymentservices that will help them find a job more quickly.Louisiana Workforce Commission’s Labor Market Information developed a model for profilingall new claimants for regular UI benefits. The WPRS system strengthens the link betweenUnemployment insurance and Employment Services for those most likely to exhaust benefits.The worker profiling model for Louisiana helps us achieve the objectives of reducing the weeksof UI benefits, reducing UI benefits per beneficiary, increasing earnings per beneficiary, andproviding a management tool for targeting resources and aiding staff in understanding thecustomers they serve.(ii) Labor Market TrendsFigure 10: National and State Labor Force Participation Rate: January 2009 to June 2019Page 15
Source: Labor Force data produced by the Local Area Unemployment Statistics (LAUS) andCurrent Population Survey (CPS) Programs.In January 2009, Louisiana’s labor force participation rate was 3.8 percentage points below thenational average. In June 2019, the state participation rate was 4.3 percentage points below thenational average after experiencing a large decline in 2015.Figure 11: Labor Force Participation Rate and Unemployment Rate in Louisiana (January2013- December 2017)Source: Labor Force data produced by the Local Area Unemployment Statistics (LAUS) Program.Page 16
Figure 12: Labor Force Participation Rate and Unemployment Rate in United States(January 2013- December 2017)Source: Labor Force data produced by the Local Area Unemployment Statistics (LAUS) Program.Figures 11 and 12 above show the unemployment rate and labor force participation rate fromJanuary 2009 to June 2019. Louisiana and the United States labor markets experienced differentrecovery trajectories from the Great Recession. Additionally, natural disasters and oil pricevolatility had disproportionate impacts on the Louisiana labor market. It is encouraging that inrecent months Louisiana has experienced both a decline in the unemployment rate and stabilityin the labor force participation rate.RaceBlackGenderWhiteFemaleMaleCivilian Non-Institutional Population1,508,234 3,002,517 2,391,519 2,292,814Percent of Population32.2%64.1%51.1%48.9%Civilian Labor Force Participation Rate41.9%47.4%42.9%47.3%Civilian Labor Force631,4931,423,048 1,027,150 1,085,170Percent of Labor Force29.9%67.4%Total Employment567,0881,355,777 963,2921,040,711Total ce: Current Population Survey (CPS) conducted by the Local Area Unemployment Statistics(LAUS) program.Page 17
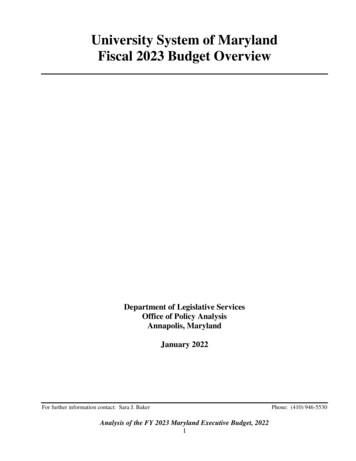
The Current Population Survey (CPS) provides estimates of the composition of the Civilian NonInstitutional Labor Force. The labor force is all individuals over the age of 16 that are employedor unemployed and actively seeking a job. The chart above provides some information on howdifferent ethnic groups and genders are represented in Louisiana’s workforce. From thisinformation, the proportion of each race in the labor force is approximately equal to theproportion of the race of the population. By gender, males comprise a larger proportion of thelabor force than the total population.TotalAgeSex16 to 24Year25 to54 Years55years MenWomenTotal not in the labor force1,485,000 259,675374,675850,700 606,825 878,025Do not want a job now1,396,250 231,175333,275831,825 566,450 829,650Want a job88,80028,47541,40018,87540,375 48,425Did not search for workin previous year49,45015,75021,25012,47524,325 25,100Searched for work in previousyear39,35012,75020,1756,40016,050 23,300Not available to work now9,1253,6004,5001,0502,850Available to work now30,2009,17515,6755,37513,200 17,025Discouragement over jobprospects11,1752,3005,7753,1005,5505,625Reasons other 6,200Reason not currently looking:Figure 13: Statewide Household Income Distribution, 2018Page 18
Source: U.S. Census American Community Survey 2018 1-year estimates, Table S1901(iii) Education and Skill Levels of the WorkforcePopulation 18 to 24 yearsPercentLess than high school graduate16.7%High school graduate (includes equivalency)35.5%Some college or Associate's degree40.4%Bachelor's degree or higher7.4%Source: U.S. Census American Community Survey 2018 1-year estimates, Table S1501Tables 13 and 14 highlight the educational achievements of Louisiana’s population. Table 13looks at a younger cohort, aged 18 to 24, who may still be in postsecondary education. Theirrelative age likely accounts for the low percentage of Bachelor’s degree or higher completers,and the high percentage of ‘some college or associate’s degree’ completers.Table 14 studies the population above age 24, which is more likely to have left the educationalsystem. More than half of Louisiana’s adult population has completed some college courseworkor graduated from a secondary institution.Population 25 years and overPercentLess than high school graduate14.2%High school graduate (includes equivalency)34.3%Some college, no degree20.8%Associate's degree6.5%Page 19
Population 25 years and overPercentBachelor's degree15.9%Graduate or professional degree8.4%Source: U.S. Census American Community Survey 2018 1-year estimates, Table S1501Disability CharacteristicEmployedUnemployedNot in Labor ForceWith a hearing difficulty25.9%8.5%15.1%With a vision difficulty30.0%29.9%21.0%With a cognitive difficulty32.6%51.2%47.3%With an ambulatory difficulty30.5%26.3%56.7%With a self-care difficulty7.3%5.7%24.0%With an independent living difficulty14.5%24.4%46.4%*Disabilities are not mutually exclusiveSource: U.S. Census American Community Survey 2018 1-year estimates, Table B18120In Louisiana, 6.5 percent of the employed population aged 18 to 64 lives with one or moredisabilities. Residents with disabilities account for 15 percent of the unemployed and 31percent of those not in the labor force.Table 15 highlights the rates at which various disability characteristics appear in the employed,unemployed, and not in the labor force populations. Disability characteristics are not mutuallyexclusive, meaning one individual may have multiple difficulties, accounting for the highpercentages.Labor Force StatusPercentPopulation4.5%Labor Force Participation Rate77.0%Employed96.1%Unemployed3.9%Not in Labor Force23.0%Source: U.S. Census American Community Survey 2018 1-year estimates, Table C21005Table 16 breaks out the labor force status of Louisiana veterans aged 18 to 64. Veterans inLouisiana have a fairly high labor force participation rate, with 77 percent of those aged 18 to64 are in the labor force. Veterans account for 4.5 percent of Louisiana’s population and only 3.9percent of veterans are unemployed.Table 17 compares incarceration rates statewide and nationally. Louisiana has the highestincarceration rate in the nation, with 762 of every 100,000 residents behind bars in 2016. 99.9percent of those incarcerated have sentences in excess of one year.[3]Page 20
JurisdictionImprisonment RateTotal Prison PopulationNational Statistics (US Total)4401,489,363Louisiana71933,739Source: U.S. Department of Justice - Bureau of Justice Statistics: Prisoners in 2017, Table 6According to the Bureau of Justice Statistics, Louisiana had the highest imprisonment rateamong the 50 states but the total prison population in Louisiana was only 2.3 percent of thenation’s entire prison population.[3] Bureau of Justice Statistics Corrections Statistical Analysis Tool(iv) Skill GapsDegree Level201620172018Some Postsecondary, No Degree8,8029,23811,876 62,410Associate Degree5,8005,7825,961Baccalaureate Degree18,973 19,031 19,532 23,490Graduate or Professional Degree6,9977,1528,080Annual Projected Openings14,0005,880Source: Annual Projected Openings from LWC’s Long Term Occupational Projections. LouisianaBoard of Regents Degrees and Certificates Awarded by Degree, Degree Level, Gender, Race, andCitizenship.Table 18 shows the number of completers from Louisiana’s public postsecondary educationprograms by degree level for academic years 2016 through 2018.The completer data are compared to the number of annual openings from LWC’s long-termprojections, which provide an approximation of what skill levels may show gaps in the future.Below is further breakdown of degrees awarded by occupational category. The samecomparison is drawn between 2018 academic year graduates and annual projected jobopenings through 2026. The annual projected openings are for occupations that typicallyrequire completion of a post-secondary program.Degree Category2016CompletersAnnual ProjectedOpeningsHealth Professions7,91314,990Business, Managemen
In 2019 Quarter 1, Louisiana's Mining, Quarrying, and Oil and Gas Extraction industry accounted for 4.4 percent of Louisiana's 260.4 billion Gross Domestic Product (GDP), nearly three times the percentage of mining-related GDP nationally. Louisiana Workforce Commission's (LWC) forecasts anticipate continued decline through 2026-