Transcription
CMIP5 data provided at theIPCC Data Distribution CentreSeita Emori, Karl Taylor, Bruce Hewitson, Fernanda Zermoglio,Martin Juckes, Michael Lautenschlager and Martina StockhauseVersion 1, September 2016Executive SummaryThis TGICA Fact Sheet introduces a multi-climate model dataset based on the fifth phase of the Coupled ModelIntercomparison Project (CMIP5) archived at the Intergovernmental Panel on Climate Change (IPCC) Data DistributionCentre (DDC). Parts of the CMIP5 multi-model dataset were used in the Fifth Assessment Report (AR5) of the IPCC.The dataset has been analyzed by the scientific community worldwide and continues to be available for studying climate,its variability and change, and the societal and environmental implications of climate change in terms of impacts,adaptation and vulnerability. The document points to the different experiments for which data have been archived at theIPCC DDC as well as offering links to sources of more information and guidance on accessing the data. Its primarytarget audience is the climate change research community, especially those researchers engaged in accessing,interpreting and applying climate and related data and scenarios in studies of climate change vulnerability, impacts andadaptation.Document historyThis document, CMIP5 data provided at the IPCC Data Distribution Centre, constitutes "Supporting material" of theIntergovernmental Panel on Climate Change (as defined in the Procedures for the Preparation, Review, Acceptance, Adoption,Approval, and Publication of IPCC Reports). The Fact Sheet was prepared by the IPCC Task Group on Data and ScenarioSupport for Impacts and Climate Analysis (TGICA).This supporting material has not been subject to the formal intergovernmental IPCC review process. Instead, the document wasmade available for expert review following TGICA procedures (http://www.ipcc-data.org/docs/fact sheets process documentOct2011.pdf) for 2! weeks in January 2016, with review comments received from eight international experts: S. Fronzek(Finland), X. Gao (China), K. Gotangco (Philippines), D. Jacob (Germany), K. Hennessy (Australia), R. Knutti (Switzerland), K.Vincent (South Africa) and P. Whetton (Australia), and from four members of TGICA: R. Warren (UK), A. Webb (Fiji), C.Pascoe (UK) and G.-K. Plattner (Switzerland). The authors finalized revisions of the document during the 24th meeting of TGICAin Helsinki (July 2016) and submitted a Second-Order draft together with responses to reviewer comments to the processingeditor (Timothy Carter) in September 2016. These revisions were endorsed, subject to minor editorial suggestions, and a proofcopy was distributed to TGICA members for approval and any final comments. It was approved on 19 September 2016.This document should be referenced as:Emori, S., Taylor, K., Hewitson, B., Zermoglio, F., Juckes, M., Lautenschlager, M. and Stockhause, M. 2016: CMIP5 dataprovided at the IPCC Data Distribution Centre. Fact Sheet of the Task Group on Data and Scenario Support for Impact andClimate Analysis (TGICA) of the Intergovernmental Panel on Climate Change (IPCC), 8 pp.This Fact Sheet is an agreed product of the IPCC Task Group on Data and Scenario Support for Impacts and Climate Analysis (TGICA). Themandate of the TGICA is agreed in advance as part of the IPCC work plan, but this does not imply Working Group or Panel endorsement orapproval of documents emanating from the Task Group or any recommendations or conclusions contained herein. This is Supporting materialprepared for consideration by the Intergovernmental Panel on Climate Change and has not been subjected to formal IPCC review processes.
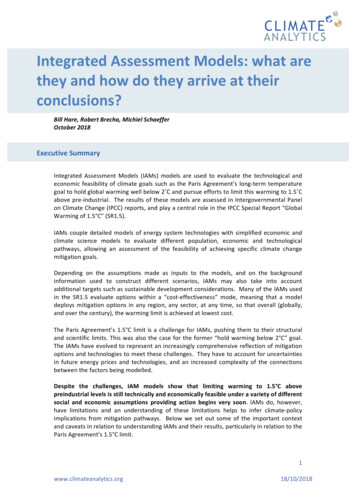
CMIP5 data provided at the IPCC Data Distribution CentreSeita Emori1, Karl Taylor2, Bruce Hewitson3, Fernanda Zermoglio4,Martin Juckes5, Michael Lautenschlager6, Martina Stockhause61. What is the CMIP5 dataset?The fifth phase of the Coupled Model Intercomparison Project (CMIP5) coordinated by the World Climate ResearchProgram (WCRP) has produced a multi-model dataset designed to advance our knowledge of climate, its variability andchange through the application of global models of the climate system (Taylor et al. 2012). CMIP5 notably provides amulti-model context for: 1) assessing the mechanisms responsible for model differences in poorly understood feedbacksassociated with the carbon cycle and with clouds, 2) examining climate “predictability” and exploring the predictivecapabilities of forecast systems on decadal time scales, 3) more generally, determining why similarly forced modelsproduce a range of responses, and 4) supplying sample climate futures arising from a range of forcing scenarios thatspan uncertainties in future climate for application in impact, adaptation and vulnerability studies. The dataset has beenanalyzed by the scientific community worldwide to produce the results that underlay the IPCC Fifth Assessment Report(AR5; IPCC, 2013) and continues to be available for further analyses.2. The CMIP5 experiments.The CMIP5 strategy (Hibbard et al. 2007; Meehl and Hibbard 2007) includes two types of climate change modelingexperiments: 1) long-term (century time scale) simulations and 2) near-term simulations (10–30 yr), also called decadalprediction experiments (Meehl et al. 2009). The long-term simulations are usually started from multi-centurypre-industrial control (quasi equilibrium) simulations, whereas the decadal prediction experiments are initialized withobserved recent ocean and sea ice conditions.Both the long- and near-term experiments are conducted using atmosphere–ocean global climate models (AOGCMs),the “standard” models used in previous CMIP phases. The previous exercise was CMIP3 (Meehl et al., 2007), which wasanalyzed extensively in the IPCC AR4 (IPCC, 2007) and from which data are available at the IPCC Data DistributionCentre (DDC). Note that there was no CMIP4; the choice to move to CMIP5 was designed to align the numbering withthe IPCC AR5 (Figure 1). The AOGCMs respond to specified, time-varying concentrations of various atmosphericconstituents (e.g., greenhouse gases) and include interactive representations of atmosphere, ocean, land, and sea ice.For the long-term simulations, some of the AOGCMs were, for the first time in CMIP, coupled to biogeochemicalcomponents that account for the important fluxes of carbon between the ocean, atmosphere, and terrestrial biospherecarbon reservoirs, thereby including a comprehensive representation of the carbon cycle in the model. These models arecalled Earth system models (ESMs), and have the capability of using time-evolving emissions of constituents from whichconcentrations can be computed interactively. The ESMs may in some cases also include interactive prognostic aerosol,chemistry, and dynamical vegetation components.1Center for Global Environmental Research, National Institute for Environmental Studies, Tsukuba, Japan2Program for Climate Model Diagnosis and Intercomparison, Lawrence Livermore National Laboratory, CA, USA3Climate System Analysis Group, University of Cape Town, South Africa4Chemonics International, Chile5Centre for Environmental Data Analysis (CEDA), STFC Rutherford Appleton Laboratory, Harwell Oxford, UK6Deutsches Klimarechenzentrum (DKRZ), Hamburg, Germany2
Figure 1. History of CMIPs and their contributions to IPCC Assessment Reports (ARs). Note that there was no CMIP4. As an initialattempt, CMIP1 only contains “control” (constant external conditions) simulations and contributed to the Third Assessment Report(TAR) through model evaluation together with CMIP2. The year given is the publication year of the Working Group I contribution toeach Assessment Report.Individual groups have chosen to perform either the long-term or the near-term experiments with either AOGCMs orESMs, or they have done various combinations of each. Some groups have performed simulations with a higherresolution (20-50 km) than is typical for AOGCMs or ESMs (100-200 km). With these models, computer resources maybe insufficient to allow fully coupled simulations, so CMIP5 includes an option to perform so-called time-slice simulationsof both the present-day climate [essentially following the Atmospheric Model Intercomparison Project (AMIP) protocolfirst described by Gates (1992)] and the future climate (in particular, the decade 2026–35, which allows for directcomparison with the fully coupled experiments). In time-slice simulations of the future, projected changes in sea surfacetemperature (SST) and sea ice are obtained from a prior simulation of a fully coupled AOGCM.CMIP5 experiments build on the CMIP3 experiments but include additional simulations to provide a more completeunderstanding of climate change and variability. In CMIP5 a new set of future greenhouse gas, aerosol and land usescenarios called Representative Concentration Pathways (RCPs; van Vuuren et al., 2011)7 are used while in CMIP3,SRES scenarios (IPCC, 2000) were used8.The CMIP5 decadal prediction experiments are a new addition to CMIP and are considered more exploratory in nature.In the decadal prediction simulations the models will not only respond to RCP forcings9 but can also potentially track thenatural variability of the real-world climate system to some degree. Decadal predictions require sophisticated postprocessing, such as complex bias correction (Taylor et al., 2012), and should not be used for impact assessmentswithout expert guidance.For detailed specifications of all the experiments, the reader is referred to the experiment design document (Taylor et al.2009), which can be obtained from the CMIP5 website pcc-data.org/ddc/ar5 scenario res/9“Forcings” in this context generally means external factors that affect the Earth’s climate. More specifically, it often means imposedperturbations of Earth’s energy balance.3
3. CMIP5 data at the DDCThe full CMIP5 archive, available through the portals supported by the Earth System Grid Federation (ESGF;https://pcmdi.llnl.gov/projects/cmip5/), has evolved through and beyond the IPCC Fifth Assessment process, withmodeling groups eager to contribute their best available data to the research community. The IPCC DDC providesaccess to two snapshots of the CMIP5 archive in the World Data Center for Climate (WDCC):(i)the IPCC Working Group I snapshot(http://www.ipcc-data.org/sim/gcm monthly/AR5/WG1-Archive.html),and(ii) the DDC Reference snapshot(http://www.ipcc-data.org/sim/gcm monthly/AR5/Reference-Archive.html).The IPCC WGI snapshot was collected at ETH Zurich to support the IPCC WGI AR5 assessment process, including theproduction of CMIP5-based figures in the WGI AR5. This dataset is a subset of the data in the full CMIP5 archive on 15March 2013 (the cutoff date for literature to be included in the WGI AR5), selected according to the requirements of WGIauthors. Since that time, some data in the full archive have been corrected or withdrawn, and additional data have beencontributed, while the data archived at the IPCC DDC remain unchanged. The latest data are available through theESGF website.In total 952 simulations provided by 58 models from 24 institutes are archived in the IPCC WGI snapshot. Only selectedvariables are provided at different frequencies: annual, monthly and daily. Detailed information about the simulationsdone for each experiment can be found at the ESGF website.The DDC Reference snapshot was collected by the World Data Center for Climate (WDCC) at the German ClimateComputing Center (DKRZ), the Centre for Environmental Data Analysis (CEDA) in the UK and the Program forClimate Model Diagnosis and Intercomparison (PCMDI) at the University of California in the USA. The DDC Referencesnapshot is more extensive than the IPCC WGI snapshot: It contains additional data that, while not directly referred toin the IPCC assessment, were analyzed and discussed in the scientific literature that forms the basis of theassessment and thus indirectly contributed to the IPCC AR5. The reference snapshot is also based on the status ofthe full CMIP5 data archive as of 15 March 2013.In total 1145 simulations provided by 60 models from 28 institutes are archived in the DDC Reference snapshot. Thefrequencies of provided data depend on variables: annual, monthly, daily, 6-hourly, 3-hourly and sub-hourly.Atmospheric fields at 6-hourly frequency, which can drive regional climate models as initial and boundary conditions toproduce downscaled climate information, are also available10.The experiments included in the two IPCC DDC archives are summarized in Figure 2. From a user perspective, incontrast to the full CMIP5 dataset at the ESGF portals, the two DDC snapshots provide a long-term data archivecontaining more detailed documentation, error mapping, contact and citation information as well as quality assurancefollowing best practices in data management.10Note that the DDC currently does not host data downscaled from the CMIP5 simulations. The website of the WCRP Co-ordinated DownscalingExperiment (CORDEX) provides links to such data at: http://www.cordex.org/4
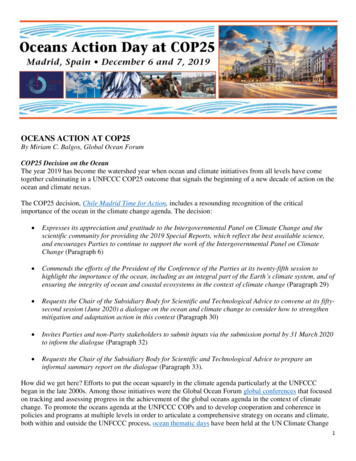
Figure 2. Summary of CMIP5 experiments included in the two archives in the IPCC DDC. Experiments available only at the DDCReference snapshot and those available at both the IPCC WGI and DDC Reference snapshots are indicated by green and pink colors,respectively. Paleo- climate, historical and future projection experiments are arranged along an approximate timeline on the horizontalaxis.4. Description of the CMIP5 experimentsBrief descriptions of the CMIP5 experiments that are available at the IPCC DDC are provided below. Experimentsavailable only at the DDC Reference archive and those available at both the IPCC WGI and DDC Reference snapshotsare indicated by green and pink colors, respectively (Figure 2).Coupled Model Long-Term Simulations piControl (Pre-industrial Control): Impose non-evolving, pre-industrial conditions, which may include prescribedatmospheric concentrations or non-evolving emissions of gases, aerosols or their precursors, as well as unperturbedland use. historical: Impose changing conditions (consistent with observations from 1850-2005), which may include:atmospheric composition due to both anthropogenic and volcanic influences, solar forcing, emissions orconcentrations of short-lived species and natural and anthropogenic aerosols or their precursors, as well as land use.5
historicalNat, GHG, Misc: Historical simulations but with Nat: natural forcing only; GHG: greenhouse gas forcingonly; Misc: other individual forcing agents or combinations of forcings. historicalExt (historical extension): Extension of the historical simulation to the year 2012.rcp26, rcp45, rcp60, rcp85: Future projections (2006-2100) forced by RCP2.6, 4.5, 6.0, and 8.5. RCPs(representative concentration pathways) approximately result in radiative forcings of 2.6, 4.5, 6.0 and 8.5 W m-2 atyear 2100 respectively, relative to pre-industrial conditions. esmControl (ESM pre-industrial control): Impose non-evolving pre-industrial conditions as in ‘piControl’ butemissions-forced (with atmospheric CO2 determined by the model itself). esmHistorical: Historical simulation as in ‘historical’ but emissions-forced (with atmospheric CO2 determined by themodel itself). esmrcp85: Future projection (2006-2100) forced by RCP8.5. As in ‘rcp85’ but emissions-forced (with atmosphericCO2 determined by the model itself). past1000 (Last millennium): Impose evolving conditions including solar variations and volcanic aerosols [consistentwith Paleoclimate Modeling Intercomparison Project (PMIP) requirements]. midHolocene: Impose Mid-Holocene (6 kyrs ago) conditions including relevant changes in the Earth’s orbitalparameters and atmospheric concentrations of well-mixed greenhouse gases (consistent with PMIP requirements). lgm (Last Glacial Maximum): Impose Last Glacial Maximum (21 kyrs ago) conditions including ice sheets andatmospheric concentrations of well-mixed greenhouse gases (consistent with PMIP requirements).Coupled Model Long-Term Idealized Simulations 1pctCO2 (1 percent per year CO2): Initialized from the ‘piControl’ and CO2 concentration is prescribed to increase at1%/yr. abrupt4xCO2: Impose an instantaneous quadrupling of atmospheric CO2 concentration (relative to pre-industrial)and then hold it fixed. esmFdbk1 (ESM Feedback 1): Impose conditions identical to ‘piControl’ but CO2 concentration increase of 1%/yr isimposed for radiation code. esmFdbk2 (ESM Feedback 2): Impose conditions identical to ‘piControl’ but historical followed by RCP4.5 rise inCO2 is imposed for radiation code. esmFixClim1 (ESM fixed climate 1): Impose conditions identical to ‘piControl’ but CO2 concentration increase of1%/yr is imposed for carbon cycle. esmFixClim2 (ESM fixed climate 2): Impose conditions identical to ‘piControl’, but historical followed by RCP4.5rise in CO2 is imposed for carbon cycle.Atmosphere-Only Simulations amip: As in the Atmospheric Model Intercomparison Project (AMIP), impose sea surface temperatures (SSTs) & seaice (from observations over 1979-at least 2008), but with other conditions (including CO2 concentrations andaerosols) as in ‘historical’. sstClim (control SST climatology): AMIP-style experiment with climatological SSTs and sea ice from ‘piControl’.sstClimAerosol (all aerosol forcing): AMIP-style experiment with climatological SSTs and sea ice from ‘piControl’(as in ‘sstClim’) but with aerosols consistent with conditions in year 2000 of the historical run.6
sstClimSulfate (sulfate aerosol forcing): AMIP-style experiment with climatological SSTs and sea ice from‘piControl’ (as in ‘sstClim’) but with sulfate aerosols consistent with conditions in year 2000 of the historicalsimulation. sst2030 (2030 time-slice): Simulation of a future decade covering the years 2026-2035, with prescribed SSTs andsea ice concentration anomalies relative to 'amip'. sstClim4xCO2: AMIP-style experiment with climatological SSTs and sea ice from ‘piControl’ (as in 'sstClim') butwith quadrupled CO2 imposed. amip4xCO2: Identical to ‘sstClim4xCO2’, but with AMIP SSTs prescribed as in ‘amip’.amip4K (AMIP plus 4K anomaly): Identical to ‘amip’, but with a uniform 4 K increase in SST (consistent with CloudFeedback Model Intercomparison Project (CFMIP) requirements). amipFuture (AMIP plus patterned anomaly): Add a patterned SST perturbation (provided by CFMIP based on‘1pctCO2') to the AMIP SSTs of ‘amip’ (consistent with CFMIP requirements). aquaControl (aqua planet control): Impose zonally uniform SSTs on a planet without continents (consistent withCFMIP requirements). aqua4xCO2: Impose quadrupled CO2 on zonally uniform SSTs of ‘aquaControl’ (consistent with CFMIPrequirements). aqua4K (aqua planet plus 4K anomaly): Identical to ‘aquaControl’, but with a uniform 4 K increase in SST.(consistent with CFMIP requirements)Coupled Model “Decadal” Prediction Experiments decadalXXXX (10-year simulation initialized in year XXXX, where XXXX denotes individual years from 1959 to2012): Decadal hindcast/prediction. Comparison of initialization strategies using an alternate initialization strategy oralternate initial data. noVolcXXXX (volcano-free hindcasts): Hindcast without volcanoes. 10-year simulation from year XXXX, whereXXXX is 5-yearly from 1960 to 2005, without including the Agung, El Chichon and Pinatubo eruptions. volcIn2010 (prediction with 2010 volcano): Pinatubo-like eruption imposed. Repeat of the ‘decadal2005’ forecastwith an imposed 'Pinatubo' eruption in 2010.7
ReferencesGates, W. L., 1992: AMIP: The Atmospheric Model Intercomparison Project. Bull. Amer. Meteor. Soc., 73, 1962–1970.Hibbard, K. A., G. A. Meehl, P. Cox, and P. Friedlingstein, 2007: A strategy for climate change stabilization experiments.Eos, Trans. Amer. Geophys. Union, 88, doi:10.1029/2007EO200002.IPCC, 2000: IPCC Special Report on Emissions Scenarios. Prepared by Working Group III of the IntergovernmentalPanel on Climate Change. Cambridge University Press, Cambridge, United Kingdom, and New York, NY, USA,570pp.IPCC, 2007: Climate Change 2007: The Physical Science Basis. Contribution of Working Group I to the FourthAssessment Report of the Intergovernmental Panel on Climate Change, Solomon, S. et al. (eds.), CambridgeUniversity Press, Cambridge, United Kingdom and New York, NY, USA, 996 pp.IPCC, 2013: Climate Change 2013: The Physical Science Basis. Contribution of Working Group I to the FifthAssessment Report of the Intergovernmental Panel on Climate Change, Stocker, T.F. et al. (eds.), CambridgeUniversity Press, Cambridge, United Kingdom and New York, NY, USA, 1535 pp, doi:10.1017/CBO9781107415324.Meehl, G.A. and Coauthors, 2007: The WCRP CMIP3 multimodel dataset: A new era in climate change research. Bull.Amer. Meteor. Soc., 88, 1383-1394, doi: 10.1175/BAMS-88-9-1383.Meehl, G. A., and K. A. Hibbard, 2007: A strategy for climate change stabilization experiments with AOGCMS and ESMS.WCRP Informal Rep. 3/2007, ICPO Publ. 112, IGBP Rep. 57, 35 pp.Meehl, G. A. and Coauthors, 2009: Decadal prediction: Can it be skillful? Bull. Amer. Meteor. Soc., 90, 1467–1485,doi:10.1175/2009BAMS2778.1.Taylor, K. E., R. J. Stouffer, and G. A. Meehl, 2009 (last updated in 2011): A summary of the CMIP5 experiment design.PCDMI Rep., 33 pp. [Available online at http://cmip-pcmdi.llnl.gov/cmip5/docs/Taylor CMIP5 design.pdf.]Taylor, K. E., R. J. Stouffer and G. A. Meehl, 2012: An overview of CMIP5 and the experiment design. Bull. Amer.Meteor. Soc., 93, 485-498, doi:10.1175/BAMS-D-11-00094.1.van Vuuren, D. P. and Coauthors, 2011: The representative concentration pathways: An overview. Clim. Change, 109,5–31, doi:10.1007/s10584-011-0148-z.8
analyzed extensively in the IPCC AR4 (IPCC, 2007) and from which data are available at the IPCC Data Distribution Centre (DDC). Note that there was no CMIP4; the choice to move to CMIP5 was designed to align the numbering with the IPCC AR5 (Figure 1). The AOGCMs respond to specified, time-varying concentrations of various atmospheric