Transcription
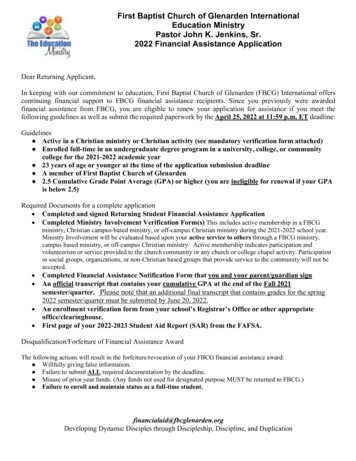
Economic Survey 2019/20Economic Growth Rate and Per Capita GDP Growth Rate (In percent)10.08.06.04.02.00.0-2.0Per Capita GDP Growth RateGDP Growth Rate (In Percent)Foreign Exchange Rate and Inflation RateGovernment Expenditure and Revenue (In Ratio of40.0Gross Domestic .040.04.020.02.00.00.00.0Government Expenditure40.0RevenueGrowth Rate of Export and Import (In Percent)Foreign Exchange Rate (NRS/US )Provincial Composition of Gross Domestic ProductSudurpaschimKarnali 7%4%30.0Province No.514%20.010.00.0Province No.116%Province No.214%Gandaki9%-10.0-20.0-30.0Inflation Rate (Right Axis)ExportImportGovernment of NepalMinistry of FinanceSingh Durbar, KathmanduBagmati36%
(Unofficial Translation)Economic Survey 2019/20Government of NepalMinistry of FinanceSingh Durbar, Kathmandu
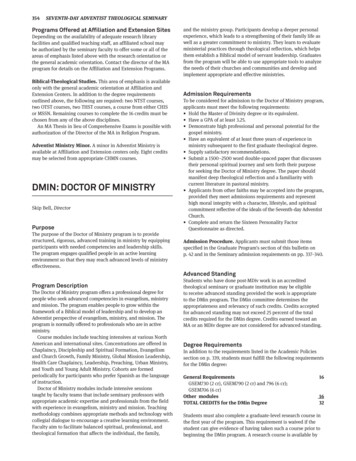
ForewordThis Economic Survey 2019/20 has been published incorporating details of economic activities,macroeconomic situation and major economic indicators and their analysis covering the first eightmonths of the fiscal year 2019/20.Macroeconomic indicators till mid-March of fiscal year 2019/20 have remained satisfactory.During this period, inflation rate, balance of payment position, foreign exchange reserves,investment and financial indicators are observed becoming favorable to economic stability. Due tocontraction in import and expansion in exports, there has been an improvement in trade deficit andbalance of payment situation is in surplus in this period. Financial services have expandedsignificantly and foreign investment has increased encouragingly.Towards the physical progress, consumption of electricity has gone up; import of electricity hasbeen remarkably reduced and even export of electricity has commenced. Satisfactory achievementhas been made in physical infrastructure development. Reconstruction has gained momentum andprojects of national pride require some additional efforts for speedy implementation.But, in recent times, due to the coronavirus pandemic and various measures taken to prevent andcontrol its outbreak, economic activities have been severely affected. Business and investmentenvironment has become riskier; and hence, economic growth is preliminarily assumed to be lowin current fiscal year. In coming days, it is necessary to move forward by focusing on the revivalof economic activities while making the lives of the citizens safe.I believe that this Survey would be useful to all those who want to be informed about the economicsituation of the nation. I would like to thank all employees of Ministry of Finance and other officesunder it for their involvement in the preparation of this publication and other officials andorganizations who have supported by providing necessary statistics and information.Thank you!May, 2020Dr. Yuba Raj KhatiwadaFinance Minister
Table of ContentsForewordList of TablesList of ChartsAbbreviationsExecutive Summary1. Overall Economic Situation12. Provincial Economic and Social Situation183. Public Finance214. Price435. Financial Sector456. External Sector557. Poverty Alleviation and Employment598. Agriculture, Forest and Land Reform679. Industry, Commerce, Supply and Tourism8510. Housing and Urban Development, Environment and Energy10311. Physical Infrastructure, Transport and Communication11012. Social Sector12313. Post-Earthquake Reconstruction14914. Administration and Good Governance15215. Coronavirus Prevention, Control, Treatment and Relief156Macroeconomic IndicatorsAnnexes
List of TablesSNTable 1(a):Global Economic Growth RateDescriptionsPage1Table 1(b):Economic Growth Rate of South Asian Countries and China2Table 1(c):Global Inflation3Table 1(d):Inflation in South Asian Nations and China3Table 2(a):Province-wise Social and Economic Indicators19Table 3(a):Fiscal Position of Federal Government22Table 3(b):Fiscal Indicators of Federal Government23T abl e3 (c):Functional Details of Federal Recurrent Expenditure27Table 3(d):Functional details of Federal Capital Expenditure27Table 3(e):Details of Individual and Business PAN Holders29Table 3(f):Government Income Structure29Table 3(g):Income Structure of Federal Government30Table 3(h):Ratio of Income, Revenue, Grants and Debt to Federal Government Expenditure31Table 3(i):Federal Revenue Structure Over the Last 3 Years31Table 3(j):Structure of Import Based Taxes and Internal Taxes32Table 3(k):Details of Revenue Collected in Federal Consolidated Fund and Divisible Fund32Table 3(l):Details of Revenue after Distribution33Table 3(m):Distribution of Royalties by mid-March of Fiscal Year 2019/2033Table 3(n):Outstanding Public Debt with Principal Repayment and Interest Expenses37Table 3(o):Inter-Governmental Fiscal-Transfer38Table 3(p):Trend of Capital Expenditure of Province Government39Table 3(q):Province-wise Budget and Status of Expenditure40Table 3(r):Collection in Provincial Consolidated Fund and Divisible Fund40Table 3(s):Expenditure Status of Local Levels41Table 3(t):Revenue Collection of Local Levels41Table 5(a):Major Indicators of Financial Sector Stability46Table 5(b):Province-wise Branches of Bank and Financial Institutions47Table 5(c):Annual Percentage Point Change of Major Monetary Aggregates48Table 5(d):Bank Rate, Refinancing Rate and Compulsory Reserve Ratio49Table 5(e):Status of Securities Dematerialization52Table 5(f):Investable Assets of Life and Non-Life Insurance Sectors52Table 5(g):Number of Life and Non-Life Insurers53Table 5(h):Status of Deposit and Credit Guarantee Fund54Table 6(a):Status of Remittances Inflow57Table 6(b):Status of Dividend Payment57Table 7(a):Poverty Related Key Indicators59Table 7(b):Key Employment Indicators as per Labor Survey60
SNTable 7(c):DescriptionsDetails of Employment Generated from Prime Minister Employment ProgramPage60Table 7(d):Implementation status of Terai-Madhes Prosperity Program61Table 7(e):Number of Foreign Nationals Given Work Permit62Table 7(f):Details of Labors in Foreign Employment with Work Permit63Table 7(g):Details of Manpower Companies licensed to Send Labor for Foreign Employment64Table 7(h):Country-wise Foreign Employment Status64Table 7(i):Number of Deaths During Foreign Employment and Details of Financial Support65Table 7(j):Details of Foreign Employment Related Service Recipients66Table 8(a):Commodities with Minimum Support Price68Table 8(b):Status of Agriculture Crops Production70Table 8(c):Province-wise Production Ratio of Major Food Crops During the Current Fiscal Year72Table 8(d):Per Head Meat and Eggs Availability75Table 8(e):Foundation Seeds Production and Release of Crop Varieties78Table 8(f):Status of Credit Services to Livestock and Vegetable Crops79Table 8(g):Province-wise Status of Forest Sector80Table 8(h):Local Level-wise Status of Forest Areas81Table 8(i):Numbers of Wildlives82Table 9(a):Details of Industry Registration86Table 9(b):Industry Registration and Investment as per Classification87Table 9(c):Details of Industries of Foreign Investment as per Industry Classification88Table 9(d):Country-wise Foreign Direct Investment89Table 9(e):Province-wise Details of Micro, Cottage and Small Industries90Table 9(f):Status of Ease of Doing Business of Nepal in the Last Four Years90Table 9(g):Details of Province-wise Registered Companies92Table 9(h):Details of Industrial Intellectual Property Rights93Table 9(i):Status of Petroleum Products ImportTable 9(j):Province-wise Royalty collected from Mountaineering100Table 10(a):Details of Province-wise Access to Electricity105Table 10(b):Total Hydropower Generation (MW)106Table 10(c):Hydropower Projects Completed During mid-March of 2019/20106Table 10(d):Status of Access to Electricity at Province and Local Levels107Table 10(e):Sectoral Power Consumption108Table 11(a):Road Expansion by Federal Government110Table 11(b):Status of Road Facility Expansion in Last Five Years110Table 11(c):Province-wise Details of Local Roads111Table 11(d):Details of Roads Constructed by Province and Local Level111Table 11(e):Local Road Expansion by Geographical Region112Table 11(f):Indicators Related to Civil Aviation114Table 11(g):Details of Railway Lines and Track Beds11598
SNTable 11(h):DescriptionsIndicators Related to Communication and Information TechnologyPage116Table 11(i):Number of Permits related to Audio-Visuals117Table 11(j):Details of Internet Users119Table 11(k):Total Number of Telephone Distribution119Table 11(l):Comparative Details of Registered Newspapers120Table 11(m):Details of Newspapers Registered by Language120Table 11(n):Electronic Signature (Token)121Table 12(a):Indicators of Educational Achievements123Table 12(b):Province-wise Details of Different Level of Schools127Table 12(c):Details of Schools According to Their Types128Table 12(d):Grade-wise School, Student and Teacher Ratio128Table 12(e):Details of Community and Institutional School Teachers128Table 12(f):School-wise and Level-wise Teachers' Gender details129Table 12(g):Province-wise Details of Community School Teachers129Table 12(h):Status of Student Enrollment at School Levels130Table 12(i):Status of Level-wise Student Enrollment in Academic Session 2018 and 2019131Table 12(j):Province-wise Details of Student Enrollment131Table 12(k):Level-wise Details of Students Enrollment132Table 12(l):Province-wise Net Student Enrollment133Table 12(m):Details of Girls and Boys who Passed SEE of 2017 and 2018 (General)134Table 12(n):Province-wise Details of SEE (earlier SLC) Results (Technical)134Table 12(o):Details of Girls and Boys who Passed SEE of 2017 and 2018 (Technical)135Table 12(p):Indicators Related to Health Sector136Table 12(q):Details of Health Institutions, Hospital Beds and Human Resources136Table 12(r):Province-wise Health Service Benefitted Population137Table 12(s):Extended Immunization and National Polio Vaccine138Table 12(t):Free Health Care Program140Table 12(u):Deprived Citizen Health Care141Table 12(v):Details of Service Recipients from Rehabilitation Centers142Table 12(w):Number of Lost Children143Table 12(x):Status of Basic Drinking Water and Sanitation144Table 12(y):Vital Registration146Table 12(z):Details of Listed Workers and Employers147Table 12(aa):Distribution of Social Security Allowances147Table 13(a):Status of Private House Reconstruction149Table 13(b):Status of Reconstruction of Damaged Public Infrastructures150Table 14(a):Male and Female Civil Servants as per Their Service Group153Table 14(b):Candidates Recommended Through Open and Inclusive Advertisement154Table 15(a):Foreign Employment and Remittances Inflow157
List of ChartsSNChart 1(a):Global Economic Growth RateChart 1(b):Comparative Status of Inflation in Nepal, India and China4Chart 1(c):Gross Domestic Product (GDP) Growth Rate5Chart 1(d):Structure of GDP5Chart 1(e):Sectoral Contribution to GDP Growth6Chart 1(f):Structure of Consumption6Chart 1(g):Gross Domestic Savings and Gross National Savings7Chart 1(h):Investment (Gross Capital Formation) Trend8Chart 1(i):Structure of Gross Fixed Capital Formation (Fixed Investment)8Chart 1(j):Chart 1(k):Gross Domestic Savings and Investment GapGross National Savings Investment Gap910Chart 1(l):Per Capita Income Growth Rate10Chart 1(m):Sectoral Growth Rate of GDP11Chart 1(n):Growth Rate and Contribution of Agriculture and Forestry Sector to GDP12Chart 1(o):Growth Rate and Contribution of Industrial Sector to GDP13Chart 1(p):Growth Rate and Contribution of Construction Sector to GDP13Chart 1(q):Growth Rate and Contribution of Wholesale and Retail Sectors to GDP14Chart 1(r):Growth Rate and Contribution of Hotel and Restaurant Sectors to GDP15Chart 1(s):Growth Rate and Contribution of Transportation, Communication and StorageSectors to GDP15Chart 1(t):Growth Rate and Contribution of Real Estate and Business Sectors to GDP16Chart 1(u):Growth Rate and Contribution of Public Administration and Defense Sectors toGDP17Chart 2(a):Provincial Structure of GDP18Chart 2(b):Province-wise GDP Growth RateChart 3(a):Indicators of Government Finance1922Chart 3(b):Expenditure Trend of Federal Government23Chart 3(c):Revenue Trend24Chart 3(d):Trend of Net Public Debt24Chart 3(e)Trend of Internal Debt MobilizationTrend of Public Debt Servicing25Trend of Current Expenditure, Capital Expenditure and Financing26Chart 3(h):Trend of Capital Expenditure28Chart 3(i):Status of Development Cooperation Commitment34Chart 3(j):Status of Development Cooperation Disbursement35Chart 3(k):The Structure of Development Cooperation Disbursement35Chart 3(f):Chart 3(g):DescriptionsPage225
SNDescriptionsPageChart 3(l):Chart 3(m):International Development Cooperation Mobilized Through on and off BudgetImpact of Exchange Rate on External Debt Liabilities3636Chart 4(a):Chart 5 (a):Overall and Sectoral Consumer Price Inflation RateStructure of Assets /Liabilities of Financial System in mid-January 20204345Chart 5(b):Trend of Interest Rates49Chart 5(c):Sectoral Credit flow from Banks and the Financial Institutions50Chart 5(d):NEPSE Index and NEPSE Float Index51Chart 6(a):Chart 6(b):Share of Import and Export in Total TradeMajor Indicators of External Sector5556Chart 7(a):Country-wise Foreign Employment64Chart 8(a):Contribution of Agriculture Sector to Economic Growth67Chart 8(b):Chart 8(c):Productivity of Food Crops in Current Fiscal YearProduction Structure of Pulse Crops in Current Fiscal Year7172Chart 8(d):Production and Growth Rate of Sugarcane74Chart 8(e):Production and Growth Rate of Tea74Chart 8(f):Production and Growth Rate of Fish75Chart 8(g):Meat Production Over the Last 5 Years76Chart 8(h):Import of Chemical Fertilizer Over the Last 5 Years77Chart 9(a):Status of Province-wise Investment in Industry86Chart 9(b):Details of Registered Industries Over the Last Decade87Chart 9(c):Proposed Total Foreign Investment88Chart 9(d):Details of Province-wise Registered Industries of Foreign Investment89Chart 9(e):Status of Ease of Doing Business in SAARC Countries91Chart 9(f):Number of Registered Companies92Chart 9(g):Petroleum Storage Capacity and Position to Meet Demand98Chart 9(h):Number of Tourist Arrivals99Chart 9(i):Country-wise Number of Tourist Arrivals99Chart 9(j):Tourist Arrivals According to Travel Objectives100Chart 10(a):Difference Between Electricity Demand and Supply106Chart 10(b):Status of Energy Consumption108Chart 10(c):Sectoral Power Consumption109Chart 11(a):Province-wise Status of Local Roads112Chart 11(b):Details of the Suspension Bridges113Chart 11(c):Population Having Access to Radio Nepal117Chart 12(a):Net Enrollment Rate of Pre-Primary Level and Children with ECD Experiences125Chart 12(b):Level-wise Net Student Enrollment Rate in Academic Year 2018 and 2019132Chart 12(c):Children Benefitted from Child Helpline142Chart 12(d):Trend in Access to Basic Drinking Water and Sanitation145Chart 13(a):Status of Reconstruction of Public Infrastructures151
MTCTQERRFSEESOSYSSuTRATIFATIPWSAAir Quality Data Display BoardAnti-Retro TreatmentAnti-Retro ViralBorder OutpostCOVID-19 Co-ordination and Management CenterCo-oprative and Poverty Related Management Information SystemCorona Virus Disease-19Disaster Recovery Data CenterForgery Detection UnitGender Action Learning SystemGlobal Navigation Satellite SystemGlobal Positioning SystemIodine Deficiency DisorderLocal Adaptation Plan for ActionLine Ministry Budgetary Information SystemLand Records Management and Information SystemNo Objection CertificateNational PortalNepal Trade Integrated StrategyOptical Mark ReaderProvince Line Ministry Budgetary Information SystemPrevention of Mother to Child TransmissionQuick Economic ReturnRevolving FundSecondary Education ExaminationSoftware Systems and SolutionSub-National Treasury Regulatory ApplicationTrade and Investment Framework AgreementTrade and Investment ProgramWeb Security Audit
Executive Summary1.The worldwide pandemic of coronavirus (COVID-19) has caused human losses as wellas severely affected the global economy. Measures undertaken to prevent and control thetransmission of this disease has disrupted the chain of production, supply andconsumptions. Due to the COVID-19 pandemic, economic activities have beenslowdown and expected to be contracted by 3.0 percent in 2020 as projected byInternational Monetary Fund (IMF).2.Macroeconomic indicators by mid-March of fiscal year 2019/20 are found satisfactory.Inflation rate, balance of payment situation, foreign exchange reserves, investment andfinancial indicators are found conducive to economic stability. Due to the contraction inimport and expansion in export there is an improvement in trade deficit and balance ofpayments is in surplus.3.Although rapid expansion in overall economic activities was experienced till mid-Marchof 2019/20, the pandemic of COVID-19 has affected the global economy and due to this,the growth of the Nepalese economy is preliminarily estimated to remain 2.3 percent.The average economic growth rate over the last three years has remained 7.3 percent (inproducer's price).4.Per capita gross domestic product (GDP) (in current price) is estimated to increase by 7.5percent in comparison to that of the last fiscal year and reach US Dollar 1,085(Rs.126,018) in fiscal year 2019/20.5.In fiscal year 2019/20, the growth rate of primary, secondary and tertiary sectors isestimated to remain 2.5 percent, 3.4 percent and 2.0 percent, respectively. Accordingly,the contribution of primary, secondary and tertiary sectors to GDP is estimated to be 28.2percent, 13.7 percent and 58.1 percent, respectively.6.In the last few years, the inflation rate is maintained below the average of a decade. Tillmid-March of fiscal year 2019/20, the average consumer price inflation is 6.5 percent. Inthe corresponding period of the last fiscal year such inflation rate was 4.2 percent.7.In fiscal year 2019/20, the gross consumption and gross domestic savings are estimatedto be 81.9 percent and 18.1 percent of GDP, respectively. The total investment isestimated to decrease by 3.4 percent and reach Rs.1889.26 billion in fiscal year 2019/20compared to that of the last fiscal year due to the contraction in public and privateexpenditures caused by the preventive and controlling measures adopted against theCOVID-19 outbreak.8.The province-wise GDP growth rate estimation for fiscal year 2019/20 is the highest 4.1percent in Sudurpaschim province and the lowest 1.2 percent in Bagmati province.Likewise, the estimated economic growth rate is 3.6 percent in Karnali province, 3.4percent in Province 1, 2.7 percent in Gandaki province and 2.3 percent in Province 2.
9.The absolute level of poverty is estimated to remain at 16.67 percent in fiscal year2019/20, which was 18.7 percent in fiscal year 2017/18.10.Transparency and quality of public expenditure is enhanced. The scopes and base of taxeshas increased and significant achievement is made in control of tax leakages. Cooperationhas increased with development partners. A new structure for internal and external debtmanagement is developed.11.By mid-March of fiscal year 2019/20, the total public expenditure has increased by 12.9percent and reached Rs.610.68 billion compared to that of the same period of the lastfiscal year. Of the total public expenditure Rs.450.78 billion is current, Rs.96.48 billionis capital and Rs.63.42 billion is financing.12.During mid-March of fiscal year 2019/20, revenue collection in federal consolidated fundand divisible fund has increased by 9.4 percent to Rs.546.79 billion in comparison to thatof the same period of the last fiscal year. Of the total revenue collected, Rs.497.54 billionis tax and Rs.49.25 billion is other revenues.13.During the mid-March of fiscal year 2019/20, revenue of the federal government hasincreased by 9.6 percent to Rs.479.71 billion in comparison to that of the same period ofthe last fiscal year.14.Till mid-March of fiscal year 2019/20, revenue of Rs.64.60 billion has been distributedto province and local levels. In fiscal year 2018/19, Rs.5.45 billion royalties wasdistributed among the federal, provinces and local levels whereas during the mid-Marchof current fiscal year 2019/20, Rs.2.48 billion is collected.15.Till the mid-March of fiscal year 2019/20, a sum of Rs.109.28 billion has been receivedas development cooperation commitment, of which Rs.16.19 billion is grant and Rs.93.09billion is loan.16.With the addition of Rs.91.90 billion the total outstanding public debt has reachedRs.1139.80 billion by mid-March of fiscal year 2019/20, which was Rs.1047.90 billionin mid-July 2019. Of the total outstanding public debt Rs.440.05 billion is internal andRs.699.75 billion externals.17.Financial sector is rapidly expanding. With the increased financial accessibility financialtransaction have been expanding remarkably. By mid-March 2020, there are altogether162 banks and financial institutions including 27 commercial banks, 23 developmentbanks, 22 finance companies, 89 micro finance companies and 1 infrastructuredevelopment bank are in operation. The number of branches of banks and the financialinstitutions including micro finances has reached 9,640. By mid-March of 2020, thebranches of commercial banks have reached at 746 local levels. Sixty-one (61) percentof the citizens have at least one bank account in the bank and financial institutions.18.Deposits of banks and financial institutions had increased by 9.7 percent during the midMarch of fiscal year 2018/19 whereas in the same period of the current fiscal year it hasincreased by 8.0 percent to Rs.3494.21 billion.
19.By mid-March of fiscal year 2019/20, the broad money circulation has increased by 7.3percent and narrow money circulation has reduced by 1.1 percent. During the same periodof the previous fiscal year the broad money circulation was increased by 8.4 percentwhereas the narrow money circulation was reduced by 0.7 percent.20.Credit towards the private sector has increased by 11.3 percent during the mid-March offiscal year 2019/20. Such growth rate was 15.7 percent in mid-March of fiscal year2018/19.21.The number of companies registered in Nepal Stock Exchange was 205 in mid-March2018/19 which increased to 212 in mid-March 2019/20. The share capitalization hasincreased by 24.7 percent and reached Rs.1760.93 billion in mid-March 2020 comparedto that of the mid-March 2019.22.By mid-March 2020, percentage of population having access to insurance has reached22. The population having access to insurances becomes 26.0 percent if persons offoreign employment are included.23.By mid-March of fiscal year 2019/20 total number of cooperatives has reached 34,837number of shareholders 6,515,460 and share capital Rs.77.24 billion. Number ofemployments generated in the cooperative sector is 68,400.24.By mid-March of fiscal year 2019/20, export of merchandise has increased by 22.3% toRs.74.91 billion whereas the import of merchandise has reduced by 2.6 percent toRs.924.24 billion. During this period, deficit in trade in merchandise is reduced by 4.3percent to Rs.849.33 billion. During the corresponding period of the fiscal year 2018/19such trade deficit was increased by 24.4 percent to Rs.887.88 billion.25.Balance of payment situation till mid-March of 2018/19 was deficit by Rs.58.99 billionwhereas it has become surplus by Rs.37.84 billion during the corresponding period offiscal year 2019/20. During the mid-March 2018/19, the current account deficit wasRs.191.49 billion which has reduced to Rs.124.93 billion by mid-March of fiscal year2019/20, due to some improvement.26.By mid-March of fiscal year 2019/20 the remittance inflow has increased by 1.8 percentto Rs.592.42 billion. During the corresponding period of the last fiscal year the remittanceinflow had increased by 23.4 percent to Rs.582.19 billion.27.The total foreign exchange reserve has reached Rs.1136.51 billion in mid-March 2020compared to Rs.1039 billion of mid-July 2019. This reserve is adequate to meet theimport of goods and services for 8.8 months and import of goods for 10 months.28.In comparison to mid-July 2019, Nepalese currency is devaluated by 7.7 percent in midMarch 2019/20 and consequently the buying rate of a US Dollar has remained Rs.118.44.29.By mid-March of fiscal year 2019/20, multi-dimensional poverty measurement data of1,225,000 households of 26 districts are collected and 391,831 households have beenidentified as the below poverty line households.
30.Under the Prime Minister Employment program various activities were carried out in 646local levels of 7 provinces making provision of an average 12.43 days of employment to188,000 people in fiscal year 2018/19.31.The number of registered employers from 74 districts and contributors to contributionbased social security scheme, initiated from mid-July 2019 has reached 12,287 and152,000, respectively. A sum of Rs.778.7 million has been deposited in Social SecurityFund from these contributors.32.The area of paddy production has reduced by 2.2 percent and paddy production hasdecreased by 1.05 percent in fiscal year 2019/20 compared to that of the fiscal year2018/19. The productivity of paddy has increased in current fiscal year.33.By mid-March of current fiscal year, the foreign direct investment approved bydepartment of industry has increased by 165.4 percent to Rs.29.67 billion in comparisonto that of the corresponding period of the last fiscal year. The Investment Board Nepalhas approved foreign investment of Rs.155.0 billion in this period. Foreign directinvestment has been increasing due to the reforms made in legal, structural, policy andprocedural fronts. A single point service center is in operation for investment.34.A sum of Rs.211.45 billion has been invested in industrial sector by mid-March of fiscalyear 2019/20. Altogether 614,827 people have got employment in large, medium andsmall industries.35.The number of tourist arrival was increasing till mid-March of fiscal year 2019/20.Average stay of tourists during January 2019 to January 2020 is 13 days. Tourism sectoris suffered severely due to coronavirus pandemic in recent times.36.Rapid urbanization and declaration of new municipalities by merging rural municipalitieshave caused to increase the urban population of Nepal to 62.2 percent.37.By mid-March 2020, population having access to electricity has reached 90.0 percent. Incomparison to the last fiscal year the total electricity generation has increased by 8.3percent to 1,355 megawatt (MW).38.By mid-March of fiscal year 2019/20, the total length of road, both strategic and localshas reached 34,347 kilometers (km) including black-topped 15,254 km, graveled 9,251km and fair weather 9,842 km. A total of 61,395 km roads have been constructed byprovince and local levels.39.By mid-March of fiscal year 2018/19, the number of international airlines operating inNepal were 29 which has increased to 30 till mid-March of fiscal year 2019/20. Thenumber of airports operating in all seasons has reached 35.40.Among the national pride projects, construction works of Gautam Buddha InternationalAirport and Pokhara International Airport have been completed 86.0 percent and 56.0percent, respectively.
41.Construction of 56 km long rail-way track of 70 km long Jayanagar-Janakpur-BardibasRailway has been completed in mid-March of fiscal year 2019/20.42.In academic session 2019 (2076) the net enrollment rate has reached 97.1 percent inprimary level, 93.4 percent in basic level and 47.6 percent in secondary level. Comparedto the previous academic years the level-wise net school enrollment rate has improved.Gender equality is achieved in school level education.43.Health insurance program is extended in 505 local levels of 55 districts in mid-March2020. Under this program altogether 2,687,810 people have got insurance services ofwhich 25.1 percent are ultra-poor and 300,000 are senior citizens.44.Access to sanitation is available to all people whereas access to drinking water isavailable to only 90.0 percent of the population by mid- March 2020.45.By mid-March of 2020, reconstruction of 63.3 percent of private houses, 74.1 percent ofpublic schools, 43.7 percent of archeological heritages, 55.9 percent buildings of healthinstitutions, 84.1 percent of public office buildings, and 50.7 percent building for securityagencies have been completed.46.In totality, the basic indicators of the economy and development activities weresatisfactory just before the measures adopted to prevent and control coronavirus. Sincethen, indicators of economic development and stability are under pressure due to theincreased slowdown in economic activities.
1. Overall Economic SituationWorld EconomyEconomic Growth1.1The outbreak of coronavirus (COVID-19) pandemic has caused loss of human lives aswell as severely affected the global economy. The measures adopted globally to controlthe outbreak of coronavirus has badly disrupted the chain of production to supply. Theeffect of COVID-19 pandemic is high on poverty and unemployment. Internationalagencies have predicted that the outbreak could pushed the global economy towardsrecession.1.2Consequent upon the measures adopted to control the outbreak of coronavirus, the globaleconomy is projected to be contracted by 3.0 percent by IMF in 2020, as against its lastyear's projection of 3.3 percent expansion. The transmission of COVID-19 will graduallybe abated by the second quarter of 2020 and the global economy will be normalized andbe expanded by 5.8 percent in 2021, IMF projects.Table 1(a): Global Economic Growth rate (in Percent)Economy201520162017201820192020*World Economy3.53.43.93.62.9-3.0Advanced EconomiesEmerging and DevelopingEconomiesEmerging and Developing AsiaMiddle East and North AfricanCountriesEmerging and Developing European Union Countries2.52.22.92.31.7-7.1Low Income Developing Countries4.63.84.85.15.10
Table 12(i): Status of Level-wise Student Enrollment in Academic Session 2018 and 2019 131 Table 12(j): Province-wise Details of Student Enrollment 131 Table 12(k): Level-wise Details of Students Enrollment 132 Table 12(l): Province-wise Net Student Enrollment 133 Table 12(m): Details of Girls and Boys who Passed SEE of 2017 and 2018 (General .