Transcription
2019S TUDENTH EALTHA NDR ISKP REVENTIONPrevention NeedsAssessment SurveyResults forUtah County LSAAState of UtahDepartment of Human ServicesDivision of Substance Abuse and Mental Health
TABLE OF CONTENTSAcknowledgments 3Introduction 4Understanding the Charts 5Substance Use 9Antisocial Behavior 17Community and School Climate and Safety 18Social and Emotional Health 24Substance-Related Indicators 29Physical Health and Safety 39The Risk and Protective Factor Model of Prevention 43Risk and Protective Factors 45School and Community Improvement Using Survey Data 57Building a Strategic Prevention Framework 58Appendix A: Changes between PNA administrations 60Appendix B: Substance Use and Perceived Parental AcceptabilityAppendix C: Drug Free Communities Data 63Appendix D: Contacts for Prevention 64Appendix E: Risk and Protective Scale Definitions 67Appendix F: Item Dictionary 7062
ACKNOWLEDGMENTSCoordination and administration of the Utah PNA Survey was a collaborative effortof the State of Utah, Department of Human Services, Division of Substance Abuseand Mental Health; State Board of Education; Department of Health; and BachHarrison, LLC. For more information about the PNA or prevention services in Utah,please refer to Appendix D: Contacts for Prevention.2019 Prevention Needs Assessment Survey3
INTRODUCTION2019 Utah County LSAA PreventionNeeds Assessment Survey Reporthealth and suicide, gang involvement, academic issues,health and fitness, and other prevention-related topics.This report summarizes the findings from the Utah2019 Prevention Needs Assessment (PNA) Survey thatwas conducted as part of the Student Health and RiskPrevention (SHARP) Statewide Survey. The survey wasadministered to students in grades 6, 8, 10 and 12 in39 school districts and 17 charter schools across Utah.(One private school also chose to participate in thesurvey.)Because not all students answer all of the questions, thetotal number of survey respondents by gender and survey respondents by ethnicity may be less than the reported total students.Further, in keeping with the vision that prevention services are designed to have a positive impact on the livesof individuals, efforts have been made to ensure that thePNA survey also gathers data on issues such as mentalWhen using the information in this report, please payattention to the number of students who participatedfrom your community. If 60% or more of the studentsparticipated, the report is a good indicator of the levelsof substance use, risk, protection, and antisocial behavior. If fewer than 60% participated, consult with yourlocal prevention coordinator or a survey professionalbefore generalizing the results to the entire community.Characteristics of participantsLSAA 2015NumberLSAA 2017PercentNumberLSAA 2019PercentNumberState 2019PercentNumberPercentWhat grade are you in?681012All ng about your gender, which of the following best describes 59,0619,70947.951.340,77644,38247.551.7 ,14062,5264,0471.51.61.715.91.373.24.7Which of the following best describe you?**Heterosexual (straight)Gay or lesbianBisexualNot sure/Other What is your race? (Select one or more)†African AmericanAmerican IndianAsianHispanic or LatinoPacific IslanderWhiteMulti-racial8081861,131894,339255* The 2019 survey instrument used by 8th, 10th, and 12th graders added "transgender" and "other" response options, although those data are not reported in this table. (6thgrade surveys did not include these additional responses.)** A question about sexual orientation was added to the 2019 survey instrument used by 8th, 10th, and 12th graders. (6th grade surveys omitted this question.) If anyresponse category has fewer than 10 respondents, all question data are suppressed to protect student privacy.† To accurately represent Hispanic/Latino participation in the SHARP survey, students indicating they are of Hispanic or Latino ethnicity and up to one race are reported asHispanic or Latino. Students reporting more than one race are reported as multi-racial (regardless of ethnicity).2019 Prevention Needs Assessment Survey4
UNDERSTANDING THE CHARTSThere are seven types of charts presented in this report: Dots, Diamonds, triangles, and Xs provide points ofcomparison to larger samples. The dots on the charts1. Substance userepresent the percentage of all of the youth surveyedacross Utah who reported substance use, problem be2. Antisocial behaviorhavior, elevated risk, or elevated protection. The di3. Community and school climate and safetyamonds and stars represent national data from the4. Social and emotional healthMonitoring the Future (MTF) Survey and the BachHarrison Norm, respectively.5. Substance-related indicators6. Physical health and safetyFor the 2019 PNA Survey, there were 86,346 participants in grades 6, 8, 10, and 12, out of 133,350 sampled,7. Risk factor profilesa participation rate of 64.8%. The fact that over 85,0008. Protective factor profilesstudents across the state participated in the PNA makesthe state dot a good estimate of the rates of alcohol, toData from the charts are presented in tables directly bebacco and other drug (ATOD) use and levels of risk andlow them. Additional data useful for prevention planprotective factors of youth in Utah. The survey resultsning are found in Appendices B and C. Note that dataprovide considerable information for communities toreported in the tables are rounded to one decimal place.use in planning prevention services.(Rates of 0% to 0.049% are displayed as 0.0%.)A comparison to state-wide and national results proUnderstanding the Format of the Chartsvides additional information for your community in deThere are several graphical elements common to all the termining the relative importance of levels of ATOD use,charts. Understanding the format of the charts and antisocial behavior, risk, and protection. Informationwhat these elements represent is essential in interpret- about other students in the state and the nation can behelpful in determining the seriousness of a given leveling the results of the 2019 SHARP survey.of problem behavior.The Bars found in most of the charts, for example, onsubstance use and antisocial behavior charts, represent Note that while the national data are visually representthe percentage of students in that grade who reported ed on the charts, they may be omitted from the tablesa given behavior. The bars on the risk and protective due to limitations on available space in the new PNAfactor charts represent the percentage of students whose report format.answers reflect significant risk or protection in that The diamonds represent national data from thecategory.Monitoring the Future (MTF) survey, a long-term epEach set of differently colored bars represents one of thelast three administrations of the PNA: 2015, 2017, and2019. By looking at the percentages over time, it is possible to identify trends in substance use and antisocialbehavior. By studying the percentage of youth at riskand with protection over time, it is possible to determine whether the percentage of students at risk or withprotection is increasing, decreasing, or staying the same.This information is important when deciding which riskand protective factors warrant attention.2019 Prevention Needs Assessment Surveyidemiological study that surveys trends in drug andalcohol use among American adolescents. Funded byresearch grants from the National Institute on DrugAbuse, it features nationally representative samples of8th-, 10th-, and 12th-grade students. (6th grade MTFdata are not available and as such are not on shown onthe charts.)The triangles represent national data from the BachHarrison Norm (BH Norm). Bach Harrison Norm wasdeveloped by Bach Harrison LLC to provide states andcommunities with the ability to compare their results5
SHARP 2019 U nderstanding the Chartson risk, protection, and antisocial measures with morenational measures. Survey participants from 11 statewide surveys were combined into a database of approximately 657,000 students in grades 6, 8, 10, and 12. Theresults were weighted to make the contribution of eachstate proportional to its share of the national population. Bach Harrison analysts then calculated rates forantisocial behavior and for students at risk and withprotection. The results appear on the charts as the BHNorm. In order to keep the Bach Harrison Norm relevant, it is updated approximately every 2 years as newdata become available. The last BH Norm update wascompleted in 2018.Scanning across the charts, it is important to observethe factors that differ the most from the Bach HarrisonNorm. This is the first step in identifying the levels ofrisk and protection that are higher or lower than thosein other communities. The risk factors that are higherthan the Bach Harrison Norm and the protective factors that are lower than the Bach Harrison Norm arefactors your community should consider addressingwhen planning prevention programs.survey), use of one-half a pack or more of cigarettes perday, and youth indicating drinking alcohol and drivingor reporting riding with a driver who had been drinking alcohol during the past 30 days.Substance use treatment needs are estimates of youthin need of alcohol treatment, drug treatment and anestimate of students that need either alcohol OR drugtreatment.The need for substance use treatment is defined as students who report using alcohol on 10 or more occasions in their lifetime or any drugs in their lifetime andmarked at least three of the following items specific totheir drug or alcohol use in the past year: Spent more time using than intended; Neglected some of your usual responsibilitiesbecause of use Wanted to cut down on use Others objected to your use Frequently thought about using Used alcohol or drugs to relieve feelings such assadness, anger, or boredomThe Xs represent national mental health data gatheredby the Youth Risk Behavior Survey (YRBS). Nationalcomparison points are available for grades 10 and 12 onthe topic of suicide and depression.Students could mark whether these items related totheir drug use and/or their alcohol use.Substance UseAntisocial BehaviorThere are two types of use measured on the drug use Antisocial behavior (ASB) profiles show the percentcharts.age of youth who reported antisocial behaviors duringthe past year, including suspension from school, sellingState identified priority substance use measures life- illegal drugs, and attacking another person with the intime and 30-day use rates for alcohol, marijuana, tobac- tention of doing them serious harm.co (including e-cigarettes), prescription narcotics, andoverall prescription drug abuse.Community and School Climate and SafetyOther substance use measures lifetime and 30-day use These charts present data related to perceived imporrates for a variety of illicit drugs, including cocaine, her- tance of school, positive school environment, studentoin, and methamphetamine.concerns about their school environment, perceivedschool safety, and bullying. The section also includesRisky substance use-related behavior is measured in data for perceived reasons of bullying, with data beingseveral different ways: binge drinking (having five or presented of students reporting being bullied in the pastmore drinks in a row during the two weeks prior to the year (a subset of the total survey sample).2019 Prevention Needs Assessment Survey6
SHARP 2019 U nderstanding the ChartsSocial and Emotional Health Sometimes I think that life is not worth it.The social and emotional health data show the per- At times I think I am no good at all.centage of youth with depression and mental health All in all, I am inclined to think that I am a failure.treatment needs, student responses to questions about In the past year, have you felt depressed or sadsuicide and self-harm, student responses to questionsMOST days, even if you felt OK sometimes?about social isolation, and questions about student attitudes toward the acceptability of seeking mental health These four depressive symptoms questions were scoredtreatment and their willingness to do so.on a scale of 1 to 4 (NO!, no, yes, YES!). The surveyrespondentswere divided into three groups. The firstNeeds Mental Health Treatment was estimated using the K6 Scale that was developed with support from group was the High Depressive Symptoms group whothe National Center for Health Statistics for use in the scored at least a mean of 3.75 on the depressive sympNational Health Interview Survey. The tool screens for toms. This meant that those individuals marked “YES!”to all four items or marked “yes” to one item and “YES!”psychological distress by asking studentsto three. The second group was the No DepressiveSymptoms group who marked “NO!” to all four of the During the past 30 days, how often did you:items, and the third group was a middle group who feel nervous?comprised the remaining respondents. feel hopeless?Suicide Related Indicators are based on a series of feel restless or fidgety?questions about suicide. These questions provide infor feel so depressed that nothing could cheer you up?mation about suicidal ideation and attempts of suicide(e.g.,“During the past 12 months, did you ever serious feel that everything was an effort?ly consider attempting suicide?” and “During the past feel worthless?12 months, how many times did you actually attemptAnswers to each were scored based on responses: None suicide?”).of the time (0 points), A little of the time (1 point), Someof the time (2 points), Most of the time (3 points), Allof the time (4 points). Students with a total score of 13or more points were determined to have high mentalhealth treatment needs. Table 6 also shows the percentage of students with moderate (scoring 7-12 points) andlow (scoring 0-6 points) mental health treatment needs.Self-Harm question (introduced in 2015) asks aboutself-destructive behavior other than suicide. Studentsare considered to have engaged in self-harm if they responded they had done “something to purposefully hurtyourself without wanting to die, such as cutting or burning yourself on purpose” one or more times during thepast 12 months.Depression-Related Indicators are divided into twoAttitudes Toward Mental Health Treatment are exsections. The first asks about depression in the past year:plored in a series of questions introduced in the 2017SHARP survey. how often they talked to an adult “ feel During the past 12 months, did you ever feel soing very sad, hopeless, or suicidal,” and if so, who theysad or hopeless almost every day for two weeks ortalkedwith. The final question in this section exploresmore in a row that you stopped doing some usualstudent attitudes toward seeking professional mentalactivities?health treatment when they are feeling this way.A second part, the depressive symptoms scale, is alsoreported. This part is calculated from student responsesto the following statements:2019 Prevention Needs Assessment Survey7
SHARP 2019 U nderstanding the ChartsSubstance-Related BehaviorsAdditional Tables in this ReportThe charts in this section explore additional data related to substance use. The charts present data regardingstudent perceptions of parental disapproval, student attitudes toward peer use, and student perceptions of howharmful substance use is. Further, the charts explorestudent sources of obtaining alcohol and places of alcohol use (data are presented of past-year alcohol users), aswell as student sources of obtaining e-cigarette/vapingdevices and places of e-cigarette/vape device use (of students who have vaped in the past year).Appendices B and C contain additional data for prevention planning and reporting to state and federal agencies.Perceived Parental Approval and ATOD UseAppendix B explores the relationship between perceivedparental approval and ATOD use. A full explanation ofhow to interpret these data is available accompanying thetables.Drug Free CommunitiesAppendix C contains information relevant to Drug FreeCommunity (DFC) grantees. This table reports the fourThis section focuses on student physical health and DFC Core Measures on alcohol, tobacco, marijuana andsafety. Charts display the percent of students reporting prescription drugs:safe vehicle habits and positive habits related to physical health and activity. New screen time and device use Perception of Risk - The percentage of respondents whoreport that regular use of the substance has moderate riskdata are also reported in this section.or great risk.Physical Health and SafetyRisk and Protective FactorsPerception of Parental Disapproval - The percentage ofrespondents who report their parents would feel regularuse of alcohol or any use of cigarettes, e-cigarettes, marijuana, or the misuse of prescription drugs is wrong orvery wrong.Risk and protective factor scales measure specific aspects of a youth’s life experience that predict whetherhe/she will engage in problem behaviors. The scales, defined in Table 2, are grouped into four domains: community, family, school, and peer/individual. The riskand protective factor charts show the percentage of stu- Perception of Peer Disapproval - The percentage of redents at risk and with protection for each of the scales. spondents who report their friends would feel regular useof alcohol or any use of cigarettes, marijuana, or misuseRisk factor charts show the percentage of youth who of prescription drugs is wrong or very wrong.are considered “higher risk” across a variety of risk facPast 30-Day Use - The percentage surveyed reporting ustor scales.ing the substance at least once in the past 30 days.Protective factor charts show the percentage of youthwho are considered high in protection across a varietyof protective factor scales.2019 Prevention Needs Assessment Survey8
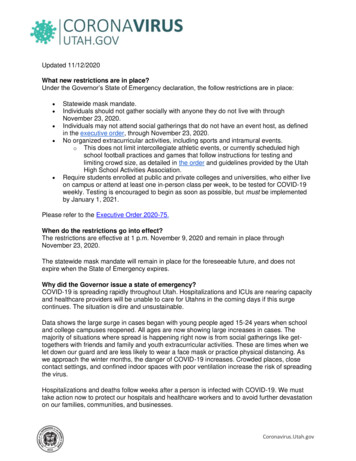
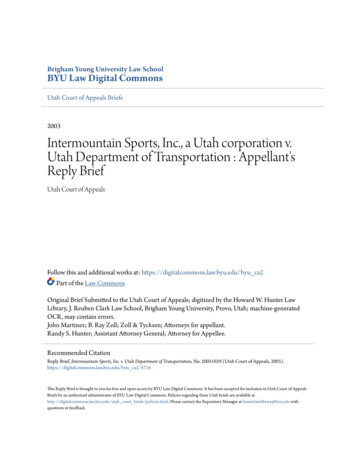
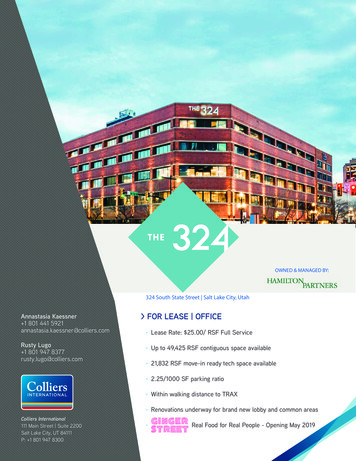
SHARP 2019 Substance Use State-identified priority substance use - Alcohol, marijuana, and prescription drugsUtah County LSAA 2019 Student Survey10080Percentage SAA2017LSAA2019Past 30-day use*State2019681012All6810MarijuanaLifetime 7LSAA2019Past 30-day use*State2019All681012AllPrescription drugs (all types combined)†Lifetime e2019LSAA2015LSAA2017Past .9* Since not all students answer all questions, the percentage of students reporting use in the past 30 days may be greater than the percentage reporting lifetime use.** National comparison data are available for 8th, 10th, and 12th grade only. Monitoring the Future does not survey 6th graders.† “Prescription drug abuse” is a combined measure showing the total rate of abuse of any prescription stimulant, prescription sedative, prescription tranquilizer, or prescription narcotic drugs.LSAA 20152019 Prevention Needs Assessment SurveyLSAA 2017LSAA 2019State 2019MTF**9
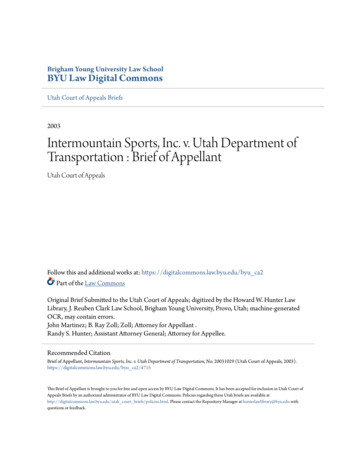
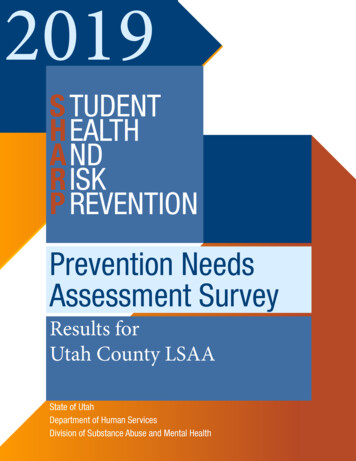
SHARP 2019 Substance Use State-identified priority substance use - Prescription drugsUtah County LSAA 2019 Student SurveyPercentage (Note the default axis scale for this chart is 50%)50403020100681012All681012All6810Prescription narcotic abuseLifetime12All681012All6810Prescription stimulant abusePast 30-days*Lifetime12All681012All6810Prescription sedative abusePast 30-days*Lifetime12All681012AllPrescription tranquilizer abusePast 30-days*LifetimePast 11.50.30.30.30.4* Since not all students answer all questions, the percentage of students reporting use in the past 30 days may be greater than the percentage reporting lifetime use.** National comparison data are available for 8th, 10th, and 12th grade only. Monitoring the Future does not survey 6th graders.LSAA 20152019 Prevention Needs Assessment SurveyLSAA 2017LSAA 2019State 2019MTF**10
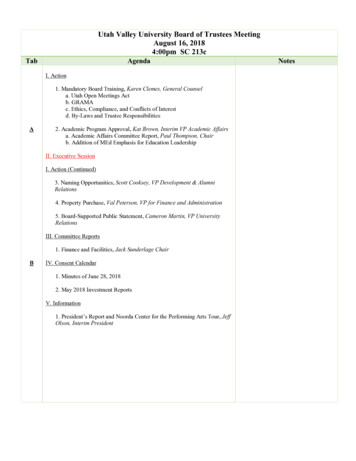
SHARP 2019 Substance Use State-identified priority substance use - Cigarettes and vaping productsUtah County LSAA 2019 Student SurveyPercentage (Note the default axis scale for this chart is esLSAA2015LSAA2017Past 30-days*LSAA2019State201981012AllVapingLifetime useGrade6LSAA2015LSAA2017Lifetime useLSAA2019State2019LSAA2015LSAA2017Past 211.913.112.118.95.76.65.89.7* Since not all students answer all questions, the percentage of students reporting use in the past 30 days may be greater than the percentage reporting lifetime use.** National comparison data are available for 8th, 10th, and 12th grade only. Monitoring the Future does not survey 6th graders.LSAA 20152019 Prevention Needs Assessment SurveyLSAA 2017LSAA 2019State 2019MTF**11
SHARP 2019 Substance Use State-identified priority substance use - Other tobacco productsUtah County LSAA 2019 Student SurveyPercentage (Note the default axis scale for this chart is 50%)50403020100681012All681012All681012Chewing tobaccoLifetime 81012Cigars, cigarillos, or little cigarsPast 30-days*State2019AllLSAA2017LSAA2019Lifetime AllHookah or waterpipePast 30-day use*State2019AllLSAA2017LSAA2019Lifetime useState2019LSAA2015LSAA2017LSAA2019Past 30-day 13.32.00.70.30.6* Since not all students answer all questions, the percentage of students reporting use in the past 30 days may be greater than the percentage reporting lifetime use.** National comparison data are available for 8th, 10th, and 12th grade only. Monitoring the Future does not survey 6th graders.LSAA 20152019 Prevention Needs Assessment SurveyLSAA 2017LSAA 2019State 2019MTF**12
SHARP 2019 Substance Use Other drugs - Cocaine, methamphetamine, heroinUtah County LSAA 2019 Student Survey30Percentage (Note the default axis scale for this chart is 015LSAA2017LSAA2019Past 30-day Lifetime cocaineGradeAllLSAA2015LSAA2017LSAA2019Lifetime SAA201581012AllHeroinPast 30-day e heroinState2019LSAA2015LSAA2017LSAA2019Past 30-day 0.10.20.10.10.00.0* Since not all students answer all questions, the percentage of students reporting use in the past 30 days may be greater than the percentage reporting lifetime use.** National comparison data are available for 8th, 10th, and 12th grade only. Monitoring the Future does not survey 6th graders.LSAA 20152019 Prevention Needs Assessment SurveyLSAA 2017LSAA 2019State 2019MTF**13
SHARP 2019 Substance Use Other drugs - Inhalants, hallucinogens, steroids, syntheticsUtah County LSAA 2019 Student Survey30Percentage (Note the default axis scale for this chart is A2015LSAA2017LSAA2019Past 30-day e inhalantsGradeAllLSAA2015LSAA2017LSAA2019Lifetime hallucinogensState2019LSAA2015LSAA2017LSAA2019Past 30-day te2019LSAA20151012All681012AllSteroidsSynthetic DrugsPast 30-day steroid usePast 30-day synthetic marijuana 0.50.70.30.20.20.20.60.90.71.1* Since not all students answer all questions, the percentage of students reporting use in the past 30 days may be greater than the percentage reporting lifetime use.** National comparison data are available for 8th, 10th, and 12th grade only. Monitoring the Future does not survey 6th graders.LSAA 20152019 Prevention Needs Assessment SurveyLSAA 2017LSAA 2019State 2019MTF**14
SHARP 2019 Substance Use Risky substance use-related behaviorUtah County LSAA 2019 Student SurveyPercentage (Note the default axis scale for this chart is 50%)50403020100681012All681012All681012AllProblem substance useBinge drinking*LSAA2015GradeLSAA20171/2 pack of nking and 81.72.3All2.73.02.34.00.20.10.10.11.21.50.91.4* Since not all students answer all questions, the percentage of students reporting binge drinking may be greater than the percentage reporting 30-day alcohol use.** National comparison data are available for 8th, 10th, and 12th grade only. Monitoring the Future does not survey 6th graders.LSAA 20152019 Prevention Needs Assessment SurveyLSAA 2017LSAA 2019State 2019BH NormMTF**15
SHARP 2019 Substance Use Substance treatment needsUtah County LSAA 2019 Student SurveyPercentage (Note the default axis scale for this chart is e use treatment needs scaleNeeds alcohol treatmentGradeLSAA2015LSAA2017Needs drug treatmentLSAA2019State2019LSAA2015LSAA2017Needs alcohol or drug AA 20152019 Prevention Needs Assessment SurveyLSAA 2017LSAA 2019State 201916
SHARP 2019 Antisocial Behavior Antisocial behaviorUtah County LSAA 2019 Student SurveyPercentage (Note the default axis scale for this chart is l681012All681012All681012All681012AllAntisocial behaviors reported one or more times during the past yearSuspended from schoolDrunk or high at schoolSold illegal drugsAttacked someone w/ideaof seriously hurting themCarried a handgunHandgun to schoolStolen a vehicleBeen 0.71.00.91.51.11.3LSAA 20152019 Prevention Needs Assessment SurveyLSAA 2017LSAA 2019State 2019BH Norm17
SHARP 2019 Community and School Climate and Safety Perceived importance of schoolUtah County LSAA 2019 Student Survey10080Percentage (%)6040200681012All681012All6Students answering "Often" or "Almost Always"How often do you feel that the school work you are assigned is meaningful andimportant?GradeLSAA2015LSAA2017LSAA2019Stat
2019 Utah County LSAA Prevention Needs Assessment Survey Report This report summarizes the findings from the Utah 2019 Prevention Needs Assessment (PNA) Survey that was conducted as part of the Student Health and Risk Prevention (SHARP) Statewide Survey. The survey was administered to students in grades 6, 8, 10 and 12 in 39 school districts .