Transcription
White paper Version 01.00LTE mobile networkoptimization – a definitiveguideWhite paperLTE mobile optimization-a definitive guide wp en 5216-2018-52 v0100.indd 112.10.2018 11:18:24
Table of contents1 Introduction. 32 Optimization. 32.1 Quality of the network versus quality of experience. 32.2 LTE optimization. 53 LTE system architecture. 63.1 System components. 63.1.1 Typical LTE operation. 64 LTE RAN KPIs. 74.1 Types of LTE RAN KPIs. 75 Case study: LTE accessibility . 85.1 Anatomy of LTE accessibility . 85.2 Field performance metrics and KPIs. 96 Optimization walkthrough. 106.1 Scenario. 106.2 Coverage optimization. 106.2.1 Main parameters for UL and DL coverage. 116.2.2 Overlapping coverage. 116.2.3 Extended coverage. 126.3 Capacity optimization. 126.3.1 PDCCH capacity. 136.3.2 Number of scheduled UEs. 136.3.3 DL data rate optimization. 146.3.4 UL data rate optimization. 156.4 Call drop optimization. 156.4.1 Reasons for call drop and optimization. 166.5 Latency optimization. 166.6 Mobility optimization. 176.6.1 Intra-LTE mobility optimization. 187 Conclusion. 188 References. 199 Literature. 19Long term evolution (LTE) provides global mobility with a wide range of services that includes voice, dataand video in a mobile environment with lower deployment costs. Mobile networks are rapidly transforming– traffic growth, increased bit rates per user etc., due to new technologies such as LTE. The growthin mobile traffic is mainly driven by devices such as smartphones, tablets, etc. In order to get the bestperformance out of an LTE network, it needs to be optimized continuously. This white paper addresses thewireless network optimization challenges from a radio network perspective. Key performance indicators(KPIs) and with their dependence on performance indicators (PIs), field measurement metrics andparameters are described in the correct context.2LTE mobile optimization-a definitive guide wp en 5216-2018-52 v0100.indd 212.10.2018 11:18:24
1 IntroductionIt is important to understand that regardless of the domain (radio or core) and technology,optimization should be seen as a set of processes and activities that are based on theanalysis of the system followed by elaboration and execution of recommended actionswith the goal of assuring that the system is operating in the most efficient way and at itsbest performance. Optimization is a broad term, and in the context of cellular networks itrefers to pre-optimization and post-optimization before and after the network is built andgoes into operation. The outcome of network optimization and the level of network optimization work directly relates to future network capacity and stability. When optimizationis performed, coverage, interference, mobility, capacity and quality are usually taken intoconsideration.In general, the network optimization process should also include access, session drop, latency, mobility, congestion, paging and other thematic analyses. Commercially, optimization services are offered by vendors as two separate services. One is called initial tuningalso known as pre-launch optimization and the other is referred to as post-launch optimization. Conventionally, any cellular network optimization solution can be divided into thefollowing functions: Performance statistics Performance recording Performance data analysisThe end goal of optimization is to maximize the operator’s investment as well as end-usersatisfaction. In order to do that, performance engineers need to know how the systemworks, i.e. what basic procedures take place from the moment a user turns on the phoneand places a call/data session to the moment they hang up, what might occur in betweenand what might influence each process.They also need awareness and the ability to know how the system is performing. This isbased on specific data collection tools, key performance indicators (KPIs), etc. Given that,a performance engineer should then have the ability to evaluate the performance basedon KPIs and propose recommendations and solutions in order to optimize a cellular network. In times of operators reducing OPEX (and expertise in network optimization), thedemand for smart tools that support more automated network insights based on the collected data is increasing.2 Optimization2.1 Quality of the network versus quality of experienceMobile networks are highly complex structures, intricately designed to meet the qualityrequirements of the network and subscribers. To subscribers, the labyrinthine construction of a mobile network appears transparent and straightforward: either they receive theexpected service quality or they do not – whether this service is making a call, watching avideo, or posting on social media.Subscribers equate the quality of the network or quality of service (QoS) such as voiceor video with quality of experience (QoE), which is influenced by the device and content,regardless of whether a mobile network operator (MNO) or a third-party content providercontrols the service. So, where does this leave the MNO who wants to ensure end-userquality of experience and optimize his network and services accordingly? What will heneed to consider before investing in solutions for mobile network testing?The goal of the MNO is superior end-user quality of experience compared to its competitors. The MNO may lose subscribers if a competitor provides better QoE to the end users. Third-party user equipment (UE), such as smartphones, connects to the operator’smobile network and influences the QoE, but the operator only has limited control overRohde & Schwarz White paper LTE mobile network optimization – a definitive guide 3LTE mobile optimization-a definitive guide wp en 5216-2018-52 v0100.indd 312.10.2018 11:18:24
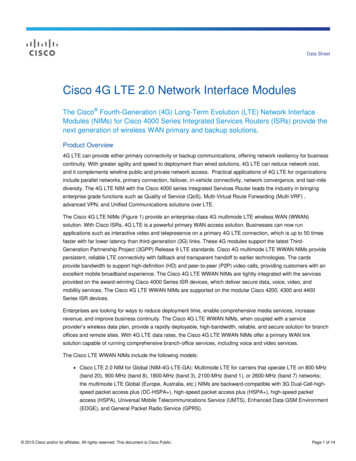
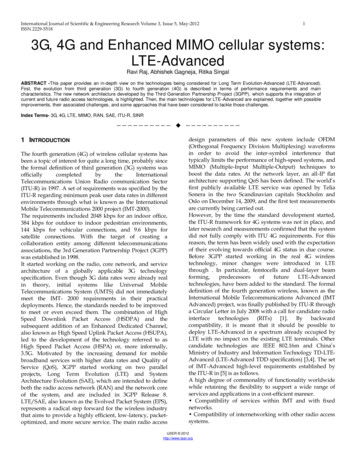
them. The mobile network operator controls the servers for its own voice and video services. Via the same infrastructure, subscribers also enjoy applications from third parties,so-called over-the-top (OTT) media services. Typically, an application client that is locatedon the smartphone connects to an application server that is out of the MNO’s control.Consequently, MNOs have no direct control over third-party apps such as YouTube, Spotify, etc. Therefore, different tests are required to test either network quality or quality ofexperience.The ultimate purpose of optimization is not only to provide continuous and reliable service, but also to deliver service satisfaction from the end-user perspective. End-user experience metrics such as voice mean opinion score (MOS) are not the same as the quality ofservice metrics such as bit error rate (BER). There is often confusion among performanceengineers about the difference between quality of service (QoS), quality of experience(QoE) and optimization. QoE is the customers’ perception of how good of a job the service provider is doing delivering the service. End-user perception of overall quality depends upon multiple aspects of the network and service. QoE is directly affected by QoS,but is different from QoS.QoS focuses on measuring performance at the packet level from the network perspective. QoS is measured objectively while QoE is measured subjectively, which ultimatelyrequires translation into quantitative data. It is possible to have excellent QoS but poorQoE. In general, end users are not concerned about how a network is implemented andhow QoS is achieved. They just want better QoE.In order to understand how QoE is influenced by QoS, a performance engineer shouldlook at more than the raw KPIs. Optimization engineers need to know about users’ perceived quality. Efficient utilization of overall network data to analyze and optimize the network quality is another challenge for performance specialists. The relationship betweenQoS, QoE and KPI is shown in the figure below.Fig. 1: Relationship between QoE, QoS and KPIsService purposeQoSQoEService managementNetwork foundationKPIs4LTE mobile optimization-a definitive guide wp en 5216-2018-52 v0100.indd 412.10.2018 11:18:25
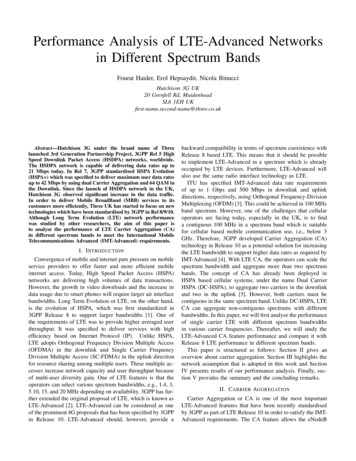
2.2 LTE optimizationThe optimization of LTE networks mainly refers to pre-optimization before and continuousoptimization after a network is launched. Network optimization is a continuous daily taskand is necessary so that network performance satisfies certain thresholds or targets forkey performance indicators (KPIs) agreed to by the operator beforehand. After a networkis deployed and before it is launched on air, it is necessary to perform pre-launch optimization. Changes during pre-launch optimization are mainly physical (e.g. antenna tiltsand azimuths) although they may also include some parameter changes to optimize thecoverage and quality of the network. Since there is very little or no traffic on the networkcounters, they don’t provide statistically reliable information. In this regard, drive and walktesting is the main optimization method during the pre-launch optimization to achievecertain field KPIs.Once a site is launched, the network traffic volume and nature is continually changing, so optimization is still needed to maintain the high level of performance defined byKPIs. In general, pre-launch optimization focuses on coarse tuning of the network andpost-launch optimization focuses on fine tuning the network. The flow of optimization isshown in Fig. 2.Fig. 2: Pre and post-launch optimization workflowPre and post network optimization workflowNetworkdeploymentContinuous optimization:network expansionand planningInitial optimization:initial tuning orprelaunch optimizationLoading reachesdesigned capacityNetworklaunchIn-service optimization:post-launchoptimization2.3 How optimization has evolvedOperators are always looking for different ways to make networks more automatic withfewer manually-controlled parameters to reduce operational costs while delivering a moreseamless connection and making the network more intelligent. In this context, self-organizing networks have emerged as a set of use cases based on network generated datathat cover the entire network lifecycle – from planning and deployment to operation andoptimization. The goal of self-optimization is to automatically fine tune initial parametersfor improved cell/cluster performance and to dynamically recalculate these parameters incase of network, service and traffic changes. The technological evolution of optimizationis shown in detail in Fig. 3. However, it is worth noting that we are not yet at the stage ofoptimization being a fully automated process. Operators are reluctant to delegate the authority to change fundamental network parameters to automatic algorithms and artificialintelligence because of concerns about creating instabilities.Rohde & Schwarz White paper LTE mobile network optimization – a definitive guide 5LTE mobile optimization-a definitive guide wp en 5216-2018-52 v0100.indd 512.10.2018 11:18:25
Fig. 3: How optimization has evolvedTraditional networkoptimizationEfficiency improvement:MR, OSS, signaling dataapplicationBasic RF optimizationincludes: Coverage Interference Neighbor list PSC/PCI FrequencyKPI optimizationIncreased focus on traffic andend userRF optimization includes: Coverage (MR, OSS) Capacity (OSS) Parameters (MR,signaling data) Antenna and interferenceE2E service KCI: RF/RAN Bearer/CN/transport UE SPOptimization based onGSI (MR/PM)KPI improvement (MR, OSS)Voice/serviceService QOSIntelligent and automaticoptimizationMDTRF optimization(ANR, PCI, CCO)KPI/parameter optimization MRO MLB RACHA-ICIC (interference)3 LTE system architecture3.1 System componentsThe general LTE system architecture is shown in Fig. 4. It consists of the core networkand the access network. The architecture of LTE is flat compared to previous cellulartechnologies. Core network nodes include the mobility management entity (MME), serving gateway (SGW) and packet data network gateway (PGW). The radio access network(RAN) nodes include eNodeB.3.1.1 Typical LTE operationWhen user equipment (UE) is powered up, it becomes radio resource control (RRC) connected with eNodeB. eNodeB forwards the registration request on behalf of the UE to theMME. The MME is responsible for UE registration, session management, mobility management and security procedures. Once the MME registers the UE, it requests the PGWvia the SGW to allocate an IP address to the UE. When the PGW allocates an IP address,the SGW communicates this information back to the UE via the MME and eNodeB path.The SGW and PGW are responsible for allocation of IP addresses and providing access todata traffic to the user. The base station in the RAN is responsible for providing both control and user traffic to the UE over the air interface. In 4G LTE, unlike other technologies,only eNodeB constitutes the RAN portion of the network as shown in Fig. 4.Fig. 4: LTE system architectureMMERRC connectionSRBPCIMMESGWPDN-GWIPeNodeB6LTE mobile optimization-a definitive guide wp en 5216-2018-52 v0100.indd 612.10.2018 11:18:25
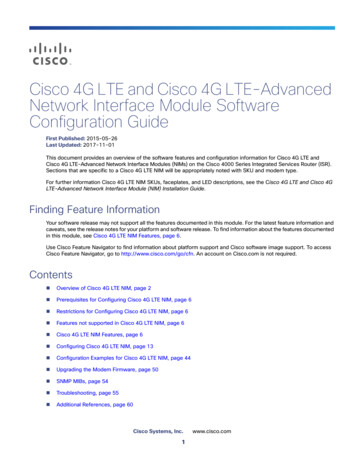
4 LTE RAN KPIs4.1 Types of LTE RAN KPIsThe service experienced by end users is measured by using a number of performanceindicators (PIs) that are aggregated to form a KPI. According to the third generation partnership project (3GPP) standard, there are six main KPIs that directly influence networkperformance and end-user experience: accessibility, retainability, integrity, mobility, availability and utilization.Accessibility defines how easy it is for the user to obtain a requested service withinspecified tolerances and other given conditions. Session setup time and call success rateare examples of accessibility KPIs.Retainability defines the ability of the network to continuously provide the requestedservice under given conditions for the desired period of time. An example KPI in this context is session abnormal release rate, which means poor retainability for a network.Integrity means the degree to which a service is provided without excessive impairments, for example uplink/downlink throughput, latency, packet loss, etc.Mobility is when a user is moving from one cell to another. Handover performance andother mobility related performances are measured with mobility KPIs.Availability means the percentage of time a cell is considered to be available. In somecases, although the cell may seem to be up and running, it can be sleeping or in an outage condition due to some anomaly, or disabled manually because of the operators’maintenance procedure. In such a case, poor network availability or complete outage canoccur.Utilization refers to the simultaneous usage of network resources without affecting theend-user experience.These RAN KPIs and their immediate dependencies on various performance indicators(PIs) and parameters are shown in Fig. 5.Fig. 5: KPIs and their immediate ilityAvailabilityUtilization RRC portion S1 portion E-RAB portion AbnormalUE contextrelease AbnormalE contextrelease DL/ULthroughput Packet loss Latency Preparationfailure rate Executionfailure rate Partial cell Sleeping cell Licenses System load Processor load PhysicalresourcesRohde & Schwarz White paper LTE mobile network optimization – a definitive guide 7LTE mobile optimization-a definitive guide wp en 5216-2018-52 v0100.indd 712.10.2018 11:18:25
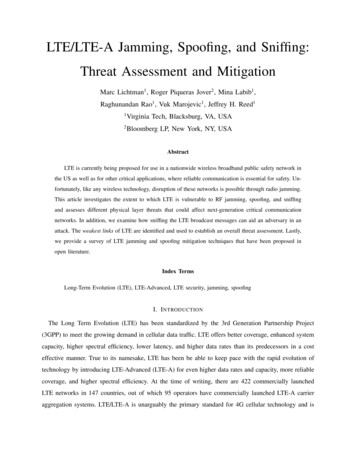
5 Case study: LTE accessibility5.1 Anatomy of LTE accessibilityTo explain the concept and dependency of KPIs, consider the RRC connection attach procedure as shown in Fig. 5. The UE is assumed to be already attached and has a defaultEPS bearer setup. The diagram shows the UE making a radio access request for the purpose of either sending a user data mobile originated (MO) call or responding to a page,i.e. mobile terminating (MT). The procedure and flow are similar for sending a trackingarea update (TAU), except there would be no UE release due to inactivity because theMME would be responsible for removing the context.Fig. 6: Anatomy of an RRC connectionIDLE(attached)RRC connectedRACH,responseTA, GrantEstablish S1signallingRRCadmissioncontrolEstablish SRB2,DRB3 andS1-UPERAB(initial)UE context &ENB releasedENBs UE contextAccess attemptIDLE(attached)SRB1S1-MMESRB2ERAB (initial)S1-UP user dataDRB3 user data10% inactivityThe different steps for this radio access connection request shown in Fig. 6 are explainedas follows: During the access attempt phase, there is a RACH attempt from the UE followed by aresponse from eNodeB, which provides the timing alignment and uplink grant for theUE. In addition, counters for the random access attempt and RRC connection requestsare pegged at the same time base. As a result of the access attempt, eNodeB checks for resources in order to support theconnection request. If resources are available, the connection request is accepted andconnection success counters are triggered. Once the MO or MT request is accepted by eNodeB, it is sent to the MME on behalf ofthe UE. After the initial message to MME is received, the message response from theMME triggers the S1 signaling establishment success. Counters associated with the S1signaling establishment are triggered at the same time. Finally, since the RRC has been reconfigured, the evolved radio access bearer (ERAB)initialization is established and the counters associated with ERAB are pegged. The user plane is established and eNodeB has full context of the UE in view. Now userplane packets can be transmitted to and from the network and UE.The counters to be pegged and various steps involved during the MT or MO accessibilityprocess are shown in Fig. 6. It is important to realize that even though accessibility affectsthe end-user perception and is measured as a KPI from a business and technical perspective, it consists of a number of performance indicators and various steps that are measured as sub-KPIs and field measurements. Measurement and adjustment of these performance metrics during the optimization process ultimately impacts the accessibility KPI.8LTE mobile optimization-a definitive guide wp en 5216-2018-52 v0100.indd 812.10.2018 11:18:25
5.2 Field performance metrics and KPIsIn section 4.1, we discussed high-level KPIs that are measured and tracked at the consumer and executive level. Now we will discuss major field performance metrics that aremonitored and optimized by performance engineers to have an ultimate impact on enduser KPIs.The key KPIs for network performance described in section 4.1 depend on a number ofperformance indicators (PIs). These sub-KPIs or PIs are monitored and measured continuously in order to gain an accurate KPI value. In field measurements, performance engineers are always concerned about maintaining these performance measurements. Whenthese values are maintained continuously, the rest of the network KPIs will perform well.Major field KPIs and the category under which they fall are shown in Fig. 7Fig. 7: Key performance metrics and field measurementsKPI nameApplication servicesLTE E2E network serviceKPI categoryPS data services(FTP, HTTP, etc.)Control planeUser planeRadio bearer servicesUser planeService accessibility in %AccessibilityCompleted session ratio in %AccessibilitySingle-user throughput in MbpsUtilizationAttach time in ms,AttachTime [ms] t attach complete – t attach requestIntegrityAttach success rate in %AccessibilityService request (EPS) time in msIntegrityService request (EPS) success ratein %Service request (EPS) drop ratein %Handover procedure time in msAccessibilityHandover success rate in %MobilityRoundtrip time (RTT) in msIntegritySingle-user throughput in MbpsUtilizationRetainabilityMobilityService interrupt time (HO) in msMobilitySingle-user throughput in MbpsUtilizationCell throughput in MbpsUtilizationRohde & Schwarz White paper LTE mobile network optimization – a definitive guide 9LTE mobile optimization-a definitive guide wp en 5216-2018-52 v0100.indd 912.10.2018 11:18:26
6 Optimization walkthrough6.1 ScenarioFor a field measurement optimization walkthrough, consider the scenario of a user moving through different parts of a city – from a suburban to urban area. When and how different measurement and field optimization metrics are applied is shown in Fig. 8. Theoverall network optimization is applicable throughout the user journey, however specificscenarios are shown for ease of understanding.Fig. 8: Optimization walkthrough scenarioThroughput optimizationInterference optimizationCapacity optimizationMobility optimization6.2 Coverage optimizationCoverage optimization is the key for LTE network optimization. One of the highest costs inRAN optimization is coverage measurement and optimization. Traditionally, this requiresintensive GPS based drive testing followed by offline or realtime analysis and correction.Drive tests and walk tests conducted a few times a year can be complemented by crowdsourced data collected from real subscribers to create a finer granularity geographic distribution than is possible with cell level stats.Two of the thresholds for some of the coverage issues based on signal strength are: Coverage holes definition: RSRP –120 dBm Weak coverage definition: RSRP –105 dBmThe main method of coverage optimization includes adjustment of the antenna azimuth,down tilt, height, and location of the site as well as adding new sites or RRU for the poorcoverage area, adjustment of the RS power, etc.10LTE mobile optimization-a definitive guide wp en 5216-2018-52 v0100.indd 1012.10.2018 11:18:26
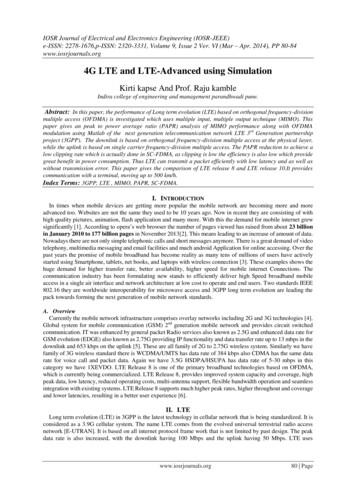
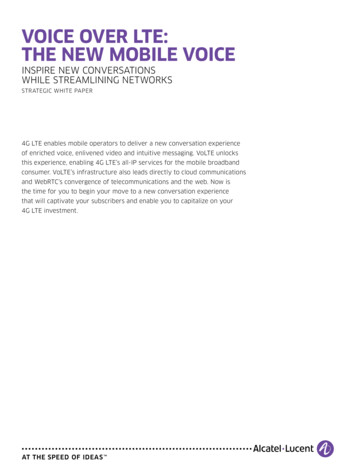
6.2.1 Main parameters for UL and DL coverageThe main parameters that impact uplink (UL) and downlink (DL) coverage are shownFig. 9.Fig. 9: DL and UL coverage parametersDL coverageUL coverageqRxLevMinA factorRSpowerp0NominalPUSCH/p0NominalPUCCHSCH power offset, PBCH power offset, PCFICH poweroffset, PHICH power offset, PDCCH power offsetpboffsetPDSCH, pboffsetPDSCH,Initial UL SINR target for PUSCHCell DL total powerMin UL SINR target for PUSCHMax UL SINR target for PUSCHHow each of the parameter impacts the DL and UL coverage is listed below.qRxlevMin: This parameter specifies the minimum required receiver level in the cell. Avery low (more negative) value of qRxLevMin will enable more UEs to be connected tothe LTE network, but that will impact the access success rate and paging success rate. Ahigh (less negative) value of qRxlevMin will result in a smaller number of UEs connectedto LTE network.UL PUSCH coverage: Different kinds of UL SINR are chosen according to the particularservice to ensure that the target SINR at the cell edge does not go so low that it causessynchronization problems.Alpha factor: This is intended to allow partial compensation of the path loss. The valueof this parameter represents a tradeoff between minimizing interference and maximizingthroughput. Its value must be set according to the client’s desired network behavior.pZeroNominalPUSCH: This power control parameter represents the necessary signallevel per radio bearer for correct decoding and is sent over the broadcast channel. Thisparameter impacts the UE power and network interference level before any power controlcommands are received from the eNodeB. Higher settings of the parameter will improvethe PUSCH reception but will also drive up the UE TX power, leading to potential interference in neighboring cells.6.2.2 Overlapping coverageLTE networks use the same frequencies throughout the network and if the coverage overlap area is large, it results in cells causing a lot of interference with each other. The downside of interference is that it reduces throughput and degrades user QoE. Scanner RSRPmeasurements provide the most accurate method of identifying interfering sites and finding the source of strong interferers.Rohde & Schwarz White paper LTE mobile network optimization – a definitive guide 11LTE mobile optimization-a definitive guide wp en 5216-2018-52 v0100.indd 1112.10.2018 11:18:26
Figure 9: Interference with neighboring sitesFig. 10: Interference with neighboring sitesA BSite ASite BAllA CB CSite CPilot pollution is another reason for overlap coverage. The downside of pilot pollutionincludes frequent cell reselection in idle state, ping-pong handover, low signal to noiseratio (SNR) and high block error rate (BLER), drop call and low throughput. One way toimprove pilot pollution is to change the antenna tilt, azimuth and possibly the eNodeBpower of the interfering cells. Other ways include changing the antenna type and heightor adding a new site/remote radio unit (RRU) to create dominance.6.2.3 Extended coverageLarge cells are needed in areas such as coastal areas, sea environments, rural areas, etc.and LTE enables cell sizes up to 100 km. This limit determines the maximum timing advance value that can be sent to a UE. This value provides the UE with a minimum amountof processing time after receiving data in the DL and before transmitting a response in theUL.For each cell, the maximum desired cell range defined by the 3GPP can be from 1 kmup to 100 km. The important thing is to carefully select the correct combination of physical random access channel (PRACH) format type and special subframe type. Either thePRACH format or special subframe type form the upper limit for maximum cell radius, independent of link budgets.Factors that can limit cell size are usually RACH delay and signal interference to noise ratio (SINR).6.3 Capacity optimizationCapacity optimization focuses on improving resource utilization and maximizing trafficthroughput. It not only refers to user plane capacity, but also capacity related to controlsignaling solutions and user connectivity. User throughput is an important metric of capacity optimization.When performing root cause analysis of capacity and investigating LTE low throughput,it is important to analyze the radio conditions, signaling flows, logging messages and cellloading to understand the reasons for the low throughput.12LTE mobile optimization-a definitive guide wp en 5216-2018-52 v0100.indd 1212.10.2018 11:18:26
6.3.1 PDCCH capacityThe physical downlink control channel (PDCCH) is used to transfer DL control informationfor scheduling DL resources on PDSCH and UL resources on the physical uplink sharedchannel (PUSCH) channel. PDCCH is a critically important channel since air interfacescheduling and load depend upon PDCCH capacity.PDCCH symbols at the beginning of each subframe can be dynamically adjusted basedon the load and radio conditions. A UE in poor radio coverage will require 8 control channel elements (CCEs) for each PDCCH transmission, whereas a UE in good radio conditionmay only need 1 CCE. Therefore, from a capacity perspective, higher aggregation levelsshould be employed at the cell edge and lower aggregation levels for users close to thecell. PDCCH capacity is measured in terms of CCEs, which are 9 sets of resource elementgroups (REG) or 36 resource elements (REs) since each REG contains 4 REs. PDCCH coding is restricted to QPSK to allow users to decode the PDCCH channel even in low SINRconditions.A simplified flow of the PDCCH capacity analysis procedure is shown in Fig. ityanalysisSystem bandwidth, CP,
Long term evolution (LTE) provides global mobility with a wide range of services that includes voice, data and video in a mobile environment with lower deployment costs. Mobile networks are rapidly transforming . Core network nodes include the mobility management entity (MME), serv-Rohde & Schwarz White paper .