Transcription
Performance Analysis of LTE-Advanced Networksin Different Spectrum BandsFourat Haider, Erol Hepsaydir, Nicola BinucciHutchison 3G UK20 Grenfell Rd, MaidenheadSL6 1EH chison 3G under the brand name of Threelaunched 3rd Generation Partnership Project, 3GPP Rel 5 HighSpeed Downlink Packet Access (HSDPA) networks, worldwide.The HSDPA network is capable of delivering data rates up to21 Mbps today. In Rel 7, 3GPP standardised HSPA Evolution(HSPA ) which was specified to deliver maximum user data ratesup to 42 Mbps by using dual Carrier Aggregation and 64 QAM inthe Downlink. Since the launch of HSDPA network in the UK,Hutchison 3G observed significant increase in the data traffic.In order to deliver Mobile BroadBand (MBB) services to itscustomers more efficiently, Three UK has started to focus on newtechnologies which have been standardised by 3GPP in Rel 8/9/10.Although Long Term Evolution (LTE) network performancewas studied by other researchers, the aim of this paper isto analyse the performance of LTE Carrier Aggregation (CA)in different spectrum bands to meet the International MobileTelecommunications Advanced (IMT-Advanced) requirements.I. I NTRODUCTIONConvergence of mobile and internet puts pressure on mobileservice providers to offer faster and more efficient mobileinternet access. Today, High Speed Packet Access (HSPA)networks are delivering high volumes of data transactions.However, the growth in video downloads and the increase indata usage due to smart phones will require larger air interfacebandwidths. Long Term Evolution or LTE, on the other hand,is the evolution of HSPA, which was first standardized in3GPP Release 8 to support larger bandwidths [1]. One ofthe requirements of LTE was to provide higher averaged userthroughput. It was specified to deliver services with highefficiency based on Internet Protocol (IP). Unlike HSPA,LTE adopts Orthogonal Frequency Division Multiple Access(OFDMA) in the downlink and Single Carrier FrequencyDivision Multiple Access (SC-FDMA) in the uplink directionfor resource sharing among multiple users. These multiple accesses increase network capacity and user throughput becauseof multi-user diversity gain. One of LTE features is that theoperators can select various spectrum bandwidths, e.g., 1.4, 3,5 10, 15, and 20 MHz depending on availability. 3GPP has further extended the original proposal of LTE, which is known asLTE-Advanced [2]. LTE-Advanced can be considered as oneof the prominent 4G proposals that has been specified by 3GPPin Release 10. LTE-Advanced should, however, provide abackward compatibility in terms of spectrum coexistence withRelease 8 based LTE. This means that it should be possibleto implement LTE-Advanced in a spectrum which is alreadyoccupied by LTE devices. Furthermore, LTE-Advanced willalso use the same radio interface technology as LTE.ITU has specified IMT-Advanced data rate requirementsof up to 1 Gbps and 500 Mbps in downlink and uplinkdirections, respectively, using Orthogonal Frequency-DivisionMultiplexing (OFDM) [3]. This could be achieved in 100 MHzband spectrum. However, one of the challenges that cellularoperators are facing today, especially in the UK, is to finda contiguous 100 MHz in a spectrum band which is suitablefor cellular based mobile communication use, i.e., below 3GHz. Therefore, 3GPP developed Carrier Aggregation (CA)technology in Release 10 as a potential solution for increasingthe LTE bandwidth to support higher data rates as required byIMT-Advanced [4]. With LTE CA, the operators can scale thespectrum bandwidth and aggregate more than two spectrumbands. The concept of CA has already been deployed inHSPA based cellular systems, under the name Dual CarrierHSPA (DC-HSPA), to aggregate two carriers in the downlinkand two in the uplink [5]. However, both carriers must becontiguous in the same spectrum band. Unlike DC-HSPA, LTECA can aggregate non-contiguous spectrums with differentbandwidths. In this paper, we will first analyse the performanceof single carrier LTE with different spectrum bandwidthsin various carrier frequencies. Thereafter, we will study theLTE-Advanced CA feature performance and compare it withRelease 8 LTE performance in different spectrum bands.This paper is structured as follows: Section II gives anoverview about carrier aggregation. Section III highlights thenetwork assumption that is adopted in this work and SectionIV presents results of our performance analysis. Finally, section V provides the summary and the concluding remarks.II. C ARRIER AGGREGATIONCarrier Aggregation or CA is one of the most importantLTE-Advanced features that have been recently standardisedby 3GPP as part of LTE Release 10 in order to satisfy the IMTAdvanced requirements. The CA feature allows the eNodeB
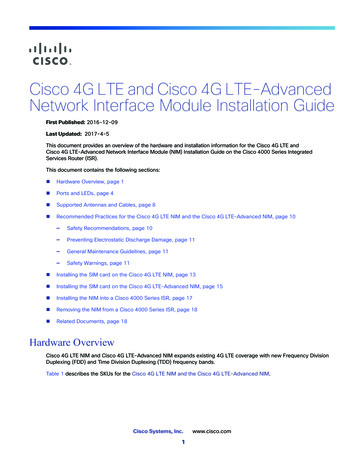
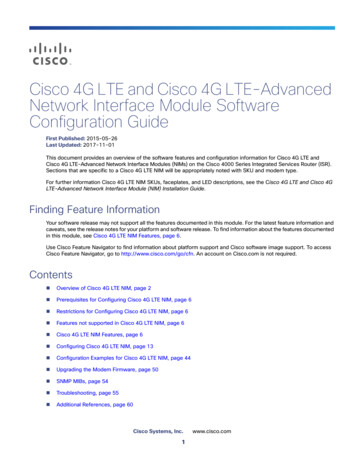
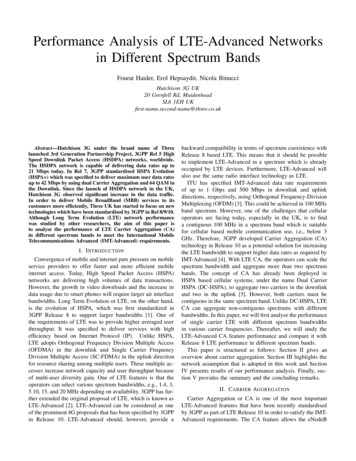
III. N ETWORK A SSUMPTIONIn this paper, a multi-cell system that has a layout ofhexagonal grid consisting of 19 sites with 3 sectors is considered. An eNodeB is located at each site location to enablethe communications between the User Equipment (UE) andthe network. Users are assumed to be indoor and distributeduniformly within the coverage of each cell, as shown inFig. 1. The minimum distance between the eNodeB andthe mobile user is assumed to be 50 m. Symmetric (i.e.,aggregating similar bandwidth) and non-contiguous LTE CAis considered in this work. For convenience, the eNodeBs andend users are indexed by the following sets that is, m M {1, ., M } and n N {1, ., N }, respectively. To supportthe opportunistic scheduling, the eNodeB gathers the ChannelQuality Information (CQI) from all users. LTE frame structureis considered, which consists of K physical Resource Blocks(PRBs), indexed by k 1,.,K. Each PRB is regarded as twelvecontiguous sub-carriers in frequency domain and seven OFDMsymbol in the time NB3134UE (285)2000Y coordinate [m]to aggregate more than one spectrum bands in order to supporthigh data rates in the downlink as well as uplink transmission.Each carrier component should handle independent trafficsthat are segmented at higher layers and then transmittedusing the physical layer resources of each carrier. This willrequire separate link level mechanisms (e.g., Hybrid automaticrepeat request HARQ) and control signaling for each carriercomponent.One of the main LTE-Advanced requirements is the backward compatibility with the earlier LTE Releases, i.e., Release8 and 9. LTE devices which do not support LTE-Advancedfeature can use one of the aggregated bands. The handsetssupporting the CA feature, i.e., Release 10 users, are ableto use multiple spectrum bands simultaneously to send andreceive data. Once a user is allocated multiple carriers i.e.10 MHz at 800 MHz and 20 MHz at 2.6 GHz bands, theeNodeB allocates the Physical Resource Blocks (PRBs) ineach carrier among the users by using opportunistic scheduling. Two types of scheduling method can be used: separatedor joint scheduling method [6]. In the separated mode, thescheduling algorithm is used independently on each carrier toallocate the PRBs among the users. Whereas in joint scheme,the scheduling algorithm will be performed jointly across allcarrier components.There are two different CA configurations that can be used inLTE-Advanced based cellular system [7]. Those are: Continuous CAIn this mode, the available multiple spectrum bands eachhaving 20 MHz are supposed to be adjacent to each other.For example, two 20 MHz bands are aggregated to form 40MHz band as a single spectrum. LTE networks adopt SCOFDMA in the uplink direction. Therefore, this mode willalso be used in the LTE-Advanced uplink to preserve the singlecarrier property. Non-continuous CAHerein, the aggregated carriers can either be non-contiguousin the same frequency band, e.g., 800MHz, (intra-band aggregation) or located in different frequency bands, e.g., 800 MHzand 2.6 GHz, ( inter-band aggregation) [8]. The radio channelcharacteristics such as path loss, building penetration loss andDoppler shift will vary significantly at different frequencybands which cause large differences on the received power.The impact of these variations could be minimized in thescheduler through Radio Resource Management B15eNB41eNB420eNBeNB22eNB4eNB1eNB1340 1000eNB56 2000eNB57eNB20eNB55 3000 3000Fig. 1.eNB17eNB19eNB53 4000eNB21eNB54 2000 1000eNB52eNB18eNB44eNB16eNB50eNB510eNB491000X coordinate [m]eNB45eNB43eNB47eNB482000eNB463000A snapshot of the simulated scenario.A. Channel ModelThe path loss model is based on a generic format that isrelevant to the practical scenario in urban areas. We assumethat the buildings are of nearly uniform height. Hence, thepath loss is calculated usingL(c) Ld (c) Lsh Lp (c)[dB](1)where c 1,.,C is the carrier index. L d , Lsh , and Lp are thedistance dependent path losses, the shadowing losses and thefrequency-dependent penetration losses. The L d is assumed tobe based on Okumura Hata model [9]. The shadowing lossis assumed to be log-normal distribution with zero mean andstandard deviation of 8 dB.A rayleigh channel model is used to generate a discrete timecorrelated fast fading channel [10]. Thus, number of complexvalued random Gaussian variables, which is equal to thenumber of taps in the channel delay profile, with zero meanand unit variance are generated. These complex Gaussianvalues are filtered by Doppler filter, that has a frequencyresponse of S(f ). The filter’s output will be interpolated usinga combination of a linear and polyphase algorithms. Eachtime delay in channel profile is then divided by the samplingtime (T s) of the system, rounded it to the nearest integer4000
number to form a discrete-time approximation channel model.A Discrete Fourier Transform (DFT) is finally performed toget the response of the channel in the frequency domain.B. Signal-to-Interference-plus-Noise-Ratio AnalysisThe received SINR for the channel eNodeB-UE link oncarrier component c in the PRB k at sub-frame t is givenbySINRmn (t, k, c) 2P lnm (c) hmn (t, k, c) Ioth (t, k, c) No(2)where P is the transmitted power from the serving eNodeB.lnm (c) is the linear-valued of the L(c) and h mn (t, k, c) are thecomplex channel gains, and N o is the noise power. Ioth (t, k, c)is the received power from the interfering cells which can becalculated using the followingIoth (t, k, c) M P lnq hqn (k, t, c) 2 .(3)q 1,q mNow, if we assume that the channels of different cells to oneparticular user are changing independently, then the envelopeof the combined interference variation, according to centrallimit theorem [11], will follow Gaussian distribution with zeromean and variance of σ 2 , N (0, σ 2 ). Hereby, the interferencecan be seen as additive white Gaussian noise, and it should bescaled appropriately. The variance of the interference σ 2 canbe expressed as σ 2 E[ Ioth (t, k, c)F ] M P l(c)qn F q(4)q 1,q mwhere F is the load factor (0 F 1) that associated witheach eNodeB [12] and E[.] is the expectation operation.C. Link level performanceDiscrete adaptive modulation schemes, i.e., quaternaryphase-shift keying (QPSK), 16 quadratic-amplitude modulation (QAM), and 64- QAM), are supported in this work.Coupling link and system level simulation to predict the BLERis very complex and time consuming. In this work, we usethe decoupled link and system simulation approach and usepreset values of link level simulation in the form of theSINR as function of Block Error Rate (BLER) for differentmodulation schemes to predict user throughput. The link-tosystem mapping table assumed here is based on ExponentialEffective SINR Mapping (EESM) [13]. The motivation behindEESM is to map the instantaneous channel quality (i.e. SINR)to a set of effective SINR eff . Those SINReff are used to estimatethe BLERs from a basic AWGN link level performance. Themaximum effective SINR that is mapped to the target BLERis selected. Subsequently, the Modulation and Coding Scheme(MCS) is selected [13]. Hence, K̄ 1 SINRk expSNReff β log(5) K̄ βk 1where β is the calibrated factor for a given MCS, K̄ is thenumber of allocated resource blocks for a particular user.Values for the parameter β for each MCS scheme, which havebeen derived from OFDM-based link-level simulations [14],are used in this work.D. Spectral Efficiency AnalysisMultiuser scheduling is performed to allocated K PRBs ineach carrier c to multiple users. the well-known ProportionalFair (PF) scheduling policy is considered in this work [15].With PF, the scheduler allocates the RB k of a carrier c attime t to user n N according to the following criterion:n̄mk (t, c) arg maxn NRnm (k, t, c),R̄nmk 1, ., K(6)R̄nm is the average delivered rate in the past, measured overa fixed window of observation. It can be calculated using anexponential average filtering. As mentioned earlier, there aretwo different ways to calculate the average throughput [6],either by separated scheduler or by joint scheduler. In theformer method, the eNodeB will account R̄nm for each carrier,i.e.,R̄nm R̄nm (t, c)(7)K 11Rnm (k, t, c) dm (1 )R̄nm (t 1, c) n (k, t, c)TTk 1where T is the time window constant, d n (k, t, c) is a binaryindicator that is set to 1 if the user n is scheduled on resourceblock k of carrier c at time t and to 0 otherwise. Whereasin the latter method, the eNodeB will calculate the averagethroughput over all aggregated spectrum. In other word,R̄nm C R̄nm (t, c)(8)c 1 (1 C K1 m1 m)R̄n (t 1) Rn (k, t, c) dmn (k, t, c).TT c 1k 1As a result of that, the total cell capacity (in bps/Hz/cell) afterallocating all RBs of all carriers to the selected users, can beexpressed asC N K1 mCm (t) Rn (k, t, c) dmn (k, t, c)B c 1 n 1(9)k 1where B is the system bandwidth.IV. S IMULATION R ESULTS AND D ISCUSSIONThe performance of LTE-Advanced networks in differentspectrum bands is evaluated using a dynamic system level simulator which is fully compliant with 3GPP LTE specifications[1]. Monte-Carlo based simulation is performed with severaliterations each having 5000 sub-frames. In each iterationmobile users are distributed independently and uniformly. Thecarrier bandwidths used in the simulations are 10 MHz and 20MHz. The site-to-site distance is 3000 m (Macro 3). Statisticsare gathered only in the center of the eNodeB coverage area
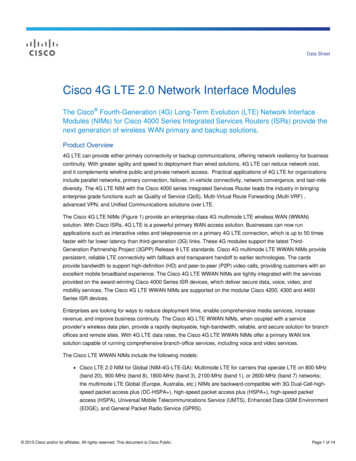
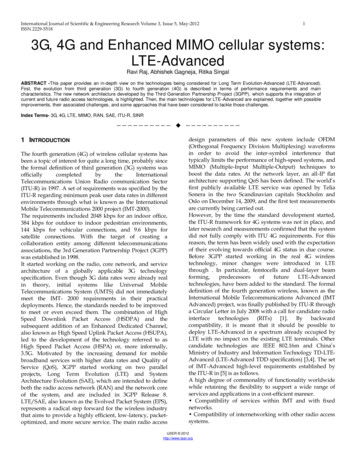
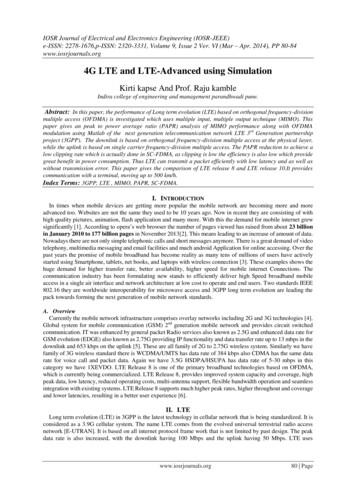
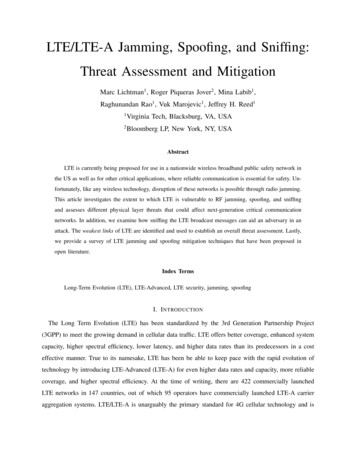
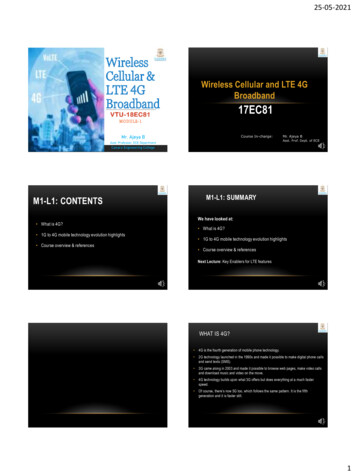
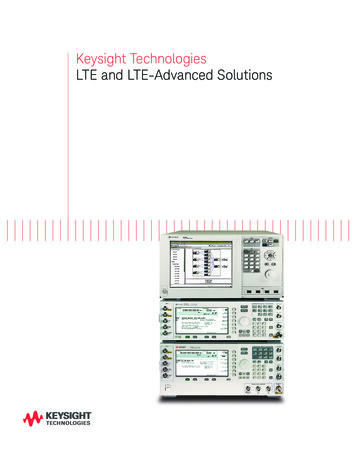
TABLE IS IMULATION PARAMETERSValue46 dBmLog-normal with 8 standard deviationPedB (with 6 taps)25 m18 dBi2 ms1 msfull buffer120 MHz @ 2600 MHz10 MHz @ 800 MHz0.80.6CDFParameterTransmitted powerShadowingChannel modelAntenna heightAntenna gainCQI delayTTITraffic typeLoad factor (F )10.40.2in order to have a fair influence of interference. Other relevantsimulation parameters are summarised in Table 1.000.51A. Single Carrier Performance AnalysisFig. 2 compares the cell throughput of 20 MHz at 2.6 GHzwith 10 MHz at 800 MHz in different load conditions. Thegraphs show that although the bandwidth doubles at 2.6 GHz,the cell throughput only increases 50%. This is mainly dueto the higher path loss at 2.6 GHz which requires higherresources from the eNodeB.22.533.544.5520Fig. 3.CDF of spectral efficiency.Carrier aggregation of 10 MHz at 800 MHz and 10 MHz at 2.6GHz based on Rel 10. In this simulation, each cell was loadedwith 10 users. All users are assumed to be supporting Release10 CA feature and they can be served by both carriers. Fig. 4shows that the cell throughput with aggregation of 10 MHz at800 MHz and 10 MHz at 2.6 GHz is 50% higher compared tosingle 20 MHz carrier at 2.6 GHz due to frequency diversity.11520MHz @ 2600 MHz10 MHz @ 800 MHz2X10 MHz CA0.820 MHz @ 2600 MHz10 MHz @ 800 MHz100.65CDFAverage cell througput [Mbps]25001.5Spectral efficiency [bps/Hz/cell]0.424681012No. of users141618200.2Fig. 2.Cell throughput comparison of 20 MHz and 10 MHz.00Fig. 3 compares the average spectral efficiencies of thenetwork in both spectrum bands. As it is clearly shown, thespectral efficiency of 10 MHz at 800 MHz outperforms the20 MHz at 2.6 GHz although it is half the bandwidth. Thesimulation results in individual bands show clearly that theperformance of the network at the lower frequency i.e. below1 GHz is higher than the corresponding high frequency operations i.e. 2.6 GHz. Carrier Aggregation will take advantageof both spectrum bands to improve the performance of thenetwork i.e. higher spectral efficiency below 1 GHz and largeravailable bandwidths at 2.6 GHz.B. Carrier Aggregation Performance AnalysisIn this analysis we compared a single carrier of 20 MHz at2.6 GHz LTE network based on 3GPP Rel 8 standards with1020Fig. 4.30405060Cell throughput [Mbps]708090100CDF of cell throughput.The user average throughput CDFs are presented in Fig5. It can be observed that the percentage of cell edge userthroughput for single carrier component of 10 MHz bandwidthat 800MHz is higher compared with 20 MHz at 2.6 GHz case.This is due to high path loss at 2.6 GHz and high buildingpenetration loss. On the other hand, the users located near theeNodeB have higher throughput at 2.6 GHz compared with800 MHz since they can access to larger bandwidth at goodsignal levels. The averaged user throughput in the coveragearea was also analysed when the CA was applied, In thisanalysis, joint PF scheduling algorithm was used to aggregate
V. C ONCLUSIONS10.820 MHz @ 2600 MHz10 MHz @ 800 MHz2X10 MHz CACDF0.60.40.200246810Average user throughput [Mbps]Fig. 5.12CDF of user throughput.10 MHz at 800 MHz band and 10 MHz at 2.6 GHz. As shownin Fig. 5 the user throughput CDF with CA in the coveragearea is superior compared to single band operation using thesame total bandwidths due to multi-diversity gain.The average user throughput CDFs of separated and jointscheduling schemes are compared in Fig. 6 for Release 8with 10 user. In each cell, we assume that there are 15 activeusers with 40% Release 10 users. Release 8 users are assignedequally in each carrier. As it is shown in Fig. 6, the Release 8users have higher user throughput gain when joint schedulingis employed. However, Release 10 user throughput will beworse with joint scheduling algorithm. The reason is that whenRelease 10 users are scheduled using joint scheduling scheme,the eNodeB scheduler calculates the average throughput in pastusing Eq. (8) for both carriers. As a result, the fairness betweenRelease 8 and Release 10 will increase. In case of separatedscheduling, the scheduler uses an independent PF metric toallocate best PRBs in each spectrum band to all user types.10.8Joint PFSeparated PFRelease 8 usersCDF0.60.4Release 10 users0.20012Fig. 6.34567Average user throughput [Mbps]CDF of user throughput.8910The aim of this study was to investigate the performance ofan LTE-Advanced based cellular network in different spectrumbands. We first analysed the performance of a single carrierin different bandwidths in two different spectrum bands, 800MHz and 2.6 GHz. The simulations showed that an increasedsystem bandwidth might not necessarily result in a highersystem throughput. Hence, the simulation results demonstratedthat in some cases, low frequency, i.e. 800 MHz, systemwas superior to a high frequency deployment i.e. 2.6 GHzalthough the operating bandwidth at 800 MHz was half of2.6 GHz band. However, the deployment of CA-based systemwould increase the cell and user throughput significantly byextending the operating bandwidth in the network. Therefore,LTE-Advance is a strong candidate to deliver IMT-Advancedrequirements. However, the increase in the performance shouldbe fair for all Release 8,9 and 10 users. This depends on howthe operator want to treat the user categories. It also dependson radio resource allocation algorithms that are employed atthe eNodeB. Our future works will focus on the optimumcarrier allocation using different scheduling algorithms andoptimizing the fairness between users supporting different3GPP Releases simultaneously.ACKNOWLEDGMENTThis work is supported by Hutchison 3G in the UK.R EFERENCES[1] 3GPP, TS 36.201 V8.3.0 ,“Evolved Universal Terrestrial Radio Access (EUTRA); LTE Physical Layer - General Description,” Rel. 8, Mar. 2009.[2] 3GPP, TR 36.912 V 10.0.0,“Feasibility study for Further Advancementsfor EUTRA (LTE-Advanced),” Rel. 10, Mar. 2010.[3] ITU-R Rec. M.2134, “Requirements Related to Technical Performancefor IMT-Advanced Radio Interface(s),” 2008.[4] 3GPP, TR 36.808 V 1.0.0,“Carrier Aggregation; Base Station (BS) radiotransmission and reception ,” Rel. 10, Dec. 2010.[5] 3GPP,TR 25.825 V1.0.0, “Dual-cell HSDPA operation”, Rel.8, May 2008.[6] Y. Wang, K. Pedersen, T. andrensen, and P. Mogensen, “Carrier loadbalancing and packet scheduling for multi-carrier systems,” IEEE Trans.Wireless Commun., vol. 9, no. 5, pp. 17801789, May 2010.[7] G. Yuan, X. Zhang, W. Wang, and Y. Yang, “Carrier aggregation for LTEAdvanced mobile communication systems,” IEEE Commun. Magazine,vol. 48, no. 2, pp. 8893, Feb. 2010.[8] 3GPP, TR 36.815 V9.1.0, “Further advancements for E-UTRA LTEAdvanced feasibility studies in RAN WG4”, Rel. 10, Jun. 2010.[9] H. Holma and A. Toskala, LTE for UMTS OFDM and SC-FDMA basedradio acess, 1st ed. John Wiley and Sons, 2009.[10] P. B. M. Jeruchim and K. Shanmugan, Simulation of Communication System Modeling, Methodology, and Techniques, 2nd ed. KluwerAcadimic/Plenum, 2000.[11] P. V. Mieghem, Performance Analysis of Communications Networks andSystems, 1st ed. Cambridge University Press, 2006.[12] S. Plass, X. G. Doukopoulos, and R. Legouable, “Investigations on linklevel inter-cell interference in OFDMA systems,” in Symp. Commun. andVeh. Technology, pp. 4952, Nov. 2006.[13] A. Krishnamoorthy, Y. Blankenship, P. Sartori, K. Baum, and B. Classon,“Enhanced link adaptation methods for wireless multi-carrier systems,”Proc. IEEE VTC2007-Spring, pp. 19111915, Apr. 2007.[14] 3GPP, WG1 R1-061506,“System analysis of the impact of CQI reportingperiod in DL SIMO OFDMA,” V7.1.0, May 2006.[15] A. Jalali, R. Padovani, and R. Pankaj, “Data throughput of CDMA-HDRa high efficiency-high data rate personal communication wireless system,”in Proc. IEEE VTC00-Spring, May 2000.
LTE-Advanced [2]. LTE-Advanced can be considered as one of the prominent 4G proposals that has been specified by 3GPP in Release 10. LTE-Advanced should, however, provide a backward compatibility in terms of spectrum coexistence with Release 8 based LTE. This means that it should be possible to implement LTE-Advanced in a spectrum which is .