Transcription
USDALake Waco-Bosque River InitiativeFate and Transport of SolubleReactive Phosphorus in the NorthBosque River of Central TexasAnne McFarland, Larry Hauck, and Richard KieslingTR0101February 2001Texas Institute for Applied Environmental ResearchTarleton State University Box T0410 Tarleton Station Stephenville, Texas 76402254.968.9567 FAX 254.968.9559 info@tiaer.tarleton.edu
Fate and Transport of Soluble Reactive PhosphorusAcknowledgementsFunding sources for this study include the United States Department of Agriculture - NaturalResources Conservation Service, the Clean Rivers Program of the Texas Natural ResourceConservation Commission, the United States Environmental Protection Agency, and the Stateof Texas. The authors acknowledge the support and dedicated work of the many fieldpersonnel and laboratory chemists involved with the monitoring program, particularly sincerain often falls on weekends requiring staff to be on call seven days a week.Mention of trade names or commercial products does not constitute their endorsement.For more information about this document or any other TIAER documents, send e-mail toinfo@tiaer.tarleton.edu.AuthorsAnne McFarland, Research Scientist, TIAER, mcfarla@tiaer.tarleton.eduLarry Hauck, Assistant Director of Environmental Sciences, TIAER, hauck@tiaer.tarleton.eduRichard Kiesling, Research Scientist, TIAER, kiesling@tiaer.tarleton.eduUSDA02.062
Fate and Transport of Soluble Reactive PhosphorusAbstractPhosphorus (P) forms at sampling sites along the North Bosque River in central Texas wereevaluated to determine the fate of soluble reactive phosphorus (SRP) at different points alongthe river during base and storm flow. Base flow samples were evaluated at eight sites andstorm event samples at five sites for data collected between February 4, 1997 and July 31, 1998.The highest concentrations of soluble reactive phosphorus (SRP) and total P (TP) and higherproportions of SRP to particulate P (PP) occurred in the upper portion of the North BosqueRiver during base and storm flow. About 95 percent of all P transported along the NorthBosque River occurred during storm events. Although loadings increased with flow along theNorth Bosque River, a general decrease in SRP and TP concentrations was indicated fromupstream to downstream sites for base and storm conditions. To assess the potential for Ptransformations in transport along the North Bosque River, inflow contributions between twosets of upstream and downstream sites were evaluated for selected storm events and forcumulative daily loadings for an extended time period of November 1, 1995 through July 31,1998. During storm events, dilution from contributing tributaries appeared to explain most ofthe noted decrease in P concentrations between upstream and downstream sites. At baseflow, dilution as well as retention via transformations were involved in explaining thedecrease in P concentrations. At base flow, a noticeable depletion of SRP occurred incumulative daily loadings. This depletion in SRP is most likely associated with uptake byaquatic plants and algae and the binding of SRP with sediment particles. A depletion of TPwas also indicated during base flow. This depletion of TP was expected with removal of SRPfrom the water column by attached plants and algae. The depletion of TP was also associatedwith an increased settling of sediment bound PP as noted by a slight depletion in cumulativeTSS loadings during low flow conditions. The cumulative depletion or retention of P in theNorth Bosque River at base flow is temporary, because storm events resuspend and transportretained PP downstream. While some transformations of soluble P to PP occur under lowflow conditions, the majority of the SRP transported along the North Bosque River occursduring storm events and appears to arrive at Lake Waco, the receiving water body, withoutundergoing significant biological or geochemical transformations.3
Fate and Transport of Soluble Reactive Phosphorus4
ContentsChapter 1 Introduction . . . . . . . . . . . . . . . . . . . . . . . . . . . . . . . . . . . . . . . . . . . . . . . . . . . . . . . . . . . . . . . . . . 11Chapter 2 Sites on the North Bosque River . . . . . . . . . . . . . . . . . . . . . . . . . . . . . . . . . . . . . . . . . . . . . . . . 17Chapter 3 Data Collection and Laboratory Methods . . . . . . . . . . . . . . . . . . . . . . . . . . . . . . . . . . . . . . . . 21Chapter 4 Data Analysis Methods . . . . . . . . . . . . . . . . . . . . . . . . . . . . . . . . . . . . . . . . . . . . . . . . . . . . . . . . 23Chapter 5 Precipitation Conditions . . . . . . . . . . . . . . . . . . . . . . . . . . . . . . . . . . . . . . . . . . . . . . . . . . . . . . . 27Chapter 6 Results and Discussion . . . . . . . . . . . . . . . . . . . . . . . . . . . . . . . . . . . . . . . . . . . . . . . . . . . . . . . . 29Spatial Variability in P Concentrations and Forms . . . . . . . . . . . . . . . . . . . . . . . . . . . . . . . . . . . . . . . . . . . . .Correlation of Water Quality to Flow Conditions . . . . . . . . . . . . . . . . . . . . . . . . . . . . . . . . . . . . . . . . . . . . . .P Loading During Base Flow Versus Storm Events . . . . . . . . . . . . . . . . . . . . . . . . . . . . . . . . . . . . . . . . . . . . .Inflow Impacts During Storm Events . . . . . . . . . . . . . . . . . . . . . . . . . . . . . . . . . . . . . . . . . . . . . . . . . . . . . . . .Cumulative Daily Volumes and Loadings . . . . . . . . . . . . . . . . . . . . . . . . . . . . . . . . . . . . . . . . . . . . . . . . . . . .2932383945Chapter 7 Conclusions . . . . . . . . . . . . . . . . . . . . . . . . . . . . . . . . . . . . . . . . . . . . . . . . . . . . . . . . . . . . . . . . . . 55References . . . . . . . . . . . . . . . . . . . . . . . . . . . . . . . . . . . . . . . . . . . . . . . . . . . . . . . . . . . . . . . . . . . . . . . . . . . . 57Appendix A Summary of Storm Events Monitored Between February 1997 and July 1998 . . . . . . 61Appendix B Summary of Storm Events Monitored Between November 1995 and January 1997 . . 65Appendix C Average Monthly Discharge from WWTPs along the North Bosque River . . . . . . . . 675
Fate and Transport of Soluble Reactive Phosphorus6
TablesTable 1Table 2Table 3Table 4Table 5Table 6Table 7Table 8Table 9Table 10Table 11Table 12Table 13Table 14Table 15Table 16Table 17Table 18Table 19Table 20Table 21Table 22Table 23Table 24Table 25Permitted point source discharges to the North Bosque River. . . . . . . . . . . . . . . . . . . . . . . . . . . . . . . . . .Land uses above sampling sites along the North Bosque River. . . . . . . . . . . . . . . . . . . . . . . . . . . . . . . .Monitoring history for sampling sites along the North Bosque River. . . . . . . . . . . . . . . . . . . . . . . . . . .Total monthly rainfall for selected National Weather Service Observer Stations. . . . . . . . . . . . . . . . . .Basic statistics of stream flow associated with routine grab samples. . . . . . . . . . . . . . . . . . . . . . . . . . . .Municipal wastewater treatment plant effluent characteristics. . . . . . . . . . . . . . . . . . . . . . . . . . . . . . . . .Cross correlation of flow and concentration data for base flow samples at BO020. . . . . . . . . . . . . . . .Cross correlation of volume and concentration data for storm events at BO020. . . . . . . . . . . . . . . . . .Cross correlation of flow and concentration data for base flow samples at BO040. . . . . . . . . . . . . . . .Cross correlation of volume and concentration data for storm events at BO040. . . . . . . . . . . . . . . . . .Cross correlation of flow and concentration data for base flow samples at BO070. . . . . . . . . . . . . . . .Cross correlation of volume and concentration data for storm events at BO070. . . . . . . . . . . . . . . . . .Cross correlation of flow and concentration data for base flow samples at BO090. . . . . . . . . . . . . . . .Cross correlation of volume and concentration data for storm events at BO090. . . . . . . . . . . . . . . . . .Cross correlation of flow and concentration data for base flow samples at BO100. . . . . . . . . . . . . . . .Cross correlation of volume and concentration data for storm events at BO100. . . . . . . . . . . . . . . . . .Flow at North Bosque River sites categorized as storm, base, or dry . . . . . . . . . . . . . . . . . . . . . . . . . . .Estimated loadings by type of flow along the North Bosque River . . . . . . . . . . . . . . . . . . . . . . . . . . . . .Drainage area and river miles between sites BO040 and BO070 and sites BO070 and BO090 . . . . . . .Storm concentrations for tributaries between sites BO040 and BO070 . . . . . . . . . . . . . . . . . . . . . . . . . .Land use of monitored tributaries compared to drainage area between BO040 and BO070. . . . . . . . .Calculated inflow storm volume (equation 1) and concentrations (equation 2) . . . . . . . . . . . . . . . . . .Storm concentrations for tributaries between sites BO070 and BO090 and area-weighted inflow. . .Land use of monitored tributaries compared to drainage area between sites BO070 and BO090 . . . .Calculated inflow storm volume (equation 1) and concentrations (equation 2) . . . . . . . . . . . . . . . . . 5Table A–1Summary of storm events monitored between February 1997 and July 1998 . . . . . . . . . . . . . . . . . . . 61Table B–1Summary storm events monitored between November 1995 and January 1997 . . . . . . . . . . . . . . . . . 65Table C–1Average monthly effluent discharge from municipal wastewater treatment plants . . . . . . . . . . . . . 677
Fate and Transport of Soluble Reactive Phosphorus8
FiguresFigure 1 TIAER sampling sites on the North Bosque River. . . . . . . . . . . . . . . . . . . . . . . . . . . . . . . . . . . 11Figure 2 Classified stream segments within the Bosque River watershed. . . . . . . . . . . . . . . . . . . . . . . 12Figure 3 Monthly precipitation and departure from normal for Stephenville and Waco Dam. . . . . 28Figure 4 Geometric mean values for SRP, TP, and TSS at sites along the North Bosque River. . . . . 30Figure 5 Percent of TP represented by soluble (SRP) and particulate (PP) forms. . . . . . . . . . . . . . . . . 32Figure 6 Volume-weighted mean concentrations and mass loadings as a percent of total. . . . . . . . . 40Figure 7 Cumulative daily volume of flow for sites and the inflowing area between sites . . . . . . . . 46Figure 8 Daily average flow at sites BO040, BO070 and BO090 on the North Bosque River. . . . . . . . 47Figure 9 Cumulative daily loading of SRP for sites and the inflowing area between sites . . . . . . . . . 48Figure 10 Cumulative daily loading of TP for sites and the inflowing area between sites . . . . . . . . . . 49Figure 11 Relationship of daily SRP loading for the inflow between sites BO040 and BO070 . . . . . . . 50Figure 12 Cumulative daily loading of TSS for sites and the inflowing area between sites . . . . . . . . . 51Figure 13 Impact of WWTP discharge on cumulative daily volume and loadings . . . . . . . . . . . . . . . . 529
Fate and Transport of Soluble Reactive Phosphorus10
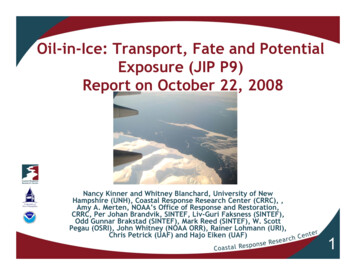
CHAPTER 1IntroductionThe North Bosque River begins just north of Stephenville, Texas, and continues to Lake Waconear Waco, Texas, a length of over 257 kilometers (160 miles; Figure 1). The North BosqueRiver watershed encompasses nearly 316,600 hectares (782,000 acres) in north central Texasand represents 74 percent of the drainage area to Lake Waco. The North Bosque River isimportant as the dominant source of water to Lake Waco, a public water supply for a servicepopulation of about 150,000 people. With increasing concerns about the availability of groundwater, small municipalities along the North Bosque River are exploring the use of surfacewater. For example, Clifton (estimated population 3,600) has built an off-stream reservoir totake advantage of surface water from the North Bosque River, and Meridian (estimatedpopulation 1,500) is considering the use of surface water from the North Bosque River forpublic water supply.Figure 1 TIAER sampling sites on the North Bosque River.11
Fate and Transport of Soluble Reactive PhosphorusAn increasing focus on water quality within the North Bosque River has accompaniedincreasing interest in its use. In 1990, the North Bosque River watershed was identified as animpacted watershed due to nonpoint source pollution (Texas Water Commission and TexasState Soil and Water Conservation Board, 1991). Segments 1226 and 1255 along the NorthBosque River have been on the Texas 303(d) list of impaired waters prepared by the TexasNatural Resource Conservation Commission (TNRCC) since 1992 (Figure 2). Segment 1226 isdefined as the North Bosque River from a point 100 meters (328 feet) upstream of Farm-toMarket Road 185 in McLennan County near Lake Waco to a point immediately above theconfluence of Indian Creek in Erath County (TNRCC, 1996). Designated water uses forsegment 1226 include contact recreation, high aquatic life, and public water supply. Segment1255 is defined as the North Bosque River from a point immediately above its confluence withIndian Creek to the confluence of the North and South Forks of the North Bosque River aboveStephenville. Designated uses for segment 1255 include contact recreation and intermediateaquatic life use.Figure 2 Classified stream segments within the Bosque River watershed.12
Chapter 1 IntroductionSegments 1226 and 1255 were included in the Clean Water Act Section 303(d) list for Texas asimpaired water bodies under narrative water quality standards related to nutrients andaquatic plant growth (TNRCC, 2000). The TMDL effort for segments 1226 and 1255 is focusingon nutrients due to the role of nutrients in promoting excessive algae growth as indicated byelevated chlorophyll-α levels all along the North Bosque River (TNRCC, 1999). In September2000, the TNRCC released two TMDLs for the North Bosque River for public review (TNRCC,2000). Phosphorus is identified as the nutrient limiting the growth of aquatic plants, and abouta 50 percent reduction in loading of soluble reactive P is proposed along both segments.Nutrients are a concern in surface waters because excessive nutrients can cause accelerated or“cultural” eutrophication. Eutrophication refers to increased productivity of algae associatedwith nutrient enrichment and is a natural process in aquatic systems, but when accelerated byhumans, eutrophication can lead to an overabundance of aquatic plant biomass or algalblooms. From a water quality perspective, algal blooms are undesirable because they cansignificantly increase water treatment costs, particularly in small reservoirs, by increasingfiltration and disinfecting requirements (Walker, 1983). Some algae release undesirablesubstances, such as geosmin from Oscillatoria chalybea or 2-methylisoborneol (MIB) fromAnabaena circinalis (Izaguirre et al., 1982). Geosmin and MIB are associated with taste and odorproblems in drinking water that are very costly to treat. Further, the chlorination step oftenused in water treatment may form chlorinated hydrocarbons, such as trihalomethanes, whichare a potential health risk because they exhibit, or are suspected of having, carcinogenic and/or mutagenic properties (Palmstrom et al., 1988; Martin and Cooke, 1994). These undesirablechlorination by-products increase with increases in organic matter and ammonia from thedecay of algae (Rook, 1976). From an ecosystem perspective, algal blooms can cause largediurnal swings in the amount of dissolved oxygen in a water body. Algae continuously useoxygen for respiration, but only during the day do algae replenish oxygen to the water viaphotosynthesis. As the algae from a bloom die off, the decomposition of large amounts ofdead algae can further deplete oxygen supplies. These decreased oxygen levels can cause fishkills (Boyd, 1990). Decomposition of cyanobacteria (blue-green algae) blooms are furtherdetrimental in that they may release toxins that are threatening to livestock and humans ifconsumed (Codd, 1995).While the presence of some algae is necessary in maintaining a balanced aquatic ecosystem,avoiding eutrophic situations is generally desirable. It is thus helpful to understand some ofthe factors regulating algal growth. In most freshwater systems, phosphorus (P) is thelimiting nutrient to the growth of algae (Gibson, 1997). Although nitrogen and even carbonlimitation can occur, particularly in smaller pond systems (Boyd, 1990), P limitation is mostoften documented in freshwater lake and stream systems (Klotz, 1991). Relatively little P isrequired for the biomass production of algae. An average molar equivalent often quoted foralgal tissue is the Redfield Ratio of carbon (C), nitrogen (N), and P of 106C:16N:1P (Redfield,1958). Although the actual ratio of C:N:P will vary by species and even trophic status of thewater body (Harris, 1986), the Redfield Ratio remains a good general relationship forevaluating the nutrient needs of algae. Algal bioassay experiments for limiting nutrientsfurther indicate that phosphorus supplies most likely limit the growth of algae in Lake Waco(Dávalos-Lind and Lind, 1999) and at sites along the North Bosque River (Matlock andRodriguez, 1999). The bioavailability of phosphorus within the North Bosque River and thatreaching Lake Waco is, thus, a very important consideration in evaluating the potential foraccelerated algal growth along the North Bosque River and in Lake Waco.Forms of phosphorus are non-conservative and can undergo many biogeochemical changesduring transport along a waterway. In rather rough terms, phosphorus can be categorized assoluble phosphorus and particulate phosphorus (PP). Soluble phosphorus is approximated inthis research as soluble reactive phosphorus (SRP) or phosphorus that will pass through a 0.45µm pore filter and is reactive with molybdate (NRC, 1993). SRP primarily consists of13
Fate and Transport of Soluble Reactive Phosphorusorthophosphate and is also referred to as dissolved reactive phosphorus (NRC, 1993).Inorganic PP is associated with the mineral fraction and primarily involves the binding of Pwith aluminum, iron, or calcium compounds. Organic PP forms include such compounds asphospholipids, nucleic acids, and humic acids (Nelson and Logan, 1983). The pools of PP andSRP are not static in surface waters. SRP may be taken up by plants, algae, and/or bacteria orbound by minerals on and into sediment particles. Portions of PP are moderately labile andmay flux between soluble and particulate forms. P has no significant atmospheric fluxes,unlike N, and exists in only one valance state in its solid and liquid phases (Stevenson, 1986).P characterization in aquatic systems, thus, deals primarily with fluxes of P betweensediments and solution, and plant and animal uptake and decay.There are two primary modes of interaction of dissolved phosphate with fluvial inorganicsediments (Froelich, 1988). One mode is via adsorption and desorption on particle surfacesprimarily through interactions with reactive iron and aluminum hydroxyoxides associatedwith natural clay particles. This reaction is generally fast (minutes to hours) and easilyreversible creating a moderately labile PP pool. The second mode is via solid-state diffusionof adsorbed phosphate from the surface to the interior of sediment particles. This reaction hasa much slower kinetic rate (days to months) and depends on the previous history of thesorption surface in relation to its sorption capacity and the chemistry of the solid diffusionlayer. The movement of P into the interior of sediment particles leads to a more stable andless easily reversible state that is generally considered unavailable for uptake by aquaticplants or animals.P forms may also change via biological uptake and release. SRP or loosely bound PP may betaken up by aquatic plants and animals and converted to organic P. As aquatic plants andanimals die and decay, this organic P is mineralized or reconverted to inorganic P as a cyclingprocess. While nutrient cycling occurs via the uptake, release, and re-uptake of nutrients, verylittle cycling occurs in place. Nutrients generated at one place on a stream are generallytransported downstream prior to reutilization (Newbold et al., 1983). Downstream transportand nutrient cycling are interrelated processes jointly referred to as nutrient spiralling due tothe continuous downstream displacement of nutrients as they cycle within the system(Mulholland et al., 1985). The amount of recycling that occurs generally depends on the rate offlow and the length of the river reach (Newbold et al., 1983).The purpose of this study is to determine the influence of natural assimilative processes in theNorth Bosque River on its loading of bioavailable P to Lake Waco. The significance of thisstudy arises from several interrelated facts and concerns. Facts known about the watershedinclude: The algal community within Lake Waco is limited by P (Dávalos-Lind and Lind, 1999) The North Bosque River is the major source of P to Lake Waco (McFarland and Hauck,1999) The two major sources of bioavailable P in the North Bosque River are dairy operationsand the Stephenville wastewater treatment plant, both of which are located in the upperportion of the watershed (McFarland and Hauck, 1999)In relation to these facts, further investigation is needed to assess the following questions:14 Is soluble phosphorus, which is loaded in the upper portion of the watershed, still solubleand bioavailable to algae by the time it reaches Lake Waco or do transformations occurmaking this phosphorus less available? Are in-stream processes important to include in watershed nutrient loading models forpredicting the impact of land use changes on water quality?
Chapter 1 Introduction Do differences in flow (i.e., base versus storm flow) influence differently the impact ofriver transport and assimilation on the delivery of bioavailable P within the North BosqueRiver watershed? Are the type of soluble P loading (continuous point source versus stochastic nonpointsource contributions) and the location of the source contribution important factors in thedelivery of bioavailable P to Lake Waco?While it is beyond the scope of this study to completely answer these questions, themonitoring data set collected by the Texas Institute for Applied Environmental Research(TIAER) does allow a preliminary investigation. Monitoring data of flow and water qualitycollected during base flow and storm events will be used to evaluate the following questions: Is there spatial variability in P concentrations and forms at sites on the North BosqueRiver? Are P concentrations of SRP, PP, and total-P correlated to flow conditions? How much of the P load (TP and SRP) in the North Bosque River is transported duringbase flow versus storm events? Is dilution from inflowing tributaries or P transformations responsible for the decrease inSRP concentrations from upstream to downstream sites during storm events? Do transformations of soluble P to particulate P occur during storm events and/or baseflow and, if so, what is the magnitude of these transformations?While the monitoring program was not designed to directly answer these questions,important insights may be gleaned through prudent data evaluation. The purpose of thisreport is to evaluate monitoring data collected by TIAER at sites along the North Bosque Riverwithin the context of known in-stream transport and biogeochemical processes forphosphorus. The goal is to ascertain the fate of phosphorus, particularly SRP, at differentpoints in the North Bosque River during base flow and storm events and to discuss thepotential impact of in-stream transformations and transport processes on P loadings andbioavailability from the North Bosque River to Lake Waco.15
Fate and Transport of Soluble Reactive Phosphorus16
CHAPTER 2Sites on the North Bosque RiverSampling on the North Bosque River is conducted at eight sites (BO020, BO040, BO070,BO060, BO080, BO085, BO090, and BO100) beginning upstream at BO020, located aboveStephenville, and continuing downstream to BO100, located near Valley Mills (Figure 1).Routine grab samples are collected at all eight sites. Storm sampling using automaticsamplers occurs at five sites—BO020, BO040, BO070, BO090, and BO100. The land within theNorth Bosque River watershed is primarily rural, although six cities are located along theNorth Bosque River. These cities in an upstream to downstream order are Stephenville(16,000),1 Hico (1,500), Iredell (370), Meridian (1,500), Clifton (3,600), and Valley Mills (1,200).Each of these cities is permitted to discharge wastewater treatment plant (WWTP) effluentinto the North Bosque River (Table 1). Biweekly grab samples of the WWTP effluents arecollected to characterize these discharges.Table 1 Permitted point source discharges to the North Bosque ellPermitted Daily AverageDischarge(m3/day)Permitted Daily AverageDischarge(million gallons per on2,4600.65Valley Mills1,3630.36General land use descriptions indicate a decreasing trend in the amount of permanent pastureand dairy waste application fields and an increasing trend in the amount of land categorizedas wood/range and cropland from BO020 to BO100 (Table 2). Land use for the watershed isbased on Landsat Thematic Mapper imagery classification processed into a GeographicInformation System (GIS) layer by the U.S. Department of Agriculture (USDA)-NaturalResources Conservation Service Texas State Office in Temple, Texas. The land use data layerwas developed from an August 1992 overflight for Erath County and a June 1996 overflightfor Bosque, Coryell, Erath, Hamilton, and McLennan counties which were updated withextensive ground truthing occurring in January through April 1998. Information on dairywaste application fields was obtained from dairy permits and dairy waste management planson file with TNRCC and overlaid on the general land use data layer to represent a separateland use category. The data on dairy waste application fields represents information as ofJanuary 1995. The size of the drainage area above sampling sites was delineated from an U.S.Geological Survey (USGS) 1:24,000 digital elevation map.1Numbers in parentheses represent the estimated population of each city as presented in the 199899 Texas Almanac (Dallas Morning News, 1997).17
Fate and Transport of Soluble Reactive PhosphorusTable 2 Land uses above sampling sites along the North Bosque River.Wood/ Range(%)Pasture(%)Cropland(%)Dairy WasteAppl. Fields(%)Urban(%)Other(%)Drainage .43.11.40.1302,320SiteThe location of each sampling site is described below.North Bosque River above Stephenville (site BO020) Site BO020 is located on the NorthBosque River below the confluence of the North and South Forks at the crossing of StateHighway 8 on the northeast boundary of Stephenville. Site BO020 is located near thebeginning of the North Bosque River and contains a small portion of the city of Stephenville inits drainage area.North Bosque River below the Stephenville Wastewater Treatment Plant (site BO040) SiteBO040 is located on the North Bosque River about 400 meters (1,300 ft) below the Stephenvillewastewater treatment plant (WWTP). Site BO040 is located at the crossing of County Road(CR) 454 about 8 river kilometers (5 river miles) below site BO020.North Bosque river near Green Creek (site BO060) Site BO060 is located on the NorthBosque River about 23 river kilometers (14 river miles) downstream of site BO040 at thecrossing of CR 248.North Bosque River at Hico (site BO070) Site BO070 is located near USGS station 08094800on the North Bosque River at the crossing of U.S. Highway 281 in Hico, Texas. The drainagearea of this site is referred to as the upper North Bosque River watershed in most TIAER dataanalysis reports (e.g., McFarland and Hauck, 1995; 1997). BO070 is located about 34 riverkilometers (21 river miles) downstream of site BO040. Site BO070 is above the Hico WWTPeffluent discharge.North Bosque River at Iredell (site BO080) Site BO080 is located on the North Bosque Riverbelow the confluence of Duffau Creek and above the WWTP effluent discharge for the city ofIredell. BO080 is located about 23 river kilometers (14 river miles) downstream of site BO070.North Bosque River at Meridian (site BO085) Site BO085 is located on the North BosqueRiver at Farm-to-Market (FM) Road 2840, west of Meridian, above the Meridian WWTPeffluent discharge. BO085 is located about 27 river kilometers (17 river miles) downstream ofBO080.North Bosque River at Clifton (site BO090) Site BO090 is located near USGS station08095000 on the North Bosque River near the crossing of FM Road 219 about a kilometernortheast of Clifton, Texas. BO090 is located about 23 river kilometers (14 river miles)downstream of BO085. Site BO090 is located above the Clifton WWTP effluent discharge.18
Chapter 2 Sites on the North Bosque RiverNorth Bosque River at Valley Mills (site BO100) Site BO100 is located south of the USGSstation 08095200 on the North Bosque River near the crossing of FM Road 56 northeast ofValley Mills. BO100 is located about 19 river kilometers (12 river miles) downstream of BO090and about 45 river kilometers (28 river miles) upstream from the mouth of the North BosqueRiver at Lake Waco. BO100 is located above the Valley Mills WWTP effluent discharge.19
Fate and Transport of Soluble Reactive Phosphorus20
CHAPTER 3Data Collection and LaboratoryMethodsRoutine grab sa
Tarleton State University Box T0410 Tarleton Station Stephenville, Texas 76402 254.968.9567 FAX 254.968.9559 info@tiaer.tarleton.edu. Fate and Transport of Soluble Reactive Phosphorus 2 Acknowledgements Funding sources for this study include the United States Department of Agriculture - Natural