Transcription
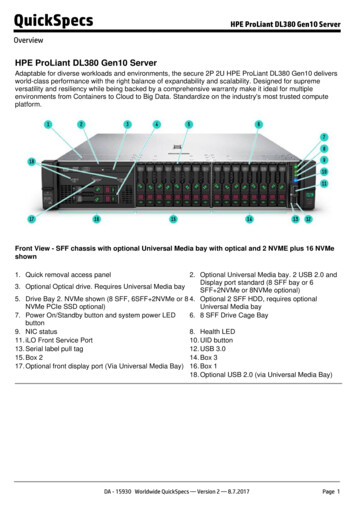
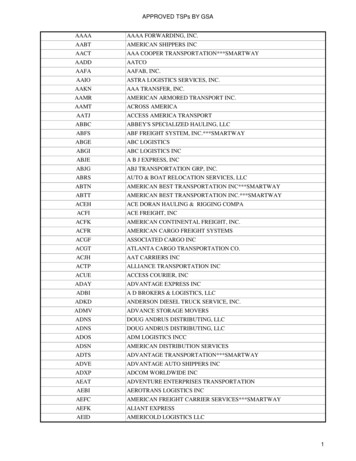
Reversal of BaffinBay TransportThrough Davis andNares StraitTowards the ArcticPaul G. Myers, Laura Castro de la Guardia, ChuanshuaiOceanFu, Laura C. Gillard, Nathan Grivault, Xianmin Hu, CraigM. Lee2, G.W.K. Moore3, Clark Pennelly, Mads H.Ribergaard4, Joy Romanski51 - Department of Earth and Atmospheric Sciences,University of Alberta2 – Applied Physics Laboratory, University ofWashington3 - Department of Physics, University of Toronto4 - Centre for Ocean and Ice, Danish MeteorologicalInstitute5 - NASA GISS, Columbia University Center forClimate Systems Research
OUTLINE Baffin Bay ANHA NEMO Configuration The Signal at Davis Strait, December 2010 Upstream Changes in the Labrador Sea Baffin Bay Impacts Discussion Summary
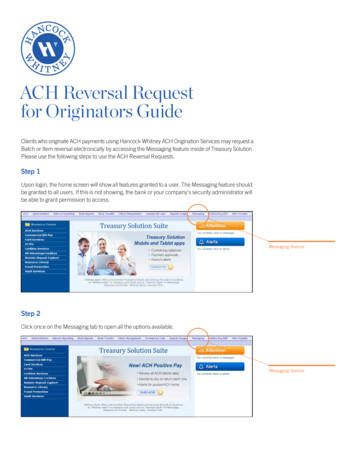
ANHA: Arctic and Northern Hemisphere AtlanticANHA12 & ANHA4Model : NEMO 3.4LIM2 EVPResolution : 1/12 degree¼ degreeMesh : 1632 x 2400544 x 80050 levelsANHA12LS : 5 km 15 kmCAA : 4 km 10 kmInitialization:3D T, S, U and V (GLORYS2v3, Jan02)Sea IceAtmospheric forcing:T2, Q2, U10, V10CGRFPrecipitationhourly33kmRadiation (SW & LW)Snow: Calculated from precipitationRunoff: Dai and Trenberth inter-annualGreenland Mass Loss (Bamber) Iceberg ModuleOBC: U, V, T and S (GLORYS2v3)NO temperature & salinity restoringJan 2002 – Dec 2019CGRF: CMC GDPS reforecastsGDPS: Global Deterministic Prediction SystemCMC: Canadian Meteorological CentreGLORYS: GLobal Ocean ReanalYses and Simulations
Model vs ObservationsTransport Evaluation
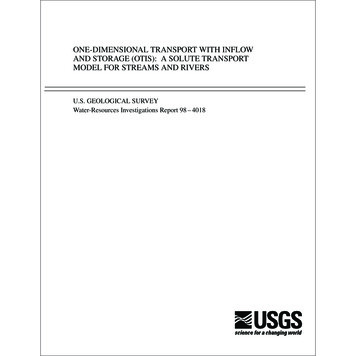
MODEL ARCTIC GATEWAY STRAITFRESHWATER TRANSPORT (REL. TO 34.8)Jones SoundBarrowNares StraitDavis StraitLEGEND Maroon – ERA5/HYPE/BT18 Blue – ERA5/DT/BT12 Cyan – GDPS/DT/BT12 All above with tides Red – ANHA12/DT/BT12 Black - Obs
DAVIS STRAIT TRANSPORTS
MEAN DEC-JAN TEMP.DEC 2010 – JAN 2011 TEMP.OTHER CHANGES AT THE DAVISSTRAIT ARRAY DEC 2010
LABRADOR SEA WINTER WINDS
LABRADOR SEA EKMANTRANSPORTS
AasiaatDAVIS STRAIT MODELHEAT TRANSPORTNuussuaq
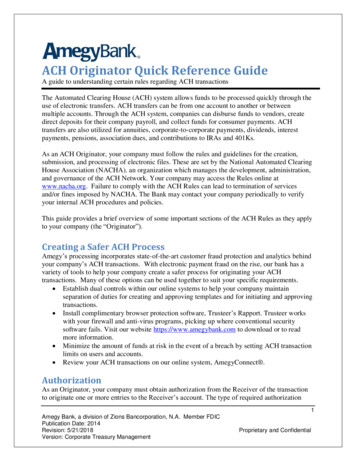
SSH ANOMALYBAFFIN BAY SSHAND HEATCONTENT DEC2010 – JAN 2011TOP 500 M HEATCONTENT ANOMALYMortensen et al.,2018, JGR –observationaltemp. – Nuuk,outer station(top), inner station(bottom)
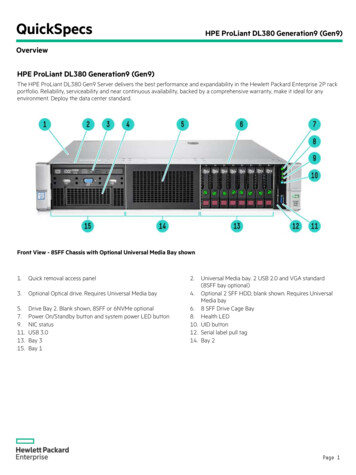
NARESSTRAITTRANSPORTANHA12 Output – Dec 31, 2010 Right: Lincoln Sea South: Smith SoundANHA12 Output – Dec 31, 2017 Right: Lincoln Sea South: Smith SoundGarcia-Quintanaet al., 2021, inpreparation
BAFFIN BAY CIRCULATION,WARM MODIFIED ATLANTICWATER AND TIDEWATERGLACIAL IMPACTJS – Jones Sound, SS – Smith Sound, NS – Nares Strait, LS – Lancaster Sound,DS – Davis Strait, BIC – Baffin Island Current, WGC – West Greenland CurrentHolland et al., 2008, Nature Geoscience
DJF BLOCKING INDEX (M)GREENLAND BLOCKINGINDEX (500MB GEOPOTENTIALHIGH – LOW INDEXHEIGHT AREA AVERAGED 60-80N,280-340E FROM THE DAILYAVERAGED NCEP/NCARREANALYSIS )HANNA ET AL. 2016 INT. J. CLIM.
FALL-WINTER (SONDJ)NAORED – ALL 5 MONTHSNEGATIVE Fits for 2010 event Fits for 1996 before JI retreatevent first reported byHolland et al Does NOT fit for end of2017 Greenland Island Rule – Joyce and Proshutinsky, 2007 Simple model to explain flow through Davis Strait Climatological Winds produce Cyclonic Flow aroundGreenland Increases during positive AO/NAO Phase But can decrease, or even reverse during anegative AO/NAO phase Suggest takes about 3 months to spin circulation up
SENSITIVITY TO RIVER RUNOFFStadnyk et al., 2021, ElementaTahya Weiss-Gibbons, ongoing MSc
MODEL ARCTIC GATEWAY STRAITFRESHWATER TRANSPORT (REL. TO 34.8)Jones SoundBarrowNares StraitDavis StraitLEGEND Maroon – ERA5/HYPE/BT18 Blue – ERA5/DT/BT12 Cyan – GDPS/DT/BT12 All above with tides Red – ANHA12/DT/BT12 Black - Obs
SUMMARY Transport (volume, heat and freshwater) reverses at bothDavis and Nares St, Dec 2010 Repeats in Dec 2017Seen in both observations and modelThe transport reversal was driven by anomalous winterwinds, and associated Ekman transport. over the LabradorSeaLeads to enhanced transport of warm waters by the WGCSignificant warm water enters Baffin Bay (and Lincoln Sea),impacting stratification and likely tidewater glaciersThe anomalous winds were associated with a record highof the Greenland Blocking Index and a change in thestorm trackGood example of using models to identify processes tofocus on in observational record
SUMMARY Transport (volume, heat and freshwater) reverses at both Davis and Nares St, Dec 2010 Repeats in Dec 2017 Seen in both observations and model The transport reversal was driven by anomalous winter winds, and associated Ekman transport. over the Labrador Sea Leads to enhanced transport of