Transcription
Assessment of Health Management InformationSystem (HMIS) Performance in SNNPR, EthiopiaHiwot Belay, Tariq Azim, Hailemariam KassahunSNNP Regional Health BureauMEASURE Evaluation is funded by the U.S. Agency for International Development (USAID) under terms ofCooperative Agreement GHA-A-00-08-00003-00 and is implemented by the Carolina Population Center,University of North Carolina at Chapel Hill in partnership with Futures Group, ICF International, John Snow,Inc., Management Sciences for Health, and Tulane University. The views expressed in this publication do notnecessarily reflect the views of USAID or the United States government.April 2014, SR-14-87Photograph by Teemar Fisseha, research assistant, at an Ethiopian health post during a MEASURE Evaluation-George Washington University case study.
ContentsExecutive Summary. i1Introduction . 12Overview of HMIS scale-up in SNNPR . 23PRISM Assessment Conceptual Framework . 34Objectives . 45674.14.2Overall Objective . 4Specific Objectives . 4Survey Methodology . 4Study Limitations . 5Results . 67.1Levels of HMIS Performance: Data quality and information use. 67.1.1Data Accuracy at Health Facility . 67.1.2Data Completeness . 77.1.4Data quality check . 87.1.37.1.57.2Use of HMIS Information. 8Determinants of HMIS Performance. 127.2.1Behavioral Determinants . 127.2.1.1Self-efficacy or Confidence Level for HMIS Tasks . 137.2.27.38Timeliness . 8Organizational Determinants . 15Focus Group Discussion Findings . 20Discussion and Recommendations . 23
Executive SummarySince 2009 USAID/MEASURE Evaluation has been scaling-up the national Health ManagementInformation System (HMIS) in Southern Nations, Nationalities and People’s Region (SNNPR) ofEthiopia. By July 2011, 7 zones and 2 special woredas out of 15 zones and 7 special woredas inSNNPR were implementing the reformed HMIS.In August 2011, assessment of the HMIS performance and its organizational, technical andbehavioral determinants was conducted in a cluster of 2 zones & 1 special woreda. All the 3 zonalhealth departments (ZHD), 19 woreda health offices (WorHO) and 3 hospitals and a random sampleof 31 health centers (HC) and 36 Health Posts (HP) were surveyed using the PRISM 1 tools; 229health managers and staff from these institutions were interviewed. Focus group discussion (FGD)with key regional and zonal managers complemented the quantitative data.Major strengths of the HMIS in SNNPR included reporting completeness and existence of functionalperformance review teams (PRT). Over 93% health facilities (HF) submitted completed HMISreports; and 99% of the expected HF reports were available at the WorHOs. All (100%) WorHOsand HCs have functional PRTs. Of them, 79% WorHOs and 69% of HCs demonstrated use of HMISfor performance review. In terms of decision making, in the past 3 months, 37% WorHOs madedecisions based on HMIS review.Data display was in 100% ZHDs, 86% WorHOs, 84% HCs and 81% HPs. Over 94% ZHDs and 75%WorHOs but only 39% HFs demonstrated data analyses. All ZHDs, 95% WorHOs and all hospitalshave computers and printers; however, only the ZHDs have access to computerized HMIS data.Even though 65% HFs have had one or more supervisory visits in the past 3 months and dataquality was checked in 59% HFs, only 10% HCs and HPs have institutionalized data quality checks.Variations in data accuracy levels were found across data elements and across health facility type.On average, data accuracy ranged between 62% and 17%. In the 14 WorHOs that had records ofreport receipt, 70% HF met the reporting timeline.Hospital and HP respondents showed lower HMIS tasks competency (59% and 47% respectively)but higher confidence (75% and 76% respectively). The confidence levels of WorHO and HCrespondents were 73% and 66% matching their competency levels of 73% and 60% respectively.Regarding promoting information culture, 58% HCs and 33% HPs used HMIS in their annual plans;65% HCs and 28% HPs reported their in-charges attending performance review meeting at woredalevel; and 23% HCs and 17% HPs reported receiving any directives on HMIS information use.Thus, HMIS performance improvement challenges in SNNPR relate mostly to improving dataaccuracy, access to computerized HMIS data and competencies to analyze, interpret and use HMISdata at WorHO and HF levels.Unavailability of printed HMIS materials, delays in updating the electronic database followingreports submission to Regional Health Bureau and continuing existence of parallel reportingrequirements were identified by the FGD participants as additional factors affecting HMISperformance.1Performance of Routine Information System Management (PRISM)i
This assessment provided in-sight into aspects of HMIS in SNNPR to be capitalized or needingserious attention. The findings serve as baseline for future comparisons to ascertain progresstowards HMIS performance improvement.ii
1 IntroductionThe Health Management Information System, Monitoring and Evaluation (HMIS/M&E) fits withinthe priorities set by the Ethiopian Health Sector Development Program’s (HSDP) strategic plan. TheGovernment of Ethiopia (GOE) emphasizes evidence-based decision making directed towardsperformance improvement and results-oriented management in all public sectors. Accordingly, theNational HMIS Strategy identifies five critical strategic areas to strengthen and continuouslyimprove HMIS/M&E. These are capacity building, standardization and integration of data collectionand reporting, linkage between information sources, action oriented performance monitoring, anduse of the appropriate technologies 2. In line with these principles, in 2007 the Ministry of Health(MoH) launched a nationwide HMIS reform. As a result, a harmonized and standardized HMIS wasdeveloped as the primary source of information for evidence-based decision making andmonitoring health sector performance 3.Since September 2009 MEASURE Evaluation is supporting the Southern Nations, Nationalities andPeople’s Region (SNNPR) of Ethiopia to scale up the HMIS reform via its USAID funded HMIS Scaleup (HMIS-SU) Project. SNNPR is one of the 11 regions of Ethiopia with over 16 million or 20% of thecountry’s population. It has 15 zones and 7 special woredas. The HMIS SU Project is supporting asystems approach rolling out HMIS zone-by-zone. This was done to ensure that all the healthinstitutions within one administrative unit, i.e. a zone, are becoming primed to one standardizedHMIS reporting. The project promotes regional ownership and facilitates the RHB to take aleadership role in assuring the proper utilization of HMIS instruments, establishing functional dataquality assurance mechanisms and institutionalizing performance review teams (PRT). The projectalso introduced and continues to assist the RHB in maintaining an electronic application - theeHMIS for HMIS data entry, aggregation, analysis and dissemination. By July 2011, seven zones andtwo special woredas were implementing the reformed HMIS.As part of the ongoing effort to scale up HMIS reform, the Regional Bureau of Health (RHB) ofSNNPR in collaboration with the MEASURE Evaluation HMIS Scale-up team planned to enhanceefforts for strengthening HMIS performance in the zones. The Zonal HMIS PerformanceStrengthening Plan is implemented in four phases: (1) zonal HMIS performance assessment; (2)developing a HMIS strengthening action plan; (3) implement HMIS strengthening interventions,and (4) routine monitoring of the HMIS performance to measure the effect of the interventions.In August 2011, the first round of the zonal HMIS performance assessment was conducted in acluster of zones (viz. Hadiya and Kambata Tembaro) and special woreda (Halaba) who wereimplementing the reformed HMIS since mid or late 2010. The assessment was based on thePerformance of Routine Information System Management (PRISM) framework. This frameworkpromotes strengthening of the HMIS performance i.e. better data quality and improved informationuse by addressing technical, organizational and behavioral factors affecting HMIS data quality anduse for health service performance improvement.This document reports on the assessment findings that serve as a basis for formulatinginterventions to improve the HMIS performance and as a baseline for future monitoring of HMISperformance improvement in the zones. Additionally, lessons learned from this assessment willfurther inform needed modifications and/or adaptations of the HMIS performance assessment toolsto be used for assessments in the remaining zones of SNNPR.23FMOH HMIS/M&E Strategic Plan for Ethiopia Health Sector, January 2008Editorial: Federal Ministry of Health Quarterly Health Bulletin Vol. 3 No. 1, Jan 2010.1
2 Overview of HMIS scale-up in SNNPRThe HMIS reform in Ethiopia focused on rationalizing and standardizing indicators, data collectionand reporting forms and procedures, and institutionalizing HMIS data quality assurance andinformation use mechanisms. For a uniform implementation of HMIS, prerequisites were set byFMOH to scaling-up HMIS in any region; the RHB were made responsible to renovate Medical CardUnit (MRU), provide Master Patient Index (MPI) boxes, shelves for filing Individual folders at MRUs,recruit full-time salaried HMIS focal persons, hire and train Health Information Technicians (HIT)and put appropriate number of staff in the MRU (card room). The FMOH took the responsibility toprint and provide HMIS instruments and to provide funds for training health staff in the HFs.Throughout the country the pace of training of health staff and scaling-up of the reformed HMISwas not encouraging. In this situation, FMOH through USAID invited JSI/MEASURE Evaluation tosupport the scaling-up of the reformed HMIS in SNNPR. The support includes promoting regionalownership and building capacity, fostering mentorship and supportive supervision, encouragingbroad based partnership and enhancing IT support. SNNP RHB encouraged all the healthinstitutions in the region to assign HMIS focal persons from the existing staff and mobilizedpartners for arranging boxes, shelves for MRUs and printed HMIS instruments.In SNNPR, reports generated by the HFs are sent to the respective WorHO who transmit them toRHB through the respective ZHD. Once at RHB, the monthly HMIS report data are enteredelectronically in the electronic application, the eHMIS, using Intelligent Character Recognition (ICR)technology. As soon as data is entered into eHMIS and data quality check is performed, the HMISdata becomes available to all the ZHDs through wireless connections using CDMA. The ZHDs candownload the data and use the various applications of eHMIS for reviewing and analyzing HMISreports. However, till July 2011 the WorHOs did not have access to eHMIS and in order to fulfill thereporting requirement to the Woreda councils, they were using spreadsheet to do parallel dataentry and aggregation.At Health Posts level, SNNPR was the first among all the regions where the Family Folder wasscaled-up as the community based information component of the reformed HMIS.The SNNP RHB adopted a participatory training model whereby training of trainers were providedto the staff from RHB, ZHDs and WoHOs to create a pool of trained local facilitators in the region.The training of regional, zonal and woreda health managers and Health Facility (HF) staff wasfocused on building skills on record keeping and reporting, data quality assurance and HMISinformation use. Along with the trainings, measures were taken to strengthen supportivesupervisions to improve overall performance of HMIS, particularly the knowledge of HF staffregarding HMIS instruments and data quality.Simplification, standardization and harmonization are the core principles of the new HMIS.However, parallel recording and reporting instruments for different services at all levels are still inuse. For instance, TB record book, PMTCT register, VCT register, outpatient therapeutic program(OTP) cards and community conversation (CC) record book are in use in the health posts. Separateweekly, monthly and quarterly reports are submitted based on these records to higher level. Theuse of these parallel recording and reporting instruments is mainly determined by the needs ofspecific programs whose information needs may in turn be driven by donor reportingrequirements. This situation is not unique to SNNPR and is seen as putting additional data burdenon the health staff, compromising data quality and creating a huge administrative burden.2
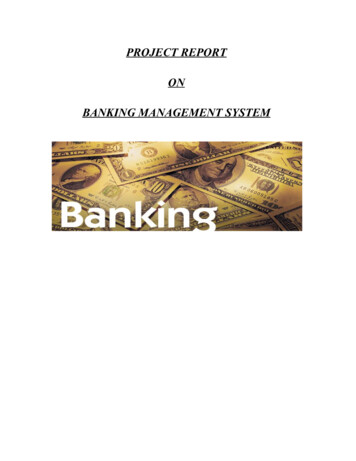
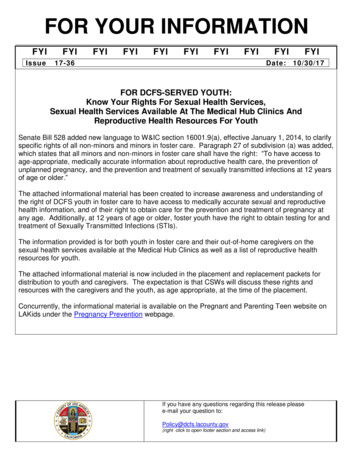
3 PRISM Assessment Conceptual FrameworkThe Performance of Routine Information System Management (PRISM) Framework (Fig. 1) definesthe various components of the routine health information system and their linkages to producebetter quality data and continuous use of information, leading to better health system performanceand, consequently, better health outcomes. The PRISM framework asserts that Routine HealthInformation System (RHIS) performance (better quality data and continuous use of information) isa function of better RHIS processes and their behavioral, technical, and organizationaldeterminants 4. The PRISM framework is founded on a ‘systems approach’ and continuousperformance improvement principles.The assessment carried out in SNNPR is based on this PRISM framework which consists of tools toassess Routine Health Information System (RHIS) performance, identify technical, behavioral andorganizational factors that affect Routine Health Information Systems, aid in designing priorityinterventions to improve performance, and improve quality and use of routine health data 5.Figure 1: PRISM FrameworkINPUTSPROCESSESOUTPUTSOUTCOMESIMPACTRHIS DeterminantsTechnical Factors Complexity of thereporting form,procedures HIS design Computer software IT ComplexityOrganizational Factors Critical ManagementFunctions & Informationneeds Governance Planning Availability of resources Training Supervision Finances Information distribution Promotion of culture ofinformationBehavioralFactors Level of knowledgeof content of HISforms Data qualitychecking skill Problem solvingfor HIS tasks Competence in HIStasks Confidence levelsfor HIS Tasks MotivationRHIS Processes Data collection Data qualitycheck DataTransmission DataProcessing Data Analysis Data displays FeedbackImprovedRHISPerformanceData ceImprovedhealthstatus4Aqil, A., Lippeveld, T, Hozumi, D., PRISM framework: a paradigm shift for designing, strengthening and evaluatingroutine health information systems, Health Policy and Planning 2009;1–125MEASURE Evaluation – PRISM: Performance of Routine Information System Management itoring-evaluation-systems/prism)3
4 Objectives4.1 To create a baseline for HMIS performance and its determinants in SNNPR and therebygenerate evidences for formulating interventions for improving HMIS performance inSNNPR4.2 Overall ObjectiveSpecific ObjectivesEstimate the level of HMIS performance in three zones measured by data quality and use ofinformation.Assess the behavioral, technical and organizational determinants affecting HMISperformance.Develop recommendations for interventions to strengthen the identified areas needingimprovement.Build capacity of Regional Health Bureau and other Zonal Health Departments to conductperiodic HMIS performance assessment using PRISM tools.5 Survey MethodologyThe Regional Health Bureau has classified the 15 zones and 7 special woredas within SNNPR in 5clusters for supervision purposes. These clusters are formed based on geographical proximity. Inaccord with this division, a phased approach is taken to conduct the zonal HMIS performanceassessments in all the five clusters. The first phase of the assessment was conducted in the clusterthat contains Hadiya Zone, Kembata Tembaro Zone and Halaba Special Woreda. Both quantitativeand qualitative methods were used for the assessment.A total of 3 hospitals, 76 HCs and 519 HPs were functional in the two zones and the special woredaat the time of the first assessment (Table 1).Table 1: Distribution of Health Facilities in the Three Zones/Special WoredasZone/Special WoredaHadiyaKembata TembaroHalabaTotalHealth Posts31213176519Health Centers4227776Hospitals1113Multiple sampling techniques were applied in this assessment. There are 19 WorHOs and 3 ZHDsin the cluster. These numbers were not sufficient for taking a sample. Therefore, all the 3zone/special woreda health departments (ZHDs) and 19 WoHOs were included in the assessment.Similarly, all the 3 Hospitals were selected for the assessment.For selecting Health Centers and Health Posts, the Lot Quality Assurance Sampling (LQAS) methodwas used to determine the sample size. Sixteen HMIS performance indicators were measured atfacility level with an upper threshold of 90% and lower threshold of 60%. A decision value (d) of 6health centers and an acceptable alpha value of 0.06 were set. On the basis of this information,sample size (n) was estimated by using LQAS sampling table. A plan with the sample size of twelve(n 12) was used; this single-stage sampling plan accepted an alpha error of 15%. Accordingly,12 health centers (HCs) from each zone were selected using the simple random sampling method.4
However, in Halaba special woreda, where there are only 7 health centers, all of them wereincluded in the facility sample. One health post (HP) attached to each sampled health center wasrandomly chosen for the health post level assessment. Some of the original sampling lots had to bere-selected due to factors out of our control. Inaccessibility of health facilities due to rain forced theteam to replace 8% of the facilities initially selected. It was agreed to revisit the replaced healthfacilities during the dry season and compare their HMIS performance status with the resultsobtained in this assessment. Overall 36 HPs, 31 HCs and 3 hospitals were visited and 229 healthstaff comprised of HMIS Focal persons, Planning/M&E team members, Case Team coordinators, andheads of the selected health institutions were interviewed (Table 2)Table 2: Sample Size of Health Institutions Covered in the StudyOffice/FacilitiesZone/Special Woreda HealthDepartments (ZHD)Woreda Health Offices (WoHO)HospitalsHealth CentersHealth PostsHealth 948121292171244333136229The interviewers were the HMIS Focal Persons and M&E staffs from all three zone/special woredasand the SNNPR-based staffs of HMIS Scale-up Project. Staffs from ZHDs were selected to assureownership of the results and to build zonal capacity for subsequent follow-on assessments. ZHDstaff and project staff were coupled together in teams to negate interviewer’s bias. Two-daytraining was conducted for the interviewers in collaboration with the Planning/M&E unit of theSNNP RHB. During the training, the participants reviewed the draft questionnaire developed basedon the generic PRISM assessment tools consisting of: HF, WorHO and ZHD level Diagnostic Tools for assessing data quality and information use Management Assessment Tool (MAT), and Organizational and Behavioral Assessment Tool (OBAT)These questionnaires were adapted to SNNPR context in light of the reformed HMIS.Qualitative data, collected through focus group discussion involving zonal HMIS officers and headsof policy and planning teams, were used mainly to enrich and explain the quantitative data.Quantitative data were analyzed using excel spreadsheet.6 Study LimitationsPRISM questionnaires were modified for the assessment in the context of SNNPR and somequestions were dropped. This made DEAT unsuitable for data entry and analysis. Consequently, anExcel spreadsheet was developed for data entry and analysis.The questionnaires were in English. Even though intensive hand-on training was given to the datacollectors who were from among the project staff as well as ZHD staff, the understanding of thequestions among the data collectors was not always uniform. Similarly, many respondents,5
especially those from the HFs, had difficulty in understanding and responding to the English versionof the self-administered OBAT questionnaire. As a result some questions remained unanswered andwere left blank. Thus, for analyzing each set of questions the sample size and the decision rule hadto be adjusted according to the number of responses available.7 Results7.1 Levels of HMIS Performance: Data quality and information use7.1.1 Data Accuracy at Health FacilityThree data elements, viz. Repeat Contraceptive Acceptors, 3rd dose of Pentavalent vaccine (Penta3)and OPD attendance of female 15 years & above were purposefully 6 selected for assessing dataaccuracy. Records for the months of March and July 2011 from registers for these data elementswere recounted and cross-matched with the figures in the corresponding monthly reports of thehealth facilities.In the course of the assessment, the data collectors missed 9% of the selected data and thesemissing data were dropped from the analysis.Table 3 shows the level of data accuracy by data element and by health facility type. Overall, inabout 41% cases the data items completely matched between the registers and the reports. Only athospital level, the data accuracy for all the three data elements exceeded the minimum level of 60%data accuracy.Table 3: Data Accuracy at Health Facility Level6Date elementsFacility typeData itemschecked(Sample size)Data ItemsmatchedPercent dataaccuracyRepeat ContraceptiveAcceptorsHP592237.29%All HFs1275240.94%HCHospitals62626441.94%66.67%In the reformed HMIS the definition of Repeat Contraceptive Acceptors was modified to those clients who areever users of any contraception and in a given year are coming for the first time for contraception (either for resupply, or restarting or starting a different method of contraception). Thus, ever-user clients who come forsecond and subsequent visits are not counted. Previously, however, all the repeat visits were counted ascontinuous users. Thus, there were chances that the health staff might confuse the definition of RepeatContraceptive Acceptors. On the other hand, in case of OPD attendance, the patients’ data is recorded in theOPD Abstract Register and also in OPD Tally sheet. In the register, one row is used for one visit and the maindiagnosis is recorded even if the patient comes for more than one illness. On the other hand, in the Tally sheet,every diagnosis is tallied; moreover, the tally sheet allows tallying by age and sex groups. This arrangementencourages the health staff to rely on the tally sheet for reporting and there are chances that the records in theregister and tally sheet might not match. The most straight forward record is for pentavalent vaccination.However, in this case chances of over-reporting are there to show higher performance. Thus, these three dataelements were selected to examine the level of data accuracy.6
Date elementsFacility typeData itemschecked(Sample size)Data ItemsmatchedPercent dataaccuracyPenta3HP622032.26%All HFs1295542.64%HCHospitalsOPD AttendanceHPHCAll 3 data elementsHospitalsAll HFsHPHCHospitalsAll .04%7.1.2 Data Completeness7.1.2.1 Monthly Report CompletenessThe completeness of the monthly report is measured by number of HF reports with over 90% of thedata elements filled against the total number of data elements that the facility was supposed to fill.The result showed less than 7% of the facilities did not complete the monthly form beforereporting. It was found that all the three zones/special woreda met the 90% acceptablecompleteness standard (Table 4).Table 4: Monthly report data completenessFacility TypeHPHCHospitalsTotalSample size3631370# of HF reports meeting90% completenesscriteria3230365% of HF reports meeting90% completeness criteria88.9%96.8%100%92.9%7.1.2.2 Monthly Health Facility Reporting CompletenessIn addition, the completeness of the report at woreda level is assessed by how many facilities in thewhole woreda were supposed to report are actually reporting to the respective WorHO. In thenineteen woredas, over 99% of the facilities were observed to be reporting (Table 5).7
Table 5: Monthly HF Reporting CompletenessZoneHadiyaKembata TembaroHalabaTotalMonth/2011 # of y591Total1182# of monthlyreports availableat WorHO34834969715115230386861725855871172% of HF reportsavailable %100%98.98%99.32%99.15%7.1.3 TimelinessAnother dimension of data quality is timeliness. Timeliness is measured by the WoHOs and ZHDsreceiving facilities’ reports by the predetermined deadlines. Five out of eight WoHOs in KembataTembaro zone did not have records to measure timeliness. The 14 WoHOs had records of reportreceipt and showed 77% of the health facilities met the reporting deadline.7.1.4 Data quality checkTable 6 shows that in over 60% of the Health Posts and Health Centers, the supervisors visited thehealth facility for supervision and 75% of the supervised HFs received feedback on the supervisoryvisits. However, no hospital was visited by the supervisors in the last 3 months.In 64% of the supervised Health Facilities (primarily HCs and HPs) i.e. 49% of all the HCs and HPs,the supervisors had carried out data quality check.Table 6: Data Quality Assurance at Health FacilitiesFacility TypeHealth Posts (n 36)Health centers (n 31)Hospitals (n 3)Total (n 70)HFs receiving 1 ormore supervisoryvisits in last 3months25(69%)19(61%)044(63%)Supervised HFsreporting dataquality check duringsupervision16(64%)12(63%)028(64%)Supervised HFsreporting receivingfeedback aftersupervisory visits16(64%)17(89%)033(75%)7.1.5 Use of HMIS InformationThe use of information was assessed by observing feedback provided on facility performance andthrough records of performance review meetings to collect documentary evidences of whether ornot HMIS findings were discussed and decisions were eventually made based on those discussions.8
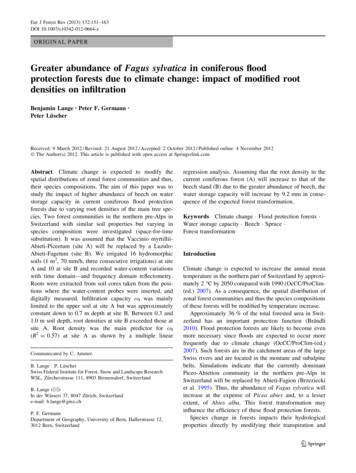
7.1.5.1 Data DisplayAvailability of tables, charts and/or maps on (1) maternal health indicators, (2) child healthindicators, (3) facility utilization, and /or disease surveillance indicators were assessed forunderstanding the level of data display in the health facilities, zonal health departments andworeda health offices. Table 7 shows that 62 (89%) health facilities were displaying data; of them35 (56%) HFs had all the indicators updated over the last 3 months period.Table 7: Display of Data at Health FacilitiesData Display(n 70)All 4 indicators3 indicators2 indicatorsTotal (1-4 indicators)No. of HFsdisplaying data42(60%)15(21%)5(7%)62(89%)Displaying HFs withall displayed dataupdated22(52%)11(73%)2(40%)35(56%)Displaying HFs withat least 1 displayeddata item updated30(71%)15(100%)5(100%)50(81%)Among those HFs displaying data (n 62), the most common indicators displayed were maternalhealth indicators (100% HFs) and child health indicators (100% HFs); disease data were displayedin 85% and facility utilization data were displayed in 74% HFs.Fifty two (74%) HFs displayed the map of their catchment area and 55 (79%) HFs displayed asummary of the demographic information.At zonal/woreda level 100% of the ZHDs and 86% of the WorHOs displayed map of the catchmentarea, service delivery data and demographic data.7.1.5.2 Data AnalysisFigure 2: Data Analysis at HF level9
Fig. 2 shows that most HFs (73%)
In August 2011, the first round of the zonal HMIS performance assessment was conducted in a cluster of zones (viz. Hadiya and Kambata Tembaro) and special woreda (Halaba) who were implementing the reformed HMIS since mid or late 2010. The assessment was based on the Performance of Routine Information System Management (PRISM) framework.