Transcription
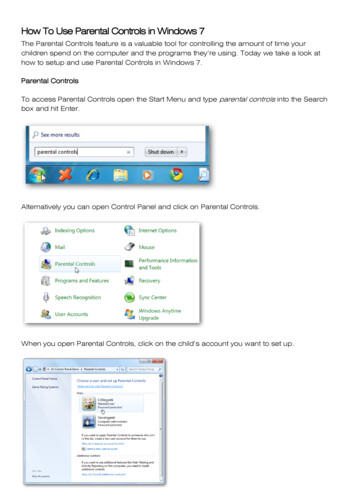
Johnson Controls Enterprise Management (JEM)Product BulletinLIT-12012497Issued July 2020Software Release 2.3OverviewJohnson Controls Enterprise Management(JEM) is a single pane of glass solution for cloudbased building performance analytics andoptimization. JEM is a multi-tenanted Softwareas a Service (SaaS) solution that supports highvolume building data aggregation sourced fromJCI and 3rd party BMS platforms and externalsources. JEM hosts a number of subscriptionbased apps that provide the intelligence andexperiences to support building operations,asset performance management, tenancy, workorder management and advanced ML enabledanalytics.Using parent-child meter/equipment spacerelationships, JEM provides for enterprisebuilding performance comparisons, andlifecycle management. Powerful analytics rootout energy and equipment-related problems24x7. These analytics run in the backgroundand find energy and equipment anomalies.Actionable information is provided to thecustomer through the Fault Detection andDiagnostic (FDD) feature. Performs mandatory energy reviewsautomatically, which is required by ISO50001. Ability to set baselines, recalculate them,and compare them with historical data totrack energy savings progress.JEM is the easiest way to share progresswith the energy team and organizationusing automated reporting tools. Features and BenefitsIntuitive UIJEM has an extremely intuitive User Interface, withan easy-to-navigate, user-centric approach. JEM’svarious applications help users to easily address andmanage the varying needs of their enterprise.NavigationIn the upper right handcorner, the user can click onthe App Console icon tobring up a menu ofapplicationsforeasynavigation.JEM works with Metasys Building Automationand 3rd Party Building Automation Systems(BAS) that support BACnet IP communicationsto provide a holistic view and insights at everyspace, with respect to equipment operationstarting from the portfolio down to sub-spaceswithin the building. Coupled with the JEM DataCollector, it has the flexibility to integrate directlywith meters using BACnet IP and is easy toconfigure. JEM can assist in obtaining ISO50001 Certification faster. JEM is an integral part in the developmentof an energy management plan and otherfactors affecting energy performance thatcan be monitored and influenced by theorganization.Provides measurement, documentation,and reporting of energy use andconsumption.Automates energy and system monitoringand verification (there is no need to go tothe facility and write down energy metricson paper or take photos).At any time within theapplication, the user canclick the Home icon to bringthem back to the mainWelcome screen.Navigation TreeJEM has a very flexiblenavigation space tree. Userscan navigate to the location,spaces,meters,andequipment by clicking them onthe left-hand Navigation Treein the screen. The NavigationTree allows the user to searchfor locations, buildings, floors,wings, rooms, or meters byentering keywords in theSearch box.Johnson Controls Enterprise Management (JEM) Product Bulletin1
KPI CardsKPI Cards throughout the application conveysummarized information, helping the user to gain aquick understanding of crucial KPIs within theirportfolio.These KPI cards can beviewed at the portfolio,location, or building-level.In the “Connected Locations” widget, the user canclick on specific pins on the map and the data willupdate for the selected location or building.Clicking on any of the KPIs on the landing page willautomatically navigate the user to the specific pagewhere they can view further details about that data.Landing PagesJEM brings the issues and findings to the user in theopening landing page, rather than users having to findthe problems themselves, saving them invaluabletime.To determine the landing page that a user views whenopening the application, the user can select either aSimplified or Data Rich view to be presented. Thisunique preference will be automatically saved andremembered for future logins.Simplified Landing PageThe Simplified landing page provides a unified view ofitems “requiring attention” across all JEMapplications, quickly informing the user of all relevantupdates in the last seven days and making itextremely easy to prioritize. Further, the Simplifiedlanding page provides a list of a specific user’s mostFrequently Viewed Apps. All of these cards areclickable and can quickly navigate the user withbeautiful transition effects to the appropriate spot inthe JEM application.Portfolio KPIsThe portfolio KPIs provide the user with a quick lookat various energy and asset KPIs for a selectedspace (portfolio, location, or building).The user can hide or un-hide a specific set of KPIsby clicking on the “All KPI” button.They also have colour indications based on theminimum and maximum threshold values assignedto respective KPI values.Commodity ConsumptionThe commodity consumption dashboard helps userseasily track their commodity consumption.Users can select between different commodities froma dropdown menu. All commodities that are currentlymapped to the portfolio will be available to the user.Data Rich Landing PageThe Data Rich landing page provides the same“Attention Required” information as the Simplifiedlanding page in addition to various important,portfolio-level KPIs such as Electricity and W aterKPIs, Fault Summary, Equipment Efficiency, Faultand Equipment Categorization, ConnectedLocations and Alarms, and Commodity ConsumptionComparison.The user can also perform a day-to-day consumptioncomparison for a commodity, or select betweenvarious other timelines for comparisons including‘WK,’ ‘1M,’ ‘6M,’ ‘1Y,’ ‘C.’Equipment Fault CategoryThe Equipment Fault Category dashboard depictsequipment and category faults.All FDDs are categorized as per the fault categoriesof Comfort, Compliance, Energy, Maintenance, andJohnson Controls Enterprise Management (JEM) Product Bulletin2
Hovering over any of the categories will show theuser how many faults there are on each piece ofequipment within that category.The user can utilize the toggle button at the top of thechart to switch between Time and Count. The usercan also toggle between preferred timelines.The user can also sort the fault list according to theirpreferences. Sortable attributes include faultcategory, fault priority, duration and many more.Energy ManagementEnergy Management software automaticallycollects, analyses, and displays information for allconfigured physical meters (Online/Offline meters)and Virtual meters located in a facilities operation.The information for energy demand andconsumption can be aggregated and displayedusing various out-of-the-box dashboards. Customdashboards can also be configured to a user’sneeds. Easy-to-understand summary reports can begenerated from the dashboard data, utilizing thebuilt-in automated reporting tool.The following additional features are discussed infurther detail in this bulletin: Map Selection Energy Density Dashboards Weather Normalization Energy Tracker with Baseline Energy Summary of Commodities Energy Fault Detection and Diagnostics (FDD) Building Benchmarkingo Building EUI Comparisono Internal Benchmarkingo Building WUI Comparisono EUI vs Consumption Custom Dashboards: dashboards that can beconfigured to display data for space or meters.o Line, Area, Column, Stacked Column,Stacked Column Aggregation, Bar, StackedBar charts; user can map different pointswith the same unit of measure, or up to fourdifferent units of measure, in the same chart.o Pie Charts; can be used to view thecontribution of consumptions from fourbuildings, in percentage, for that location.Each building is shown in a percentage,providing an easy view as to which buildingis contributing the most in consumption.Heat Map; can be used for easy detection of“hot spots” that lead to high Consumption/Demand during parts of the day, allowing forquicker corrective actions for when the hotspots occur.Combination Charts such as Column-Line,Column-Area, Stacked Column AggregationLine, and Stacked Column Stacked-Area; can beused to visualize multiple sets of data in variousgraphical formats.Consumption and Demand ComparisonsEnergy Prediction using Machine LearningEnergy Profilingo Consumption Profilingo Demand ProfilingSolar Meter DashboardsData Cleansing and NormalizationUser Defined BaselineEnergy Summary Reports with Auto SchedulingEnergy Impact Report monetizing faultsthroughout the platformoMiscellaneous. All equipment is categorized withinthe parent equipment family it belongs to. Used alone, or coupled with the Asset Performancesoftware add-on, it provides a system that allowseasy enterprise performance comparisons and lifecycle management, providing detailed visibility intosite operations.Asset PerformanceThe Asset Performance software add-on of JEMprovides the connectivity to monitor, troubleshoot,and maintain configured equipment points located ina customer’s facility to ensure that high capex assetsare safe, reliable, and efficient over their operatinglife. Rule-driven fault detection, notification, anddiagnostics are displayed in a time series format withtotal duration of existence, allowing equipmentmanagers to easily pinpoint and fix equipmentproblems.All data is displayed in easy-to-read dashboards andprovides for developing custom equipment KPIs.The following additional features are discussed infurther detail in this bulletin: Map Selection Plant Room Equipment KPIs Airside (AHU, RT, VAV, Fan Coil, etc.) KPIs Waterside (Chiller, Boiler, etc.) KPIs Equipment Efficiency KPIs Equipment Fault Detection and Diagnostics(FDD) Fault Notification Fault Dashboards FDD Export System FaultsJohnson Controls Enterprise Management (JEM) Product Bulletin3
Fault Backdated ReprocessingCustom Rules Fault MonetizationStandard Global Rule Library/Rule DrivenDiagnostics Custom Equipment Rules Editor Graphics and Point Binding Chilled Water Plant Graphics Air Schematic Graphics Command and Control Case Based Learning Asset Age Analysis Equipment Analysis and Dashboards Rule Driven Diagnostics Equipment Thermal, CO2 and Humidity HeatMap and Top Deviations from the respective setpointsNote: The Asset Management software is an add-onsoftware for Energy Management. It cannot belicensed without first licensing the EnergyManagement software.Maintenance ManagementThe Maintenance Management feature providesspecific dashboards to display information on workorders, service reports, and maintenance KPIs. Thisfeature comes as part of the Asset Performance addon license. Users can use the information to generateand track Work Orders, check Service Reportstatuses, and allocate resources to closing tickets,and measure performance of maintenance teams bytracking specific KPIs like Time to Respond, AssetRelated Work Orders, etc.JEM’s revolutionary analytics use the main rules,diagnostic rules, FDD driven work orders, andservice reports to assist in scheduling andperforming predictive maintenance.Tenant ManagementThe Tenant Management feature requires thepurchase of an additional license. TenantManagement includes a Tenant Portal, Tenant BillingModule, and Building Owner Portal (TenantManagement app).The following additional features are discussed infurther detail in this bulletin: Tenant Portalo Consumption and demand comparison withother tenants and tenant ranking.o Ability to submit online after-hour consumptionrequests.o Ability for tenants to rate their experience andprovide feedback on certain KPI’s. Flexible Tenant Billingo Calculates and auto-generates bills fortenants, covering consumption for multiplecommodities such as Electricity, Water, Gas,etc.o Allows different tariffs to be applied todifferent meters for a given tenant.o Auto-generates bills specific to After Hoursrequests.o Allows generation of bills based on historicaldata. Building Owner Portalo Summary by Portfolio and Location.o Building owner’s view of tenant billdetails and After Hours’ details.o Dashboards on Energy CostIntensity, Consumption bytenant,Consumptionbreakdown, and Energy useintensity by tenant.o Tenant Satisfaction Indexo Tenant Space UtilizationFinancialsFinancials is an app in JEM which helps users tokeep track of their financial spending, specifically tounderstand their current ROI and savings.The following additional features are discussed infurther detail in this bulletin: Utility Bill Management Financial SpendNote: From a manual entry perspective, the UtilityBill Management feature is available with the baseJEM Energy Management package. To automate theentry of this information, an automated utility serviceis available, which requires the purchase of anadditional license.Space PerformanceUse the Space Performance app to understand thespaces which are getting over utilized andunderutilized. View trends of these spaces, andcorrelate between space utilization and occupantcomfort, which requires the Companion app, todetermine if the spaces that are underutilized havehot or cold calls causing discomfort to theoccupants.KioskPromote and inspire - Enhance the story of yourbuilding’s performance and green features bycommunicating the unique story of energy ment - Create a dynamic and interactiveJohnson Controls Enterprise Management (JEM) Product Bulletin4
experience that engages occupants and fosterscollaboration through real-time energy and wateruse reduction comparisonsEducate - Provide insight into how electricity isbilled, spent and consumed, as well as providegreen tips on how to conserveInform - Improve the dissemination of informationby including convenient, current, and accurateinformation via announcements, notifications,events, etc.With JEM, you can add a fully configurable,maintainable, interactive, and/or slideshow, Kioskthat can display several kinds of content. System ArchitectureThe JEM system is comprised of various hardwareand software components working closely together toprovide monitoring over a site’s meters, HVAC, andother building systems.Data CollectorThe Johnson Controls Enterprise Management DataCollector is an industrial PC that providesconnectivity to meters and building automationsystems to extract data for the JEM application. Thisgateway uses Internet of Things (IOT) capabilities tocollect and push data to the cloud. The JEM Data Collector is protected by MicrosoftSecurity Essentials (Windows Defender). Click onthe link below to read the test reports on MicrosoftSecurity essentials-4.10170547Communication ProtocolsCertificates to prevent unauthorized access tosecure, encrypted communication.Supported services such as JEM Gateway (DataCollector) shall use self-signed certificatesinstalled on supported products with the option ofconfiguring trusted certificates.JEM application shall enable different users tohold various roles with respective, configurablerights, and data will be available based on thesespecific roles.JEM’s Enterprise Identity Management System(EIMS) has a new login workflow to ensure theauthentication process is secure through issuingtemporary authorization codes in exchange for asecret access code when needed. Since theaccess token is never visible to the user, this isthe most secure way to pass the token back tothe application, reducing the risk of the tokenleaking, and the risk of an attacker interceptingthe authorization code.JEM also offers additional password securityfeatures which ensure unauthorized userscannot access the application:o JEM offers multifactor authentication. If auser forgets a password, the user has tovalidate a one-time password sent via emailto enable password recovery.o JEM enforces a password expiry policy,requiring the user to change their passwordevery 60 days.o JEM application does not allow users to useany of their past 10 passwords whenresetting their password.o JEM application locks out a password aftermultiple retries.o User ID and passwords are typed on twodifferent screens.JEM works with Metasys Building Automation andother Building Automation Systems (BAS) thatsupport BACnet IP communications. It also has theflexibility to integrate directly with meters usingBACnet IP.ScalableRefer to Johnson Controls JEM EnterpriseManagement Data Collector Product Bulletin (LIT12012343) for further information. SecureJEM uses industry-standard system security andencoding protocols to protect against unauthorizedaccess to data and control systems, including thefollowing security features: JEM system architecture is scalable to the energyneeds of a user’s facility and equipment monitoringrequirements. Components can be added asneeded to: Control buildings and systems of varyingcomplexity, size and scope;Integrate with third-party BAS systems tounify operations with JEM;Integrate earlier generations of componentsto modernize and unify the operation;Software is modular to grow with the user’sfunctionality and site monitoring needs.All JEM components (UI, API) shall use HTTPS,HTTP Strict Transport Security, and SSLJohnson Controls Enterprise Management (JEM) Product Bulletin5
JEM Cloud Hosted SolutionsJEM Cloud Hosted Solution Metasys viaADX/ADS is used to support existing Metasysapplications installed in customer facilities.JEM Cloud Hosted Solution 3rd Party BAS viaBACnet IP is used to support existing BuildingAutomation Systems (BAS) via BACnet IPcommunications.JEM Cloud Hosted Solution BACnet IP Meters isused to support existing BACnet IP/Meterscommunications.JEM Cloud Hosted Solution Metasys via BACnetIP is used to support existing BACnet IPcommunications.User ProvisioningUser Provisioning helps the relevant users to accessEnterprise Management.There are two default roles; Admin and User.Additional roles may be added if required. The Admincan define rights for the user with respect to whichdashboards/reports/navigation can be viewed, whichensures that unauthorized users cannot view datathat they should not have access to. Multiple users ofJohnson Controls Enterprise Management (JEM) Product Bulletin6
the same profile (Operators, Technicians and EnergyManagers) can be set up under a single group forease of scheduling, automated Email of reports,faults, etc.ConfigurationThrough the use of easy-to-follow drop downmenus; Energy Management and AssetPerformance allows the user to configure thesoftware to the needs and requirements of theirportfolios.types of meters. Meters can include commoditiessuch as electricity, natural gas, water, steam, etc.Offline meters, Virtual meters, and points can beadded under the Setup Meter configuration tab.Data SourcesThe data sources tab allows the data to be fetchedfrom different communication protocols: Metasys – SQL Driver for ADX BACnet – BACnet IPOnce the data source is configured, the systemallows the user to discover devices/points, fetchhistoric data for selected points (Metasys HistorianSQL driver only), set point attributes, and sync withthe platform.SpacesThe Space Tree feature allows the user to createa space hierarchy reflecting actual physicallocations within the portfolio, including thefollowing: Portfolio Location (including weather information) BuildingThe offline data for the offline meters can beuploaded in the Setup Mapped points Offlinepoints tab.Equipment setup can include categories such aschillers, air handling units, boilers, pumps, fans,etc. that can be monitored for performance.Space re-ordering allows the admin to setup thespace hierarchy to reflect how the user wishes toview the spaces.Below the Building level, the user has the flexibility toadd spaces (e.g. floor, wing and rooms). Each onecan be named as per customers’ requirements toprovide ultimate flexibility.The accurate creation of the space tree is critical tothe functioning of the JEM system. Setting up the treeto exactly mirror the physical portfolio allows theenergy analysis to be accurate and precise.Data Quality Dashboard for Missing DataJEM now allows the user to view the quality of the datareceived from the Meter or Equipment points.There are 3 categories under which a point falls: Healthy data: No missing data, hence nodiscrepancy in the data analytics and visualizingon the dashboard. Un-healthy data: There are missing data whichleads to discrepancy in data analytics andvisualizing on the dashboard. Data not received: No data has been received orall the data is missing.Meters/EquipmentThe user can add in Meters or Equipment points,including the following: Add/Edit the attributes of data source points Historical Fetch and Sync Create meters/sub meters and map the pointsStandard Global Rule Library /Online and virtual meters are represented byunique icons that help a user to distinguish differentJohnson Controls Enterprise Management (JEM) Product Bulletin7
Rule Driven DiagnosticsJEM comes equipped with a standard Global RuleLibrary for Fault Detection and Diagnostics. Theanalytics run on the data of the configured pointparameter of the specific rule.Custom Equipment Rules EditorThe Custom Equipment Rules Editor function allowsthe user to create new rules applicable to theirfacilities operation. The Custom Equipment RuleEditor allows a user to define other equations, as wellas the threshold limits for each rule to detect as abreach from the normal condition.When logged in as a Super Admin user, s/he canaccess the Custom Equipment Rules Editor, whichprovides the templates and information required tocreate new rules to supplement the Global FaultLibrary.Fault CreationThe user can create faults in the Setup tab. To selectfrom JEM’s global rules, the user can go to Setup Global rules tab. In each of the subsequent tabs, theuser can create energy faults, thresholds, andequipment faults based on the global rules JEMprovides.Alternatively, the user can create custom faults in toSetup Custom rules tab. Here, the user can startfrom a template and create rules, thresholds,diagnostics and more, within each of thesubsequent tabs, with the option of creatingsystem-wide faults as well.In both the Sub Rules and System Fault Rules tabs,the user has access to a Fault Inline Editor. Faultequations are easily editable through a physicalkeyboard, enhancing the user experience whilewriting rules.Special characters are available to call outattributes, constants, sub rules, and specificationsin the rule equations.Additional statistical functions such as minimum,maximum, average, standard deviation, and squareroot are also available for creating FDD rules. Theuser is able to write a fault containing multiple datapoints.Fault MonetizationThe JEM Fault monetization feature calculates excessenergy wastage during equipment fault condition. Faultmonetization helps identify the critical energy drain inbuilding and prioritization of maintenance work. Energywastage is calculated in form of electrical and thermal.Monetization equations can be written using Equipment data point Equipment specification ConstantsMonetization equations work independent of readfrequency and algorithms automatically detect datapoint frequency and adjust calculation.BaselinesThe Baseline feature is a reference tool allowingcomparison of actual energy use to a predefinedbaseline for all energy parameters for a space ormeter. It allows the user to compare energyperformance before and after a change has beenmade to the site or system.Baselines can be created for: Location Energy Performance (KPIs)Custom DashboardsPlant Room DashboardFrom the Baseline tab, users can upload baselinedetails through a spread sheet or use the baselinetemplates provided to amend the information toconfigure their own baselines.Baselines can be created on a monthly or dailybasis.SchedulesThe Schedule function allows a user to configure theworkday, non-workday, and holidays.Johnson Controls Enterprise Management (JEM) Product Bulletin8
JEM has built-in default reporting templates whichcaptures essential data at a periodic basis andmakes it easy to distribute these reports to thestakeholders. The reports and dashboards are alsouseful to track and report regulatory reporting andemissions.The impact of a Schedule can be viewed in LoadProfile (above) and Consumption / Demand KPI(below).Overview of Energy ManagementFeaturesMap SelectionUsers can select the desired location/building andnavigate using Maps at the Portfolio and Locationlevels.The user can select Google or Bing maps.If a user hovers over a location, a pin icon willdisplay Electrical consumption and EUI details of thelocation. The user can easily navigate to a selectedlocation using the Map.Energy Density DashboardsJEM dashboards allow the user to comprehendenergy data intuitively. The information displayedidentifies inefficiencies in building operation to helpreduce energy costs.The dashboards are user-friendly. The data on thedashboards is organized for customers to easilynavigate through their portfolio and quickly prioritizewhich facilities need attention. All data fromdashboards can be exported and used for furtherreference and analysis or appended with a report.Weather NormalizationThe Weather Normalization feature normalizes theconsumption information by utilizing degree days,accounting for large swings in weather that mightimpact a building’s energy usage.Degree days can be configured to account for theaverage consumption of a specific day based on theweather conditions. Average energy consumptioncan then be viewed based on the weather conditions.The Enterprise Management application displays thisdata in a chart format, making it easier to analyze theinformation.Energy Tracker with BaselineThe Energy Consumption Tracker is present atPortfolio, Location or Building level and is used toshow the consumption of all commodities. Users canview consumption data for commodities either in chartor tabular format. The consumption of all commoditiesfor the current month is shown by default. Summarychart can be configured to show data by week, bymonth, 3 months, 6 months or by year and can beexported as an SVG, PNG, JPEG image or as a PDFfile.This KPI gives quick access to the user to comparethe Consumption/Demand (demand only forJohnson Controls Enterprise Management (JEM) Product Bulletin9
electricity) against the target (Baseline). It providesthe ability to define a Baseline across Commodities(Electricity, Natural Gas, Hot water, Chilled WaterEtc.) at both space and meter level, and displays theinformation in an easy-to-understand graphicalrepresentation of difference from the target(Baseline).Energy Summary of CommoditiesThe Energy Management section of JEM usesinformation from the building automation system tomonitor consumption of various commoditiesmapped for that space.Energy KPIs depict Energy consumption details forelectricity, thermal, and water, such as EUI,consumption, and per capita consumption.KPI Cards help users to briefly monitor the spacesand the user can visualize the KPI Cards at Portfolio,Location, and Building levels.Users can also view the Energy Savings against thebaseline for each of the commodities, as well as theCarbon footprint corresponding with the current levelof consumption.KPI Cards also help the user to easily viewcommodity consumption changes with respect to thebaseline from the previous year and whichlocations/buildings have contributed to an increaseor decrease in EUI.Energy Fault Detection and Diagnostics(FDD)JEM Energy FDD contains options to monitorEnergy, for either High Unoccupied consumption, orWeekend consumption. Users can view fault dataat varying levels, such as by portfolio, location,building, floor, wing, room, or meter.Energy ForecastJEM proactively predicts future energy usage byemploying pattern analysis, allowing users to quicklyand seamlessly understand the return on efficiencyinvestments. It provides the data required bycustomers to develop and execute smart strategiesto improve operational efficiency and maximizesavings.Energy Prediction ModelThe Energy Prediction Model helps your systemlearn from the data your system provides andpredict future demands so that you can control andoptimize your building energy consumption. Predicts energy consumption for buildings. Predictions provide insights needed tosupport peak shaving, load shifting,demand response and sourcing decision. Reduces energy consumption, energycosts between 5-10%. Utilizes deep learning processes andcustomer energy and OAT data to train inreal-time. Can be periodically retrained to increaseprediction accuracy over time. Adaptively configure different models foreach building.Building BenchmarkingBuilding EUI (Energy Use Intensity)/WUI (WaterUse Intensity) ComparisonsIn this widget, the user can easily toggle betweenviewing either EUI or WUI by building. Building EUIComparison helps the user to monitor the energyperformance of all buildings within a single location.The widget displays the Electricity EUI of all buildingsmapped for the selected location.Building WUI Comparison helps the user to monitorthe water performance of all buildings within a singlelocation.Johnson Controls Enterprise Management (JEM) Product Bulletin10
Internal BenchmarkingFor the EUI graph, the building which has the leastEUI out of all buildings with the same property typesis clearly marked. This building with the least EUI isconsidered a benchmark/standard to measure otherbuildings up against.EUI vs. ConsumptionThe following graph displays the performance of thebuildings within the selected location, based ondefined property types.Some of the available custom dashboards include:Line ChartThe user can map different points with the same unitof measure, or up to four different units of measure,in the same chart; it can display multiple y-axis’.Consumption of Commodities other thanElectricity at the Building LevelUser can view and anal
The Asset Management software is an add-on . software for Energy Management. It cannot be licensed without first licensing the Energy Management software. Maintenance Management The Maintenance Management feature provides specific dashboards to display information on work orders, service reports, and maintenance KPIs. This

