Transcription
Equality and Health Inequalities PackNHS Wolverhampton CCGDecember 2018Email for enquiries: england.eandhi@nhs.netOFFICIALGateway ref: 08541v 13:09:20
v 13:09:20AcknowledgementsjjjjjWe would like to thank Clinical Commissioning Groups (CCGs) for their help developing and testing these packs. Inparticular we would like to thank: Newham, Bromley, Somerset and Dorset for reviewing and discussing variousversions of their packs with us.We would like to thank Professors Chris Bentley (Health Inequalities National Support Team Associate) and RichardCookson of York University for their regular inputs during the development of these packs. In particular we would like tothank them for their time reviewing successive iterations, engaging with CCGs and making suggestions for bothdeveloping the analyses and for making them more accessible to CCGs.We would like to thank Public Health England (PHE) and Department of Health and Social Care (DHSC) analysts fordiscussing a sample pack and for making suggestions for improving the analyses within it.We would like to thank the many colleagues across NHS England for their help developing these packs, including theEqualities and Health Inequalities Unit, NHS England analysts, directors across business priorities and NationalClinical Directors.NHS Wolverhampton CCGNHS RightCare2
Contents ForewordExecutive Statistical SummaryExecutive Summary - Case Studies and ResourcesYour Equality and Health Inequalities PackThe National Big PictureWhy Should Addressing Health Inequalities be a Priority for CCGs?What Contributes to the Development of Health Inequalities?Your most similar CCGsMeasure of deprivationYour dataInequalities in Unplanned HospitalisationsInequalities in Psychological TherapiesResources for Addressing Health InequalitiesUseful LinksAction PlanningAnnex of Detailed TablesNHS Wolverhampton CCG45-6789101112131415-3233-4344-535455-5758-68NHS RightCare3
ForewordWe are committed to ensuring that all those using the NHS have fair and equitable access to high quality servicesthat are appropriate and in proportion to their needs. In addition we have a specific focus on those with protectedcharacteristics (by reason of age, membership of disadvantaged groups or living in disadvantaged areas).These NHS RightCare Equality and Health Inequality packs will help pinpoint areas of unwarranted variation andrefocus resources on specific geographies, clinical areas and population groups. They will help the NHS to befairer, as well as to improve quality and make best use of the tax payers’ pound.Matthew Swindells:Professor Stephen Powis:Professor Jane Cummings:NHS Wolverhampton CCGDeputy Chief ExecutiveNational Director Operations and InformationNHS EnglandNational Medical Director NHS EnglandChief Nursing Officer England and Regional Director LondonNHS EnglandNHS RightCare4
Executive Statistical SummaryUnplanned Hospitalisations for Chronic Ambulatory Care Sensitive Conditions andUrgent Care Sensitive Conditions for 2016/17The Absolute Gradient of Inequality (AGI) - change over time Between 2015/16 and 2016/17, inequality decreased (but the change was not statistically significant) Between 2014/15 and 2016/17, inequality decreased (but the change was not statistically significant) AGI - comparisons of CCG with Similar 10 Your CCG has lower* inequality than 3 of your Similar 10 Your CCG has similar inequality to 7 of your Similar 10 (4 lower, 3 higher, but the difference was not statistically significant) Your CCG has higher* inequality than 0 of your Similar 10Protected characteristic groups - CCG compared with best 5 of Similar 10 Your CCG had significantly lower* unplanned hospitalisations for 2 of the 22 groups Your CCG had similar unplanned hospitalisations for 15 of the 22 groups(lower for 4, higher for 11 but the difference was not statistically significant) Your CCG had significantly higher* unplanned hospitalisations for 5 of the 22 groupsNotes: *Statistically significant differencesThe number of groups (sex, age and ethnic) shown for a CCG will vary, as groups with insufficient data are not counted.NHS Wolverhampton CCGNHS RightCare5
Executive Statistical SummaryImproving Access to Psychological Therapies (IAPT) 2016/17 - CCG comparedwith best 5 of the Similar 10Quintiles of deprivation - rate of referrals finishing treatment Your CCG had higher* referrals for 0 of the 5 quintiles Your CCG had similar referrals for 0 of the 5 quintiles (higher for 0, lower for 0, but the difference was not statistically significant) Your CCG had lower* referrals for 5 of the 5 quintilesQuintiles of deprivation - percentage of referrals moving to recovery Your CCG had higher* recoveries for 0 of the 5 quintiles Your CCG had similar recoveries for 5 of the 5 quintiles (higher for 0, lower for 5, but the difference was not statistically significant) Your CCG had lower* recoveries for 0 of the 5 quintilesProtected characteristics - rate of referrals finishing treatment Your CCG had higher* referrals for 0 of the 11 groups Your CCG had similar referrals for 3 of the 11 groups (higher for 1, lower for 2, but the difference was not statistically significant) Your CCG had lower* referrals for 8 of the 11 groupsProtected characteristics - percentage of referrals moving to recovery Your CCG had higher* recoveries for 0 of the 11 groups Your CCG had similar recoveries for 9 of the 11 groups (higher for 3, lower for 6, but the difference was not statistically significant) Your CCG had lower* recoveries for 2 of the 11 groupsNotes: *Statistically significant differencesThe number of groups (sex, age and ethnic) shown for a CCG will vary, as groups with insufficient data are not counted. Similarly, thenumber of England quintiles shown will vary, as quintiles with insufficient data are not counted.NHS Wolverhampton CCGNHS RightCare6
Executive Summary - Case Studies and ResourcesThis pack contains a range of case studies on interventions that can be used to help promote equality and reduce health inequalities. These are listedbelow under the area they relate to. More detail on the studies and explanation of how they might be used to support action planning is set out in thesection Promoting Equality and Reducing Health Inequalities, from Data and Case Studies to Action Planning starting on page 44. This section alsocontains links to resources including NHS RightCare products, NHS Health Check Data, the UCL's Institute of Health Equity's website, YorkUniversity's Centre for Health Economics' website and Public Health England's Health Profile for England.New Care ModelsCommunity Outpatient Services (Sandwell and West Birmingham CCG)Healthy Lives (Sandwell and West Birmingham CCG)DigitalDoc Abode - workforce software to improve Urgent and Primary Care Access, Resilience & ScaleEmergency CareSelf Management (Flo Telehealth)Social Prescribing (Rotherham CCG)Falls Specialist Response Car (Queen’s Hospital North East London)GP Led Triage and Redirection (Care UK and St Georges Hospital)Rapid Access Doctor (Sutton CCG)Dedicated Community Nurse (Kingston CCG)Non-clinical Navigators (City and Hackney CCG)Rapid Response Service (Camden)Primary CareDisruptive Prevention (West Wakefield)Improving Working Practices (Tower Hamlets)Tool for Reducing Inequalities in Access to GP ServicesCancerProstate Cancer Diagnosis (UCLH Cancer Collaborative)Catching More Cancers Early (Manchester)Access to Cancer Screening (Kingston)Learning Disability Network Cancer Screening (North East and Cumbria)Psychological TherapiesHealth and Justice – Liaison and Diversion servicesStreet Triage Scheme (Nottinghamshire Healthcare NHS Foundation Trust)Cognitive Behavioural Therapy (CBT) in GP Surgeries (Islington)Improving Access to Psychological Therapies (IAPT) for Older People (Yorkshire)Community Perinatal Team (CPT) (Hertfordshire)Hear Our Voice (Cornwall) - Self-care for Young PeopleMother and Baby Unit (MBU) (South West)Motiv8 (Havant) - Improving Confidence in Young PeopleNHS Wolverhampton CCGNHS RightCare7
Your Equality and Health InequalitiesPackThis pack contains data on a number of healthcare areas in your CCG to demonstrate where there are potentialopportunities for addressing equality and tackling health inequalities. The information contained in this pack isspecific to your CCG and should be used to support local discussions and inform a more in-depth analysis.Additionally, there is information on different interventions that may address these areas. CCGs should considerwhich interventions could be appropriate for their demographic and engage with other CCGs to seek out examplesof successful implementation.By using this information, together with other packs and local intelligence such as the joint strategic needsassessment, long-term conditions and focus packs, your local health economy will be able to ensure its plansfocus on those opportunities which have the potential to provide the biggest improvements in health outcomes andresource allocations and the biggest reductions in health inequalities.NHS England, Public Health England and CCGs have legal duties under the Equality Act 2010 with regard toeliminating discrimination, harassment and victimisation, to advance equality of opportunity, and to foster goodrelations between people who share a relevant protected characteristic and those who do not share it. There arealso legal duties under the Health and Social Care Act 2012 with regard to reducing health inequalities betweenpatients in access to, and outcomes from healthcare services, and to ensure services are provided in an integratedway where this might reduce health inequalities. Commissioners should continue to use these packs andsupporting tools to drive local action to reduce inequalities in access to services and in the health outcomesachieved.NHS Wolverhampton CCGNHS RightCare8
The National Big PictureSocioeconomic StatusPeople living in deprived areas on average have poorer healthand shorter lives. Research shows that socioeconomicinequalities result in increased morbidity and decreased lifeexpectancy. The UCL Institute of Health Equity estimates 1.3to 2.5 million potential years of life lost annually due toinequalities.10The under 75 mortality ratefrom Cardiovascular Disease(CVD) is almost five timeshigher in the most deprivedcompared to the leastdeprived areas1African-Caribbean and Asianfemales over 65 have ahigher risk of cervical cancer2Protected CharacteristicsThese are individuals’ characteristics protected by the EqualityAct of 2010. Understanding these different characteristics canimprove patient care in terms of health outcomes, access andexperiences. There are 9 protected characteristics: Age Pregnancy and maternity Disability Race Gender reassignment Religion or belief Marriage and civilpartnership Sex Sexual orientationLesbian and bisexual womenare twice as likely to haveneverhad a cervical smear test,compared with women ingeneral3Older people report receivingpoorer levels of care thanyounger people with the sameconditions4People with learningdisabilities are 4 times aslikely to die of preventablecauses5South Asians are up to 6times more likely to developtype 2 diabetes6Suicide is currently thebiggest killer of men under35 in the UK7It is becoming more commonfor children to develop type 2diabetes8Muslim people report worsehealth on average comparedto other religious groups9Sources1. NHS Outcomes Framework inequality indicators, NHS Digital (2016). 2. Forman, D. "Cancer incidence and survival by major ethnic group, England, 2002–2006". National Cancer IntelligenceNetwork (2009). 3. Kerker, Bonnie D., Farzad Mostashari, and Lorna Thorpe. "Health care access and utilization among women who have sex with women: sexual behavior and identity". Journal of UrbanHealth 83.5 (2006): 970-979. 4. Melzer, David, et al. "Health Care Quality for an Active Later Life". Peninsula College of Medicine and Dentistry, University of Exeter (2012). 5. Rees S, Cullen C, Kavanagh S,Lelliott P. Chapter 17 Learning Disabilities. In: Stevens A, Raftery J, Mant J, Simpson S. (eds.) Health Care Needs Assessment. First Series. Second. Oxford: Radcliffe Publishing Ltd; 2004. pp451–540.6. Khunti, Kamlesh. Diabetes UK and South Asian Health Foundation recommendations on diabetes research priorities for British South Asians. Diss. University of Warwick, 2009.7. esintheunitedkingdom/2015registrations ONS, 2015.8. Haines, Linda, et al. "Rising incidence of type 2 diabetes in children in the UK". Diabetes care 30.5 (2007): 1097-1101. 9. 2011 Census data.10. Marmot, M. "Fair society, healthy lives : the Marmot Review : strategic review of health inequalities in England post-2010" (2010).NHS Wolverhampton CCGNHS RightCare9
Why Should Addressing HealthInequalities be a Priority for CCGs?The NHS is dedicated to delivering better care for individuals, lowering per-capita cost andimproving population health. Health inequalities are an important component of population healthand one that should be a central priority for CCGs. It is a moral imperative concerning social justice. The issue should be of great importance toa caring and compassionate service. It is a legal requirement. The Health and Social Care Act (2012) placed responsibilities onCCGs (amongst others) to "demonstrably take account of inequalities in access to andoutcomes of healthcare". It makes good business sense. The burden of ill health and disability, as well as prematuremortality, is disproportionately focussed on the most deprived populations. These sections ofsociety are least equipped and resourced to make best and most appropriate use of services. Ifthe ‘unmet need’ for preventive services and those for early detection and management is notaddressed in those at greatest risk, a large part of the growing burden and cost will persist.NHS Wolverhampton CCGNHS RightCare10
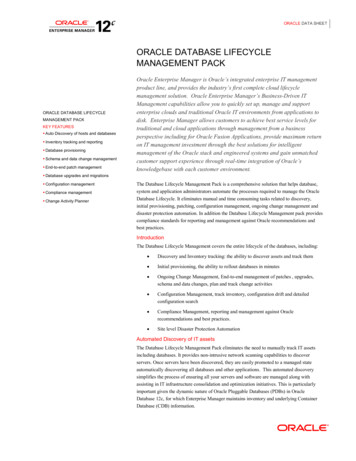
What Contributes to the Development ofHealth Inequalities?Figure 1 shows how social determinants of inequality (‘Riskconditions’ and ‘Psycho-social risks’), resultant ‘Behaviouralrisks’ and the subsequent ‘Physiological risks’ are all linked.Strategies to impact on health inequalities as a whole need toinclude interventions addressing all levels.Figure 1: Pattern of risks affecting health and wellbeingHealth andwell-beingThe CCG will have important partnership roles within the Healthand Wellbeing Board and other place-based units of planninge.g. Integrated Care Systems and their contribution ascommissioner or provider will differ across the three levels.How can CCGs identify priorities andopportunities for improvement?Working as a statutory partner in the Health and WellbeingBoard, the CCG will play their part, where possible, inaddressing social determinants (Risk conditions and Psychosocial risks) through the Health and Wellbeing Strategy. Thesewill include issues such as education and skills, joblessness,income and debt and housing.To an extent, however, the NHSRightCare materials clusterCCGs with similar social determinants together, and thenexplore how effective similarly placed systems are being ataddressing Behavioural risks and Physiological risks.NHS Wolverhampton CCGPhysiological risks:High blood pressureHigh cholesterolHigh blood sugarChronic increase in mokingPoor dietLack of activityRisk conditions:PovertyLow social statusPoor educational attainmentUnemploymentVulnerable housingDangerous environmentsDiscriminationSteep power hierarchyGaps/weaknesses inservices and supportPsycho-social risks:IsolationLack of social supportPoor social networksLow self-esteemHigh self-blameLow perceived powerLoss ofmeaning/purpose of lifeNHS RightCare11
Your Most Similar CCGsYour CCG is compared to the 10 most demographically similar CCGs. This is used to identifyrealistic opportunities to improve health and healthcare for your population. The analysis in thispack is based on a comparison with your most similar CCGs which are: NHS Walsall CCG NHS Hillingdon CCG NHS Bolton CCG NHS Oldham CCG NHS Heywood, Middleton and Rochdale CCG NHS Leeds North CCG NHS Bradford Districts CCG NHS Bury CCG NHS Stoke on Trent CCG NHS Tameside and Glossop CCGTo help you understand more about how your most Similar 10 CCGs are calculated, the Similar 10Explorer Tool on the NHS England website is available r-10-ccg-explorer-tool/This tool allows you to view similarity across all the individual demographics used to calculate your10 most similar CCGs. You can also customise your Similar 10 group by weighting towards adesired demographic factor.NHS Wolverhampton CCGNHS RightCare12
Measure of DeprivationMinistry of Housing, Communities and Local Government's Index of Multiple Deprivation (IMD) for 2015The IMD ranks each small area in EnglandIMD 2015 covers 7 domains of deprivation: income, employment, education, health, crime, barriers tohousing and services and living environment and can be used for the following: Comparing small areas across England Identifying the most deprived small areas Exploring the domains (or types) of deprivation Comparing larger areas e.g. local authorities Looking at changes in relative deprivation between versions (i.e. changes in ranks)IMD 2015 is used to construct key deprivation based inequality measures within these packs.See the link below for more on IMD sh-indices-of-deprivation-2015NHS Wolverhampton CCGNHS RightCare13
Your DataThis pack presents a variety of indicators. For each indicator, inequality within your CCG is measured, and then compared to your Similar 10CCGs. Indicators for England are often included. This analysis is beneficial for showing current progress for CCGs, and forms one stage ofa process. The aim is to shine a spotlight on variations in practice within and between CCGs, to help identify and share best practice inaddressing equality and tackling health inequalities.The indicators make the best use of available data. However, data and analysis have limitations.The 2 areas covered are:CCG Improvement and Assessment Framework (IAF) Health Inequalities IndicatorsThese are from the CCG IAF, based on methods developed by Richard Cookson, Miqdad Asaria and Shehzad Ali from the University ofYork, in a project funded by the National Institute for Health Research*. These are secondary care indicators that reflect on how well CCGsdo overall in addressing inequalities in healthcare access and outcome between the most and least deprived members of the population.CCG Indicators for Protected Characteristics for Increasing Access to Psychological Therapies (IAPT)Equity indicators by socioeconomic status, sex, age and ethnicity groups have been constructed for IAPT services usingrates of referral finishing a course of treatment (an access measure) and rates of movement to recovery for referrals finishing acourse of treatment (an outcome measure).Source* Health Equity Indicators for the English NHS: a longitudinal whole-population study at the small-area level. Cookson et. al. HEALTHSERVICES AND DELIVERY RESEARCH 2016 VOL. 4 NO. 26. currently available 04260#/abstractNHS Wolverhampton CCGNHS RightCare14
Inequalities in Unplanned HospitalisationsThis section relates to the CCG Improvement and Assessment Framework (IAF) HealthInequalities Indicator 106a: Inequality in Unplanned Hospitalisations for ChronicAmbulatory Care Sensitive and Urgent Care Sensitive Conditions for 2016/17NHS Wolverhampton CCGNHS RightCare15
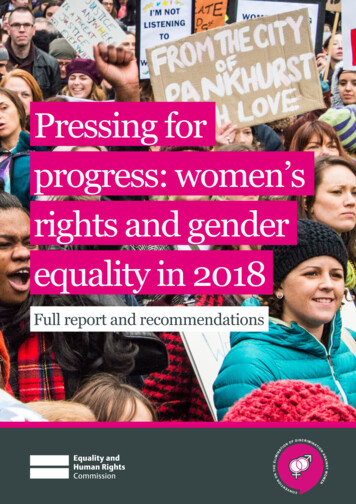
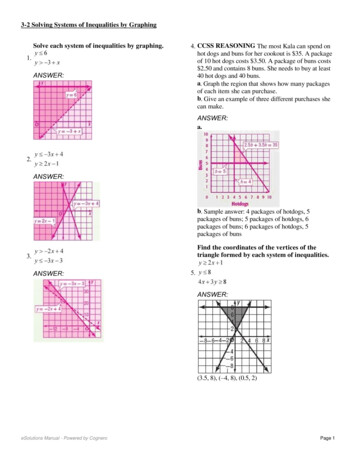
The Absolute Gradient of Inequality (AGI) for Unplanned Hospitalisations for Chronic Ambulatory CareSensitive Conditions and Urgent Care Sensitive Conditions for 2016/17Explaining the AGI with an unspecified CCGWe will be using the Absolute Gradient of Inequality (AGI) as a measure of health inequalities within each CCG. Here,and in the next slide, we explain this measure.3. This neighbourhood haslow deprivation and lowrates of unplannedhospitalisations.2. Each neighbourhoodhas a rate of unplannedhospitalisations.NHS Wolverhampton CCG4. This neighbourhood has highdeprivation and high rates ofunplanned hospitalisations.1. The Index of Multiple Deprivation (IMD) is used to rankneighbourhoods from least deprived to most deprived.5. The line is the general trend.Lower deprivationneighbourhoods tend to havelower rates of unplannedhospitalisations, and higherdeprivation neighbourhoods havehigher rates.6. This height is the Absolute Gradient ofInequality (AGI). This height and thegradient of the line both measure the AGI,because the steeper the gradient, the greaterthe height. The greater the inequality, thegreater the gradient/height, and so thegreater the AGI.NHS RightCare16
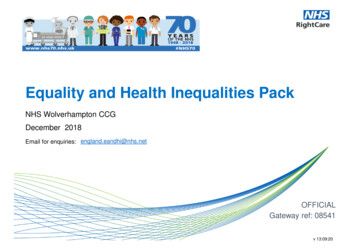
The Absolute Gradient of Inequality (AGI) for Unplanned Hospitalisations for Chronic Ambulatory CareSensitive Conditions and Urgent Care Sensitive Conditions for 2016/17Explaining the AGI with unspecified CCGsThe charts below show how health inequalities, and therefore the AGI, can vary from CCG to CCG.The steeper the gradient of the line of best fit, the greater the height of the blue line, the greater the AGI and so thegreater the inequality.NHS Wolverhampton CCGNHS RightCare17
Unplanned Hospitalisations for Chronic Ambulatory Care Sensitive Conditions and Urgent Care Sensitive Conditions for 2016/17The Absolute Gradient of Inequality (AGI) for your CCGThe chart below shows the AGI for your CCG. The steeper the gradient of the line of best fit, the greater the height of the blue line, the greater the AGI and so thegreater the inequality. The chart shows neighbourhoods, which are also known as Lower Super Output Areas (LSOAs).TotalSources: Unplanned hospitalisations: 2016-17 Secondary User Service (SUS), NHS Digital. Population data: CCG registered population for Oc tober 2016, NHS Digital.Note: Numbers less than 6 have been suppressed when plotting neighbourhoods but have been included in overall calculations.NHS Wolverhampton CCGNHS RightCare18
Unplanned Hospitalisations for Chronic Ambulatory Care Sensitive Conditions and Urgent Care Sensitive Conditions 2016/17Inequality in your CCG compared with your Similar 10 and other CCGs in EnglandEach ranked bar on the chart represents the level of inequality in a CCG*. The red bar is your CCG and the yellow bars are the Similar 10 CCGs. TheseCCGs are also shown in the table below alongside their Absolute Gradient of Inequality (AGI) value, ranked from lowest (1) to highest (11) inequality.The CCGs in the highest quintile have the highest levels of inequality. The heatmap shows the geographical variation in levels of inequality across thecountry. The darkness of shades shows the CCGs' inequality with the darkest quintile having the highest inequality.NHS Wolverhampton CCGSimilar 10 CCGsHighest quintile of inequalityLowest quintile of inequalityLondonRank1234567891011CCG NameNHS Hillingdon CCGNHS Bury CCGNHS Leeds North CCGNHS Oldham CCGNHS Wolverhampton CCGNHS Heywood, Middleton and Rochdale CCGNHS Walsall CCGNHS Stoke on Trent CCGNHS Bolton CCGNHS Tameside and Glossop CCGNHS Bradford Districts 52,8693,046Sources: Unplanned hospitalisations: SUS 2016/17, NHS Digital, population data - CCG registered population, October 2016, NHS DigitalNotes: * Difference in age sex standardised rates of unplanned hospitalisation per 100,000 population between the most and least deprived neighbourhoods in England if England had the same inequality as the CCG. See NHSEngland CCG Improvement and Assessment Framework Technical Annex for more details.NHS England CCG Improvement and Assessment Framework Technical AnnexNHS Wolverhampton CCGNHS RightCare19
Unplanned Hospitalisations for Chronic Ambulatory Care Sensitive Conditions and Urgent Care Sensitive Conditions 2016/17Inequality in your CCG compared with your Similar 10The current levels of inequality for your CCG and its Similar 10 CCGs are shown by the bars on the ranked chart. The 95% confidenceinterval error bars illustrate the uncertainty in the measure of inequality. Horizontal lines represent the mean of the Similar 10 as well asEngland. CCGs that are below the Similar 10 Mean have less inequality than its Similar 10 CCGs.Sources: Unplanned hospitalisations - Secondary User Service (SUS) 2016/17, NHS Digital, population data - CCG registered population, October 2016, NHS Digital.NHS Wolverhampton CCGNHS RightCare20
Unplanned Hospitalisations for Chronic Ambulatory Care Sensitive Conditions and Urgent Care Sensitive ConditionsTime Series for your CCG's Inequality compared with your Similar 10 and EnglandThe current and previous levels of inequality for your CCG are shown by the solid line on the line chart. The 95% confidence intervalerror bars illustrate the uncertainty in the measure of inequality. The England average, and the average of the Similar 10 are also shownas benchmarks.Sources: Unplanned hospitalisations - Secondary User Service (SUS) 2016/17, 2015/16, and 2014/15 (where available), NHS Digital, population data - CCG registered population, October 2016, NHS Digital.Note: * Difference in age sex standardised rates of unplanned hospitalisation per 100,000 population between the most and least deprived neighbourhoods in England if England had the same inequality as the CCG.NHS Wolverhampton CCGNHS RightCare21
Unplanned Hospitalisations for Chronic Ambulatory Care Sensitive Conditions and Urgent Care Sensitive Conditions for 2016/17Determining Priority Wards for Inequality for your CCGThis slide shows wards rather than neighbourhoods, because wards may be more familiar to CCGs and are around 4 times as large which helps toaddress statistical uncertainty. The dots on the chart represent the wards in your CCG. Dot sizes vary depending on the ward population. The redline shows the line of best fit for your CCG. The slope of the line shows the Absolute Gradient of Inequality (AGI). The steeper the line, the greaterthe level of inequality. The red priority wards are those in the most deprived half of your CCG (based upon the Index of Multiple Deprivation), thatare above the red line. Priority wards are important because they are the wards associated with inequality .Sources: Unplanned hospitalisations: 2016-17 Secondary User Service (SUS), NHS Digital. Population data: CCG registered population for October 2016, NHS Digital.Note: Numbers less than 6 have been suppressed when plotting wards but have been included in determining the line of best fit.NHS Wolverhampton CCGNHS RightCare22
Unplanned Hospitalisations for Chronic Ambulatory Care Sensitive Conditions and Urgent Care Sensitive Conditions for 2016/17Priority Wards for Inequality for your CCGUp to 20 priority wards, with at least 50 hospitalisations, for your CCG are listed below. The final column shows the opportunity for saved hospitalisations if yourCCG had no inequality. This is the number of hospitalisations that would be saved if expected rates for priority wards moved to the expected rate at 19202015 wardBushbury South and Low HillBilston EastHeath TownEast nnedhospitalisationsper 100,000 spitalisations504471451426.Opportunity for savedhospitalisations, if yourCCG had no inequality48513537.1,852171Sources: Unplanned hospitalisations: 2016-17 Secondary User Service (SUS), NHS Digital. Population data: CCG registered population for Oc tober 2016, NHS Digital.Notes:Figures are taken from the Total (where 1 to 5 replaced with 3) column of the Top 10 conditions for priority wards table.Numbers less than 6 have been suppressed.*See Methodology Guide for further details**Age-sex standardisedNHS Wolverhampton CCGNHS RightCare23
Unplanned Hospitalisations for Chronic Ambulatory Care Sensitive Conditions and Urgent Care Sensitive Conditions for 2016/17Priority Wards for Inequality and Uncertainty for your CCGThe chart below shows up to 20 priority wards, with at least 50 hospitalisations, for your CCG. The blue bars (with 95% confidence intervals to show uncertainty) showthe number of unplanned hospitalisations. The yellow bars show the opportunity for saved hospitalisations, if your CCG had no inequality. This is the number ofhospitalisations that would be saved if expected rates for priority wards moved to the expected rate at median deprivation*.Sources: Unplanned hospitalisations: 2016-17 Secondary User Service (SUS), NHS Digital. Population data: CCG registered population for October 2016, NHS Digital.Notes:Figures are taken from the Total (where 1 to 5 replaced with 3) column of the Top 10 conditions for priority wards table. *See Methodology Guide for further details.NHS Wolverhampton CCGNHS RightCare24
Unplanned Hospitalisations for Chronic Ambulatory Care Sensitive Conditions and Urgent Care Sensitive Conditions for 2016/17Top 10 Conditions for Inequality in all Priority Wards for your CCGThe table below shows the number of unplanned hospitalisations for all your CCG's priority wards with at least 50 hospitalisations combined.This is broken down by the top 10 conditions in your CCG. The opportunity for saved hospitalisations if your CCG had no inequality is alsoshown*.Unplanned hospitalisations by conditionPain in throat and chestAbdominal and pelvic painOther disorders of urinary systemOther chronic obstructive pulmonary diseaseHeart failureCellulitisAsthmaAtrial fibrillation and flutterFracture of femurEpilepsyOtherTotalOpportunity for saved hospitalisations, if
We would like to thank the many colleagues across NHS England for their help developing these packs, including the . The National Big Picture 9 . Your data 14 Inequalities in Unplanned Hospitalisations 15-32 Inequalities in Psychological Therapies 33-43 Resources for Addressing Health Inequalities 44-53 Useful Links .