Transcription
Panic! Social Class, Taste and Inequalitiesin the Creative Industries
Social Class, Taste and Inequalities in the Creative IndustriesLead authors:Dr Orian Brook, Dr David O’Brien, and Dr Mark Taylor. 1This report forms part of Panic! It’s an Arts Emergency project, anddraws on several academic papers. 2 Those papers, which are allavailable via the web links in the text, have been written in collaboration with several co-authors. More information can be found in theIntroduction and Appendix.The authors commissioned Create London to deliver a cultural programme around the themes of this research. As part of this, CreateLondon and the Barbican will convene an afternoon of discussion atthe Barbican Centre, to reflect on the content of this report andshare it with the sector and the public: ! It’s an Arts Emergency additionally comprises a public resourceby Arts Emergency, a creative careers project for young people, anda new work by artist Ellie Harrison. It is a continuation of a projectinitiated by Create London in 2015, which included a nationwidesurvey of artists and creative industries workers (the Panic! dataset)and follow up interviews. Find out more about all of the above at:www.createlondon.org/event/panic2018/Funded by the Arts and Humanities Research Council. 31. Contact @orianbrook @drdaveobrien @markrt or d.obrien@ed.ac.uk2. This report draws on several papers, both working papers and published final versions.The academic papers are all available from the web links in the text, and have beenwritten in collaboration with several co-authors. We’d like to thank Peter Campbell(University of Liverpool), Sam Friedman (London School of Economics), Daniel Laurison(Swarthmore College), Siobhan McAndrew (University of Bristol), Andrew Miles(University of Manchester), and Kate Oakley (University of Leeds).3. ‘Who is missing from the picture? The problem of inequality in the creative economyand what we can do about it.’ Project Reference AH/P013155/1
Social Class, Taste and Inequalities in the Creative IndustriesContentsp. 1Introductionp. 3Part 1Getting in and getting on: Beliefs in meritocracyp. 11Part 2Culture’s unequal workforce: How people of WorkingClass origin have been and continue to be excludedp. 20Part 3Who gets paid to work in the arts? The problemof unpaid labour in cultural industriesp. 25Part 4Attitudes, values and tastes: An unrepresentative‘creative class’?p.34Conclusionp. 35AppendixResearch and resourcesComposition of the creative workforceData and methodsKey terms
Social Class, Taste and Inequalities in the Creative IndustriesIntroductionThe idea of a fair and diverse industry is central to current discussions about cultural and creative jobs. However, as this report willdemonstrate, the cultural and creative industries are marked bysignificant inequalities; in particular, we look at the social class background of the workforce, and how this intersects with other issues,including attitudes and values, experiences of working for free,social networks, and cultural tastes.Inequality in the arts regularly forms the basis for public discussions about culture in Britain. For example, we have recently seenscandals over gender pay gaps at the BBC; political inquiries aboutworking class representation in the theatre industry; and a wealth ofblogging and social media commentary focused on representationsof race and ethnicity in the arts.What is missing is an understanding of the scale of social inequalities, along with a clearer understanding of how these inequalitiesoperate.This was the starting point for a team of academics from the Universities of Edinburgh and Sheffield who undertook research fundedby the Arts and Humanities Research Council, as part of a schemeto create public impact with academic research on the creativeeconomy. This public impact is being co-produced and deliveredthrough the Panic! 2018 project, led by Create London. CreateLondon in turn is working in partnership with the Barbican Centreand Arts Emergency to deliver a cultural programme around thethemes of this research. The report creatively visualises data andanalysis. Full tables, graphs, and figures are available from theacademic papers.This report presents: the first analysis of cultural and creative workers’ values and attitudes, using data from the British Social Attitudes Survey the first analysis of cultural and creative workers’ cultural attendance, using data from the Department for Culture, Media andSport’s (now the Department for Digital, Culture, Media and Sport)Taking Part Survey the first analysis of social mobility into cultural occupations usingdata from the Office for National Statistics’ Longitudinal Study an analysis of the demographics of the cultural and creative workforce using the Office for National Statistics’ Labour Force SurveyIntroduction1
Social Class, Taste and Inequalities in the Creative Industries analysis of survey and interview data from the 2015 Panic! Whathappened to social mobility in the arts? project. This analysisdemonstrates participants’ experiences and understandings ofunpaid work; their social capital; and their views on getting in andgetting on in cultural and creative occupations.The report adopts an inter-sectional approach to workforce inequalities, where the data allows. As a result, the report shows thatthe cultural and creative sector is marked by significant exclusionsof those from working class social origins. We try to demonstratehow it intersects with other characteristics, primarily gender andethnicity. Women, and those from Black and Minority Ethnic (BAME)communities face barriers in addition to those associated withsocial class origin. Class as discussed in the report is much morethan media clichés about “the white working class”.In terms of social class, social mobility has been a longstandingproblem for the sector, meaning that it is currently dominated bythose from affluent social origins. There was also no ‘golden age’ forsocial mobility within the cultural sector.At the same time, our analysis of the Panic! dataset shows thoserespondents who are the best paid are most likely to think the sectorrewards talent and hard work, and are least likely to see exclusionsof class, ethnicity and gender in the workforce.The Panic! data also shows respondents’ limited social networks:how the creatives responding to the Panic! Survey tended to knowother creatives, to the exclusion of many other occupations.The workforce inequalities are reinforced by the prevalence ofunpaid labour. Panic! respondents overwhelmingly said they hadworked for free.Alongside the inequalities in the workforce, this report paints apicture of a cultural sector which is exclusive in more subtle ways.The analysis shows the taste patterns of cultural workers are substantially different from those of the rest of the population; this difference is replicated in workers’ values and attitudes, which are themost liberal and left wing of any set of occupations.The report summarises a specific set of research papers, usingspecific datasets. As a result, it is not a comprehensive picture ofevery axis of social inequality. Much more research is needed on, forexample, the impact of disability on the creative workforce and onarts audiences.However, the research presented and summarised here is animportant challenge for the cultural industries in Britain.Introduction2
Social Class, Taste and Inequalities in the Creative IndustriesPart 1: Getting in and getting on: Beliefs in meritocracy 4To begin, we introduce data from the Panic! Survey which took placein 2015, and which received 2,487 unique responses.We explore how a high proportion of respondents to the originalPanic! Survey believe that success in their sector is based on hardwork and talent (otherwise known as ‘meritocratic’ beliefs); and howthe survey respondents who are most attached to this idea arehighly-paid white men, irrespective of age.We then use data from the 237 interviews conducted followingthe Panic! Survey to illustrate how these meritocratic beliefs aretalked about and experienced.This is troubling, as the faith in the sector’s meritocracy may signala belief that little or nothing should change. Particularly worrying isthe fact that those people who are in the best position to effectchange are the very people who most strongly support the meritocratic explanation.This discussion sets the scene for the rest of the report, as we goon to show how the prevailing belief in meritocracy is not matchedby the reality of the sector.The starting point for showing this mismatch comes from analysingthe social networks or the ‘social capital’ of Panic! respondents.The analysis shows our cultural and creative workers have narrowsocial networks, suggesting a type of social closure within the sector.Panic! respondents believe in meritocracyDid our Panic! Survey respondents think the cultural and creativeindustries were fair? We used responses to a standard set of questions about working in the creative industries to understand arespondent’s perceptions of fairness in the sector.We asked: ‘Looking at your creative occupation as a whole, howimportant do you think each of these is in getting ahead?’ We offereda range of answers for them to rate in terms of importance:-coming from a wealthy family;having well-educated parents;being well educated;having ambition;4. This analysis is based on Taylor, M. and O’Brien, D. (2017) “‘Culture is a meritocracy’:Why creative workers’ attitudes may reinforce social inequality,” Sociological ResearchOnline 22(4). Available 60780417726732Part 1: Getting in and getting on: Beliefs in meritocracy3
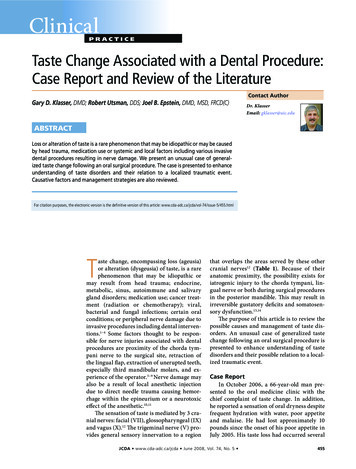
Social Class, Taste and Inequalities in the Creative Industries-hard work;knowing the right people;your talent;your ethnic group;your gender;your class;your religion.This question, and the range of responses, is used in standard surveysinternationally and is validated as a way of exploring people’s attitudes.In our analysis, we grouped the responses along three lines.First there were responses associated with ‘meritocracy’. Theseinclude talent, ambition, and hard work. This cluster of responsessuggests individuals get rewarded for what they put in, or receivewhat they deserve from the sector, irrespective of background orprivileges.Our second group reflects what social scientists call ‘social reproduction’ explanations, such as networks (who you know), familybackground and wealth, along with gender and ethnicity. Theseexplanations point to barriers in the cultural sector, so that no matterhow talented or hard working someone is, they will still struggle ifthey aren’t part of the same class, ethnicity, and/or gender as thepeople hiring and promoting them.Finally, there are responses associated with education – people’sown, and their parents’. These responses didn’t fit closely with eitherset of responses. Research shows a strong relationship betweensomeone’s level of education and their abilities, but also finds thatpeople from middle class homes have better access to eliteeducational institutions.Figure 1 shows the pattern of our respondents’ answers relatingto meritocracy and social reproduction.At the top left-hand corner we find those respondents (30%) whomost strongly think that talent and hard work explains getting in andgetting on in the cultural and creative industries (CCIs), and do notagree that class and knowing the right people are important. Theserespondents describe the sector as ‘meritocratic’.Part 1: Getting in and getting on: Beliefs in meritocracy4
Social Class, Taste and Inequalities in the Creative IndustriesHow responses cluster around meritocracy or social reproductionMore likely to say Meritocracy is importantFigure 12134More likely to say Social Reproduction is importantPart 1: Getting in and getting on: Beliefs in meritocracy5
Social Class, Taste and Inequalities in the Creative Industries1234This person believes ambition, hard work and talent, as well asethnicity, class and gender all very important or essential togetting ahead. They combine both meritocracy and social reproduction explanations for success.This person believes ambition, hard work and talent are essentialto getting ahead, but ethnicity, class, and coming from a wealthyfamily are not important at all to getting ahead. They suggestmeritocracy explains success.This person believes ethnicity, class and gender were not important at all, and that ambition, hard work and talent were onlyfairly important. They emphasise neither meritocracy nor socialreproduction in their explanation of success.This person believes coming from a wealthy family, knowing theright people and class are very important to success, but talentand hard work were not very important. They suggest socialreproduction explains success.By contrast to the top left hand corner, those respondents clusteredin the bottom right hand corner (21%) were most likely to suggest‘social reproduction’. These respondents emphasised social barriersor exclusions, rather than talent or hard work.The top right-hand corner clusters those (34%) who emphasisedboth social reproduction and meritocracy; those believing hard workand talent are essential, but acknowledging the roles of barriers andexclusions.Finally, those respondents in the bottom left-hand corner (16%)emphasise neither, perhaps believing that success in the CCIs is moreor-less random.As we can see, the majority of respondents are in the top area ofthe plot. This suggests the prevailing opinion among our surveyrespondents was towards a belief that the sector is meritocratic.Some respondents recognised the influence of social factors, suchas class, age, race, and ‘who you know’. But the majority of respondents believe that hard work, talent, and ambition are essential togetting ahead.To put this in some context, the people at the meeting point of thefour sections described coming from a wealthy family and class as fairlyimportant, ambition and talent as very important, and hard work asessential. So almost all the people whom we have classified asbelieving in social reproduction will have drawn on some element ofthe meritocracy characteristics in their explanation for success.Part 1: Getting in and getting on: Beliefs in meritocracy6
Social Class, Taste and Inequalities in the Creative IndustriesLevels of agreement with these explanations of “getting in andgetting on” in the sector were similar across the demographics ofour respondents, with similar stories told by women, by people ofworking class origin, and by people from ethnic minority backgrounds.However, there is one group that stands out – the highly paid.These respondents, who are in the most influential positions in thecreative industries, believe most strongly in meritocracy. They arealso most sceptical of the impact of social factors, such as gender,class or ethnicity, on explanations for success in the sector.Interestingly, the best paid and those in senior roles hold theseattitudes irrespective of their starting point in life. It seems, lookingat the Panic! respondents, once people have achieved major successwithin the sector they become most committed to talent and hardwork as explaining that success. Those who most believed in meritocracy in the sector, and who were least likely to believe in socialreproduction, were those being paid more than 50,000 per year.We saw this combination of beliefs in meritocracy and social reproduction in many of the discussions with our interviewees.Rachel, Kate and Zoe all used ‘hard work’, or ‘meritocracy’ explanations for success. For example, they stressed hard work and tenacity,rather than their class, or networks in their perceptions of success:‘Most people who have got successful would have had to be quitetenacious is that the word? In terms of like keeping on submittingthings and like going up for competitions or trying to get involvedwith events and things, because yeah it is hard to get anywhere ifyou are quite shy or lacking in confidence I suppose.’– Rachel, a white middle class social origin woman in her 30s,working in publishing‘I genuinely think keeping going is a huge part of it. You know whenI was in my early 30’s a lot of friends stopped being actors andwriters and they stopped because they wanted to buy housesor they wanted to have children and they wanted the security However, the main difference was tenacity in my view becauseI haven’t been lucky.’– Kate, a white working class social origin woman in her 50s,working in publishing‘I think there is a bit of luck to it, but I think at the end of the day thepeople who will succeed are really the people who are willing tosacrifice the most for it I think it is the people who are willing togive up the other bits of their life who are most likely to succeed.’– Zoe, a white, middle class social origin woman in her 20s,working in theatrePart 1: Getting in and getting on: Beliefs in meritocracy7
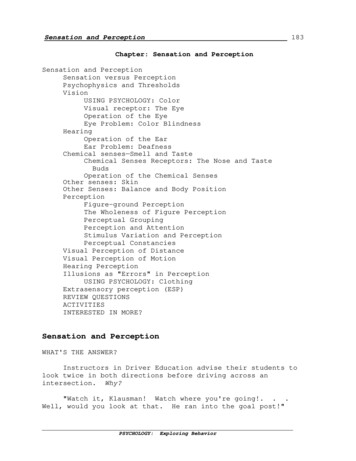
Social Class, Taste and Inequalities in the Creative IndustriesWe can contrast this with ‘social reproduction’ explanations. Nishaand Jennifer both cite the importance of social networks in theirstories of who is successful.‘The UK film industry is not a meritocracy at all. It doesn’t matterif you’re intelligent or well qualified or any of those things. Whatmatters is who you know and who you’ve worked with.’– Nisha, a British Asian woman from middle class social originsin her 30s, working in film and television‘I think the trouble with the arts industry is that it’s so based onnetworking and the sort of social skills, how you behave atopenings I have a colleague who is a freelance artist. He’s from amiddle class background and he’s a bloke. I was just left stunnedby his ability to just introduce himself and start talking to peopleand networking in the middle of this seminar.’– Jennifer, a white working class origin woman in her 60s,working in visual artsJennifer connects the characteristics of male, middle class-ness tosuccess at networking, and networking to success in the arts.Existing academic research has demonstrated that networks,(who you know), are crucial to getting in and getting on in the creativeindustries. This is especially true in those creative occupations thatare predominantly freelance.Just hard work? Or does it help to know people?What sort of jobs were included in the networks of our Panic! respondents? As part of the Panic! Survey we asked the 2,487 respondents to tell us about their networks. We asked if they knew peoplein a range of different jobs, whether as friends or as family members.Figure 2 shows the Panic! Survey respondents’ answers to ‘whodo you know?’Part 1: Getting in and getting on: Beliefs in meritocracy8
Social Class, Taste and Inequalities in the Creative IndustriesFigure 2Which occupations do creative workers know?ETURLECRBANKMANAGERPOSTMAN100%RYO ERCT RKFA OWGDE RASI PHG ICNESTTIRABUDRIV SERR75%ACTORSASGL nic!SurveyrespondentsI STALCRRNETARYJOU2 5%CLO ERFF I CIC AER LSE5 0%N75%URSEDAN100%CETHAURARCH ITE C TSOFTWAREDEVELOPERPart 1: Getting in and getting on: Beliefs in meritocracyORORCITSOLI9
Social Class, Taste and Inequalities in the Creative IndustriesThis diagram shows how Panic! respondents were disproportionately likely to know other cultural and creative workers and less likelyto know people working in non-creative jobs (as friends, family members and colleagues). They seem to know other creatives, ratherthan knowing factory workers, bus drivers or solicitors, althoughthey were also likely to know lecturers, and sales assistants. Broadly,the jobs they were least likely to know people in were traditionallyworking class jobs, such as factory workers, bus drivers, and postalworkers, although they were also unlikely to know bank managers.This is as expected, given the nature of their occupational networks, and may reflect the fact that those in middle class occupations tend not to know many people in working class occupations,either as friends or as family members. It may also reflect the smallernumbers of traditional ‘working class’ occupations in society overall(as we discuss in Part 2).ConclusionOne way of reading these results is to conclude that knowing othercreatives is essential for finding work. The socially homogeneousnature of our respondents may simply reflect the need to know othercreatives for work.Likewise, the prevailing opinion in the Panic! responses was thatthe sector is fair. Hard work is the most important thing for gettingahead, talent is rewarded, and a person’s religion, gender, ethnicity,and class are much less important.However, these interpretations raise questions in the context ofinequalities in the sector.First, to what extent are cultural and creative occupations accessible to all? Especially if they are, by occupational network, quitehomogeneous? Moreover, even the shared belief in meritocracy hassome important distinctions, as the quotes from Nisha and Jennifersuggested. These distinctions can be mapped onto broader socialinequalities.To what extent is the cultural sector delivering on representingindividuals, communities and the nation if Panic! data suggests itssocial networks are relatively homogenous and coherent? And if itsworkers share a belief in meritocracy?Looking at our CCIs, who is missing from the picture? Parts 2, 3and 4 suggest culture is marked by serious inequalities and is not themeritocracy Panic! respondents think it is.Part 1: Getting in and getting on: Beliefs in meritocracy10
Social Class, Taste and Inequalities in the Creative IndustriesPart 2: Culture’s unequal workforce: How people of WorkingClass origin have been and continue to be excluded‘It’s just so important, because people don’t believe you. People justthink that you have a chip on your shoulder, and I hate that. That’swhy I don’t talk about it. I don’t want people to think that I have achip on my shoulder, but I just feel, and I really don’t think I’m beingparanoid, but I just really feel that the mathematics don’t add up, andI don’t think it’s a skills gap issue, which everyone would like youto believe. I think it’s a hiring issue, and I think it’s a systemic issue.I wouldn’t care so much if it was a systemic and hiring issue inbanking, but I care because it’s in the arts. It really fucking sucksthat it’s in the arts, because we’re suffering because of it, and thiscountry and its cultural output is suffering because of it.’– Nisha, a British Asian woman from middle class social origins in her30s, working in film and television. Panic! Survey respondent.The quote above illustrates a key frustration at the gap between perceptions of the sector and the reality in terms of who is in the workforce and how workers make a living.Moreover, Nisha’s comment draws attention to why who works inthe arts is such an important issue.In this part, we contrast the belief in hard work and talent as explanations for success, discussed in Part 1, with the reality of themakep of the workforce.Currently, a key characteristic of the British cultural and creativeworkforce is the absence of those from working class social origins.At the same time, there are significant under-representations ofwomen and those from minority ethnic communities in specificcultural occupations such as Film, TV, video, radio and photography;and Music, performing, and visual art.People working within culture, making culture, are not currentlyrepresentative of the nation’s demographics and there is more workto be done to truly make the workforce open to all.We also show that this is a longstanding problem, there was no‘golden age’ for social mobility and equality in cultural occupations.Part 2: Culture’s unequal workforce: How people of Working Class originhave been and continue to be excluded11
Social Class, Taste and Inequalities in the Creative IndustriesWho works in cultural and creative occupations?Inequalities and exclusions in the current workforce are demonstrated in findings from two academic papers analysing Office forNational Statistics (ONS) data on the British workforce. 5In the Appendix you can find a table with the the basic demographics of the occupations constituting the cultural and creativeindustries in the UK. In Figure 3 we highlight some key findings. Weuse ethnicity, gender and class 6 as three demographic categoriesto show issues of inequality in the jobs producing culture in the UK.Figure 3Creative Industries Workforce DemographicsVandSPERFORMSIC,INMUGniaOAL ARTSSUVIIADRin FILM, TndRSKEORWBAME WORKESEIEBAMEUMS, GALLEUSRRSMinARIESIBRdLanBAME WORKEREthnicity4.8%2.7%4.2%ORIGINS inPASSUBCLGLNRIGINS in FILM,SOSTVLACORRKING CLASSWONGWORKIUSIC, PERFin MORMI18.2%ISUAL . This analysis is based on O’Brien, D., Laurison, D., Friedman, S. and Miles, A. (2016).‘Are the creative industries meritocratic? An analysis of the 2014 British Labour ForceSurvey’, Cultural Trends, 25, 116–131. Available from 1170943?journalCode ccut20and Oakley, K., Laurison, D., O’Brien, D. and Friedman, S. (2017) ‘Cultural Capital:Arts Graduates, Spatial Inequality, and London’s Impact on Cultural Labor Markets’,American Behavioral Scientist 61(12), 1510–1531. Available 0027642177342746. National Statistics Socio-economic Classificaition (NS-SEC) categories are fullyexplained in the ‘Key terms’ section of the Appendix at the end of this report. They arethe categories we use to understand social class origins, based on parental occupation.Part 2: Culture’s unequal workforce: How people of Working Class originhave been and continue to be excluded12
Social Class, Taste and Inequalities in the Creative IndustriesESTWARE ANSOFDCT,IOinR SERVICES68.4%KERRITEPUMALE WORFEMKEUMS, GALLUSEERIESI BR AdLan28.4%MinRSFEMALE WOROFEMALE WORKEVIDEO, R, TV,ADLMISinFITOGRAPHYHOdPanRSGender14.3%First, it is worth noting how much the occupational sectors differfrom each other. IT, which includes IT consultancy as well as gamedevelopment, has a good representation of those from minority ethnicbackgrounds, but has a very low number of women in its workforce.In contrast, the arts are not diverse in terms of ethnicity. The following sectors have particularly low numbers of Black and MinorityEthnic (BAME) workers: Museums, galleries and libraries (2.7%);Film, TV, video, radio and photography (4.2%); and Music, performing and visual arts (4.8%).Almost every occupational sector has an underrepresentation ofwomen in its workforce, with Publishing (52.9%) and Museums,galleries and libraries (64.8%) the only two sectors where womenare not under-represented compared to the workforce overall.The story of social class within this story is one of exclusion. Everysector apart from Crafts, which includes smiths, glass makers andceramicists, has an over-representation of those from upper middleclass 7 social origins, with those from working class origins makingup far less of the workforce.The situation in Publishing is especially grave, with over a third ofthe workers from the upper middle class social origins and onlyabout an eighth from working class origins.People from upper middle class origins are overrepresented in manycreative occupations, compared to those from working class origins.They are also overrepresented compared to the overall numbersof upper middle class origin and working class origin in the labour forceas a whole. It appears that creative jobs are thus highly exclusive.7. We are focused on just the higher managerial and professional for our analysis.Because of this we use the term ‘upper middle class social origins’. This groupcorresponds to those people who grew up in a household where the main incomeearner worked in a higher managerial or professional job, part of the ONS’ NS-SEC Icategory. We’ve used this term as it is clearer than repeating ‘professional andmanagerial’ or using NS-SEC I within the text.Part 2: Culture’s unequal workforce: How people of Working Class originhave been and continue to be excluded13
Social Class, Taste and Inequalities in the Creative IndustriesAgain, aside from Crafts, no creative occupation comes close tohaving a third of its workforce from working class 8 origins, which isthe average for the population as a whole.At the same time, every set of creative occupations aside fromCrafts has many more workers from the upper middle class origin,compared to just under a seventh of the population as a whole.Inequality and location – London and beyondThe national picture presents even more of an issue when we considerregional inequalities. A recent report by the Centre for EconomicPerformance 9 showed how disproportionately creative businessesin the UK are clustered in the South East of England, particularly inLondon. As we know, the cost of living is higher in London than inthe rest of the UK, which is important to remember in the context ofPart 3’s discussion of unpaid work. London also has a different, morediverse population.Our analysis finds important differences in the cultural and creative industry workforce in London, as compared to the rest of thecountry.There is some good news about London’s creative workforce. Ina paper published in American Behavioral Scientist in 2017, Oakleyand her co-authors found gender inequalities were not aspronounced in London (60.5 % of London’s creative workforce aremen, compared to just under 70% in other urban areas in the UK)and there is a better representation of ethnic minorities (17% ofLondon’s creative workforce are BAME individuals, compared to 6%of the creative workforce in the rest of the UK). 10However, data from the 2011 census indicates BAME individuals are39% of London’s working
The workforce inequalities are reinforced by the prevalence of unpaid labour. Panic! respondents overwhelmingly said they had worked for free. Alongside the inequalities in the workforce, this report paints a picture of a cultural sector which is exclusive in more subtle ways. The analysis shows the taste patterns of cultural workers are sub-