Transcription
Forex SystemsTypes of Forex Trading System1.2.3.4.5.6.7.8.9.Forex Profit System‘Scalp’ Trading the 1min Charts SystemMoving Average Intraday SystemThe Day Trade Forex System“Micro Trading” the 1 Minute Chart SystemTom Demark FX SystemThe Forex News Trading SystemThe CI SystemForex Intraday Pivots Trading System589101213142531Helpful Information for all Forex Trading SystemsBuilding blocks that I believe to be foundations to the Forex Profit System.Foundation #1: I highly recommend that you follow 1 or maybe 2 major currency pairs. It gets far too complicated to keep tabson all four. I also recommend that traders choose one of the majors because the spread is the best and they are the most liquid. Ipersonally follow only USD/CHF because it moves the most every day.Foundation #2: Follow and understand the daily Forex News and Analysis of the professional currency analysts. Even thoughthis system is based solely on technical analysis of charts, it is important to get a birds-eye view of the currency markets and thenews that affects the prices. It is also important that you know and understand what the key technical ‘support’ and ‘resistance’levels are in the currency pair that you want to trade. Support is a predicted level to buy (where currency pair should move up onthe charts), resistance is a predicted level to sell (where the currency pair should move down on the charts).Fortunately, all the best Forex news and analysis is offered free on the Internet. Here is what you should do first:*While you are reading the daily news and technical analysis, write down on a piece of paper what direction the analysts aresaying about the major currency pair you are following and the key support and resistance levels for the day.A. Go to forexnews.com and you will find 24hr news and analysis on the spot FX markets. The site will give you the big pictureof how the economic calendar and central banks affect the currency markets. A great resource.B. Then go to fxstreet.com and click on the ‘Top Forex Reports’. Here there is a wonderful listing of all the major dailycurrency analysis and forecasts with support and resistance and direction forecasts.C. Click on currencypro.com and go to ‘Today’s Market Research’ and there you will find more excellent analysis on the MajorCurrency pairs. Another great Forex Portal.D. www.moneytec.comE. Free Forex trading forum: www.forexdirectory.netF. Comprehensive listing of everything, related to the Forex Markets: www.mgforex.com/resource/glossary.aspFoundation #3: Only get into a trade when the FPS technical indicators say when. Always trade with stop losses!It is important when you are trading Forex, to be disciplined and to stick to a plan. Don’t just trade your ‘gut’ feeling. Use thetechnical indicators outlined and always enter in stop losses on every trade.Foundation #4: Practice makes perfect. As they say, there is no substitute for hard work and diligence. Practice this system on ademo account and pretend the virtual money is your own real money. Do not open a live trading account until you are profitabletrading on a demo account. Stick to the plan and you can be successful.Foundation #5: Trade with a DISCIPLINED Plan:1
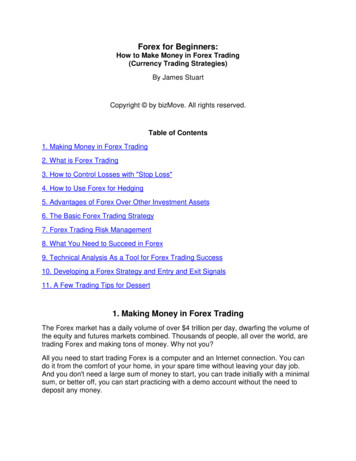
The problem with many traders is that they take shopping more seriously than trading. The average shopper would not spend 400 without serious research and examination of the product he is about to purchase, yet the average trader would make a tradethat could easily cost him 400 based on little more than a “feeling” or “hunch.” Be sure that you have a plan in place BEFOREyou start to trade. The plan must include stop and limit levels for the trade, as your analysis should encompass the expecteddownside as well as the expected upside.Foundation #6: Cut your losses early and Let your Profits Run:This simple concept is one of the most difficult to implement and is the cause of most traders demise. Most traders violate theirpredetermined plan and take their profits before reaching their profit target because they feel uncomfortable sitting on a profitableposition. These same people will easily sit on losing positions, allowing the market to move against them for hundreds of points inhopes that the market will come back. In addition, traders who have had their stops hit a few times only to see the market go backin their favor once they are out, are quick to remove stops from their trading on the belief that this will always be the case. Stopsare there to be hit, and to stop you from losing more then a predetermined amount! The mistaken belief is that every trade shouldbe profitable. If you can get 3 out of 6 trades to be profitable then you are doing well. How then do you make money with onlyhalf of your trades being winners? You simply allow your profits on the winners to run and make sure that your losses areminimal.Foundation #7: Do not marry your tradesThe reason trading with a plan is the #1 tip is because most objective analysis is done before the trade is executed. Once a traderis in a position he/she tends to analyze the market differently in the “hopes” that the market will move in a favorable directionrather than objectively looking at the changing factors that may have turned against your original analysis. This is especially trueof losses. Traders with a losing position tend to marry their position, which causes them to disregard the fact that all signs pointtowards continued losses.Foundation #8: Do not bet the farmDo not over trade. One of the most common mistakes that traders make is leveraging their account too high by trading muchlarger sizes than their account should prudently trade. Leverage is a double-edged sword. Just because one lot (100,000 units) ofcurrency only requires 1000 as a minimum margin deposit, it does not mean that a trader with 5000 in his account should beable to trade 5 lots. One lot is 100,000 and should be treated as a 100,000 investment and not the 1000 put up as margin. Mosttraders analyze the charts correctly and place sensible trades, yet they tend to over leverage themselves. As a consequence of this,they are often forced to exit a position at the wrong time. A good rule of thumb is to never use more than 10% of your account atany given time.Trading Strategy: TRENDSTrend is simply the overall direction prices are moving -- UP, DOWN, OR FLAT.The direction of the trend is absolutely essential to trading and analyzing the market. In the Foreign Exchange (FX) Market, it ispossible to profit from UP and Down movements, because of the buying and selling of one currency and against the othercurrency e.g. Buy US Dollar Sell Japanese Yen ex. Up Trend chart.2
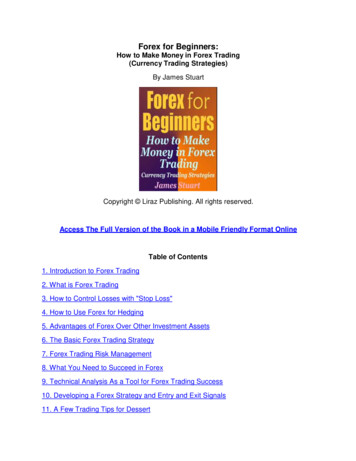
SUPPORTPrice supports are price areas where traders find that it is difficult for market prices to penetrate lower. Buying interest in thedollar is strong enough to overcome. Selling interest in the dollar keeping prices at a sustained level.RESISTANCEResistance is the opposite of support and represents a price level where Selling Interest overcomes Buying interest and advancingprices are turning back.3
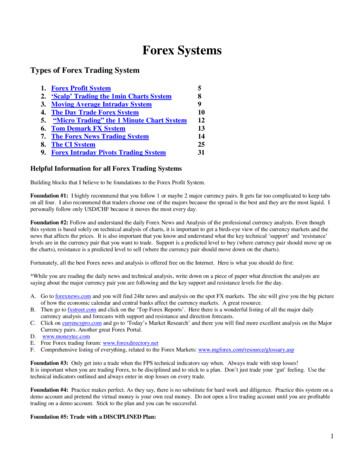
RETRACEMENTS50% Retracement.There are also 33% and 66% Retracements.4
5
Forex Profit SystemStep 1: Prepare your chartsThe Forex Profit System uses 2 technical indicators to show you when you should enter and exit a trade. These are called theParabolic SAR and the Exponential Moving Average 10, 25 and 50.A. Setup a 60 minute USD/CHF chart. This is my favorite currency pair to trade because it swings up and down the most. Youcan choose any major pair you like though.B. Choose Parabolic SAR as an indicator. Click on display when it shows you the .02 and .2 acceleration factor and constant.C. Choose Moving Averages, Exponential 10, 25 and 50.D. Click on Exponential, then enter 10 in the Period box, then OKE. You should have the Parabolic SAR and the three EMA’s 10, 25 and 50 in different colors on your charts.Step 2: When to Enter and Exit your TradesThis is what your chart should look like. These are the FPS indicators that I use to trade. The EMA 10 should be in pink, theEMA 25 should be in yellow, and the EMA 50 should be in blue. The Parabolic SAR is charted with dots above and below theline.When to ENTER a tradeThe FPS indicators tell you when to get into a trade when the EMA ten crosses the 25 and the 50. If the ten crosses the 25 and 50up from the bottom, you enter your trade ‘long’ and ‘buy. If the 10 cross the 25 and 50 down from the top you go ‘short’ and‘sell’. Make sure that when you get into your trade that the Parabolic SAR is on the bottom when you go long and on the topwhen you go short.In the example above, on October 15th, there was a great opportunity to go long on the USD/CHF pair, where I circled andlabeled enter. Notice how the EMA 10 crossed up the 25 and 50 and the Par SAR was on the bottom.*If you are trading the hourly charts like in the above example, make sure that the 15 min charts Parabolic SAR is going the sameway. Simply click on the arrow beside the 60 min and change it to 15 min and your studies will automatically adjust to the newtime frame. Never trade against the 15 min Parabolic SAR!When to EXIT a trade6
The best time to exit a trade is when the price crosses back down through all 3 EMA’s on the chart. Notice in the above examplethat the Dark Blue line—the actual price of USD/CHF on the 20th crossed back down all three indicators where I circled EXIT.If you held this position all week, you could have made a 275 pip profit.With 1 lot traded on a standard account this would have been approximately 1780.00 in profit. With 2 lots-- 3560! A miniaccount would have profited you 178 and 356 respectively.If you profited 275 pips with EUR/USD or GBP/USD you would have made approximately 10 per pip, which you would havemade 2750 with one lot and 5500 with 2 lots traded. Not bad for one week!Where to Set the Stop LossWhen you open a demo account you will find on the online trading platform that you will always be able to enter a stop orderlevel that will automatically stop out your trade at the level you set, or a limit order that will close your position at your desiredprofit level.Using the FPS means that you should always set your level just below the EMA 50. As your position moves in the rightdirection, you should move your stop accordingly. Then if your position moves against you, you would have locked in yourprofits by moving up your stop order. It is important that if the prices cross back over the 10, 25 and 50 that you close yourposition. Here is an example of how the FPS works on the 15 min charts:Using the FPS on the 15 min charts is more volatile, but it will give you more trades on an intra-day basis. On the example aboveyou could have sold the USD/CHF ‘short’ at 1.5060 and closed your position at 1.5000 for a 60 pip profit.One note of caution trading the 15 min charts: there are often times when the price will ‘whipsaw’ back and forth, up and downthrough the 10,25 and 50 moving averages. If this happens soon after you entered a trade, close your position and wait till themoving averages fan out and the Parabolic SAR signals strong.7
‘Scalp’ Trading the 1min Charts SystemScalp trading is when you use the 1 to 5 min charts to ‘scalp’ small profits. These trades usually only last a few minutes to anhour.You can use the FPS to scalp trade Forex on the 1 min charts. Here is how:Instead of using the 10, 25, 50 EMA’s like we did in the above examples, put on the 25, 50 and 100 EMA’s.Often it is best to scalp trade at the London Open (3:00AM EST) or the New York open (8:00 AM EST) because that is generallywhen the currency pairs will start to move more in one direction.When the actual price crosses all three indicators, you enter your trade, long or short. If the price crosses down through the 100EMA, enter short, if the price crosses up through the 100 EMA go long.Make sure that you book a 5-10 pip profit. That is a 50- 100 dollar profit on a regular account, and more if you bought morelots. Don’t try to hang on to you winning position too long, because the price can whipsaw back and you can lose. Take your 510 pip profit as soon as you can. Here is an example on the 1 min charts:Notice that at 10:30 EST you could have entered USD/JPY long (big circle) when the price crossed up through the 100 EMA andat 10:45 you could have closed your position (little circle) and made a 10 pip profit. Then again the price crossed back down the100 EMA at 11:30 EST. You could have sold the Yen short (big circle) and then ten minutes later made another 10 pip profit.(little circle)8
Moving Average Intraday SystemThe Setup:1.Open up your trading platform and open a chart.2.Set the instrument to the currency pair of your choice.3.Set the chart pattern to filled candle.4.Set the timeframe to 30 minutes5.Set up a moving average line in your indicators menu. -set period to 11 daysNow that you have your chart setup properly, go ahead and set up your normal indicators that you use for reassurance andentrance/exit, etc. I use an MACD, a volume indicator, and Bollinger bands, but everyone has their own theory on what worksand why, and everyone has a reason why your indicators don’t work when they seem to work just fine for you!Now before I explain what you are doing with this setup I would like you to set up the chart as I have indicated, and take a goodsolid look at the history of the data. Do you see any telltale signs yet, or have a clue as to what the point of the setup is yet? Ifyou do not, do not worry or feel inferior, as this has slipped past some of the best. I happen to be great with numbers and have astrong background in analysis, so I was able to pick up on this trend mostly by dumb luck but good fortune and a keen eye fordetail.Now that you have stared at your screen looking for it, I’ll explain myself. What you are looking for is the moving average line,or herein referred to as the MA, that you set up on your chart to cross through the price line. You are probably saying to yourself,“This happens like every hour or so, what gives?”. Well, it does happen fairly often, maybe not that drastically, but it does. Thekey point is where the MA crosses the price line. You don’t need to worry or care about it crossing the thin peaks of the high/lowlines on the candle, but you want to concentrate on it crossing through the middle of the wide, filled part of the candle, the openclose prices. And further yet, it must cross in around the middle of this center section. If it crosses at the top or bottom of thecandle centre area, than you can pretty much disregard the trade. It may be profitable, but not worth the risk. Stick with thecenter of the central region and you will be much safer.Now, when the MA indeed crosses the price line through the centre of the central wide part of the candle, a trade signal istriggered. You should try and wait at least one more candle before entering a position just to ensure that the cross wasn’t a blipon the radar and its not about to recant its previous move. The chart is set to the 30 minute timeframe, so generally wait 30minutes or so, unless the market suddenly takes a quick shift in that direction. Then you can open the position to catch the swing.Now to determine direction. If the MA moves from above the price line to below it, the trade is going to be long. And likewise,if the MA moves through the candle from below the price line, the trade will be short. This can be verified by checking yourindicators that you have set up to corroborate with your MA. To better clarify this direction idea, if after the cross the price isbelow the MA, the price is most likely dropping or SHORT. If the after the cross the price is above the MA, the price isconsidered to be rising and the trade is LONG.Another important factor to consider. While an MACD is a great too to determine market direction and activity, in this case ithelps to build on the strength of the trend that we are pointing out here. If the MA crosses the price line from above to below, sothat the trade we have forecasted is long, we can compare this with the MACD. If the MACD average lines are above the zeroline, then you can expect a large climb. If the trade was reported as short, and the average lines on the MACD screen were belowthe zero line, you could expect to a see a rather large drop. When I say large drop or gain, I am speaking of 75, 100, 150 pointgains. This is not to say that if, on a long trade for instance, the average lines on the MACD are BELOW the zero that you willNOT see a gain. It generally will provide a gain, but of 20, 30, or maybe even 50 points. Where you exit the trade is up to youand how much you can tolerate and are willing to risk. If you feel comfortable taking 30 points and are okay with yourself if itdoes end up going to 150 points above your buy price, then good for you. If you are a thrill-seeker and go for the 150, I wish youall the best of luck! You may or may not need it.That’s it! It’s just that simple! If you move back through the history of the chart and look at when and where the MA crosses theprice line, you can see for yourself that it seems to catch every big movement, and almost all of the smaller ones. This set can beused on the 60minute chart for mid-term trades and further yet on the daily chart for longer term setups.Make sure that you are using your regular technical indicators to monitor market activity and ensure the trade is on target. If youare looking to enter a short and your MACD says long, or the 30 minute chart is oversold, you are asking for trouble. You needchecks and balances with any system to eliminate as much of the margin of error as possible.9
The Day Trade Forex SystemThe Forex Profit System is specifically designed for use with the 1, 5 or 10 minute charts, with the goal of taking 5-20 pip profitsper trade—closing bad trades out using tight stops, or hedging any losing trades. The following steps will show you how to dothis.Set up your charts:One the left hand side of screen you will be able to choose your chart. Choose EUR/USD (or whatever currency pair you like) , 5min, line and the chart will appear on the right hand side. Maximize the chart to fill the right hand side. Now if you want tomake the price line darker, you can right click right on the price line and a properties box will appear. You can adjust thethickness of the line.Now we will add the Moving Averages to the chart. We will be using the Exponential Moving Average 10, the Bollinger BandExponential Set at 20, and the Exponential Moving Average 50.Click on Moving Average on the left hand side under Studies. Set your first MA to 10, close, exponential and you can make itred with line width 2 under the Color/Style Tab.Click on Moving Average again and add your MA 50, close, exponential and make this line blue with line width 2.Now we will add 3 more indicators below the chart to help us confirm the trend, and to help us identify exact entry and exit buyor sell signals. The following indicators give us insight into the momentum, direction and overbought/sold indicators. Usedalong with the Exponential Moving Averages, Parabolic SAR and Bollinger Bands—these indicators can be very helpful to theday trader.MACD Histogram.Read about how to trade the MACD Histogram here: http://www.incrediblecharts.com/technical/macd histogram.htmRelative Strength Index (RSI)Read about how to trade the RSI here: http://www.incrediblecharts.com/technical/relative strength index.htmSlow StochasticRead about how to trade the Slow Stochastic here: http://www.incrediblecharts.com/technical/slow stochastic.htmNow add these studies to your charts.Under Studies click on MACD Histogram and use the default settings (9,Exponential, 12, 26, Close, Exponential) and set theline width to 2. Your study will automatically open under your chart.Under Studies click on Relative Strength Index and set it to 14 and set the line width to 2. Your study will automatically openunder your chart.Under Studies click on Slow Stochastic and set it to (5,3,3, Exponential) and make the %K line blue with line width 2, and the%D line red with line width 2.Your chart, with all the studies on it should now look like this (example of USD/CAD 10 min chart): I clicked on the zoom inbutton a couple of times.**tip: If you are in a winning trade, you can move your stop to your entry level, so that if your trade moves against you, theplatform closes your position without any losses.**tip: You should be comfortable setting your stop Order at 15-20 pips. If you can’t handle a 15-20 pip loss, then you are needto trade smaller amounts. This will help you from over leveraging your trading account.Limit Order: Is a price you enter into an open position for the trading platform to automatically close your position at a profit.10
For example, you might set your limit order at a 15 pip profit. If the exchange rate never hits that level, then the Order doesn’tget filled.When to Enter and Exit Your Trades:We will be looking at 3 different ways to day trade the Forex Markets. In a trading session, you may look for 1 or more of theseapproaches. The 3 techniques are as follows:1.2.3.4.Trade the BreakoutTrade the TrendTrading Tops and BottomsMicro TradingBefore we look at these trading approaches, let’s answer a question that is often asked by new traders.When is the best time to trade?Because the Forex Market is open 24hrs a day, and traded on a global scale, the question to ask is, ‘when should I trade?’. Thegood news is that no matter what time zone or hemisphere you live in globally, there are always good opportunities to trade.The three major trading ‘sessions’ are as follows (all in Eastern Standard Time):1. New York open 8:00 AM to 4:00 PM2. Japanese/Australian open 7:00 PM to 3:00 AM3. London open 3:00 AM to 8:00 AM**Often, the best times to trade is at the beginning 3-5 hours of the above mentioned opening times, because the majorcurrency pairs tend to move the most in a particular direction.The first DayTradeForex.com trading technique we will look at is the easiest to recognize on the charts. We will call it ‘Tradethe Breakout’. You can use the 5, 10 or 15 minute charts for this method. The indicators on the 5 minute charts are the fastest.Practice until you feel comfortable with the time frame that suits you best.1. Trade the BreakoutThe principle behind trading the breakout is to enter a trade when the price ‘breaks out’ of a tight range, because often it tends tokeep moving in the same direction. We use our Bollinger Bands on our charts to spot this trading opportunity.The second DayTradeForex.com trading technique uses the same principles, but is less extreme. This trading method is besttraded on the 5 or 10 min charts, but can be applied to the 1 minute charts (See the Bonus “Micro Trading” strategy at the endof this trading course)2. Trade the TrendTrading the trend is just like trading the breakout, except in less volatile market conditions.Start with going to the 15minute chart of the currency pair of your choice and ask yourself this question: ‘Is the exchange rate line(brown) above or below the EMA 50 (blue)?**If the price line is currently below the EMA 50, and the EMA 10 and BB 20 are also below the EMA 50, then you will belooking at Selling opportunities in the trading session.If the price line is currently above the EMA 50, and the EMA 10 and BB 20 are above the EMA 50, then you will be looking atbuying opportunities in the trading session.Often, when you are ‘trading the trend’, you will notice that the price line will bounce off the EMA 10 or the middle BB line orthe EMA 50. These lines sometimes act as supports and resistances in a trading session. Therefore you can look to sell shortswhen the price line bounces down off the EMA 10, BB 20 or EMA 50, or buy longs when the price line bounces up off theEMA 10 BB 20 or EMA 50.When you trade the trend, it is important to trade with the Parabolic SAR, MACD, RSI and Slow Stochastic all signalingtogether.11
“Micro Trading” the 1 minute Charts SystemThis technique is for traders who like getting in and out of trades in a matter of minutes instead of hours.The type of chart set up that we use to trade the 1 minute charts is candlestick charts.SET UP YOUR CHARTS1.2.3.4.5.6.Open a new EUR/USD 1 minute candlestick chart.Add Bollinger Bands set at 18, Exponential. Change the color of the middle band to bright green.Add a moving average 3 Exponential, Close and change the color to black.Add the MACD Histogram Study (default settings)Add the Relative Strength Index Study set at 14.Zoom in or out to your liking.The Key to catching the “Micro Trends” on the 1 minute charts: Wait for the 3 EMA (black) to cross through the 18 Bollinger Bands Middle line (green).Wait for the Relative Strength Index and MACD Histogram to line up: Above 0 (MACD) and above 50 (RSI) for BUYsignal. Below 0 (MACD) and below 50 (RSI) for SELL signal.Remember to take small profits.Practice this strategy on your demo account.TRADE THE NEWSHere is a great example of how you can use the 1 minute charts to trade the economic news releases. To find out when the worldeconomic news releases are, simply go to http://www.forexnews.com and scroll down to the bottom of the website for the list ofthe current week news releases that impact the Forex markets. In the above example, the economic news release was scheduledfor8:30 AM EST. At 8:33 the price jumped up 20 pips. Using our 1 minute strategy along with the news, is an effective way ofscalping profits on the FX markets.**Tip: Remember to wait a minute or two after the announcement. Don't open a position before the scheduled time!**Tip: There are news releases all throughout the week during the different time zones and trading sessions. This techniqueworks well during overnight trading EST during the European and London sessions.ATTENTION:Using the 1 minute charts is fast moving. It might not be your style of trading. If you want to test out slower moving averagecombinations that whipsaw less often on the 1 minute charts, you can try these:1. 7 EMA, 18 Middle Bollinger Band2. 5 EMA, 20 Middle Bollinger Band3. 10 EMA, 20 Middle Bollinger Band12
Tom Demark FX systemIt is easy, simple but awesome in power. It works with all pairs (major and others) which means you have an entry most of thetime. I thought of calling it “The honey moon strategy”, but honey moon must end sooner or later. The magic of this strategynever fades. Originally called “The broken trend”, which sounds too technical. Now let us get to business and revel in the magic:Set up:1- EMA 9, EMA 30, Momentum indicator (draw a horizontal line at the 100 point).2- The hourly chart.3- Draw a Tom Demark trend line (connecting at least 3 swing high (or low). And should avoid steep anglesEntry:Enter buy when the 9 EMA crosses up the 30 EMA and the momentum line is above 100. And price breaks the down trend line.(The trend line is our invaluable filter so make sure you do a lot of practice with it). Entry should be placed at the opening of thenew hourly candle after the cross (to make sure the crossing and trend break are real and to keep away from whipsaw).Enter sell when the 9 EMA crosses down the 30 EMA and the momentum line is below 100. And price breaks the trend line, atthe new hourly candle after the EMA crossing.The EMA crossing can occur before or after the trend line break.Stop: 40 pips (it has to be respected).Target: from 40 pips up to 150 pips (depending on pair volatility and current situation).Move your stop in the direction of trade in steps of 10 pips. When market reaches 75% of its daily range tighten your stop. Whenyou see signs of reversal close order at market price. When you do not see any signs of reversal get rid of your limit and followthe price very closely with your trailing stop.Demistifying Tom DeMark Trend LinesMy simple interpretation of what the article says regarding TD Lines (Tom DeMark Lines) is as follows:TD PointsTo draw TD Lines one first must identify TD Points (Tom DeMark Points). In all cases, the bar to the right of the TD Point beingtested must be complete.A TD Low Point (Tom DeMark Low Point) is a low bar which has a bar with a higher low immediately before and after it.Therefore, when the bar before and/or after the low bar you are testing (to see if it qualifies as a TD Low Point) has the same low(double or triple bottom), the point does not qualify as a TD Low Point.A TD High Point (Tom DeMark High Point) is a high bar which has a bar with a lower high immediately before and after it.Therefore, when the bar before and/or after the high bar you are testing (to see if it qualifies as a TD High Point) has the samehigh (double or triple top), the point does not qualify as a TD High Point.TD LinesTo draw the current lower TD Line (called the TD Demand Line), connect the the next most recent TD Low Point that is lowerthan most recent TD Low Point, to the most recent TD Low Point, then extend the line to the right.The lower TD Line must slope upward. To draw the current upper TD Line (called the TD Supply Line), connect the next mostrecent TD High Point that is higher than most recent TD High Point, to the most recent TD High Point, then extend it to the right.The upper TD Line must slope downward.13
The Forex News Trading SystemStep 1: Go to ForexNews.com and scroll down to the bottom of the page to find out what Forex News releases are coming out.Then, click on Complete Calendar for Current Week link.Step 2: Now, look at the Calendar for News releases that affect the Forex market. The ones particularly to look for are thefollowing news announcements:1. Unemployment Reports (Non-Farm Payroll)2. Interest Rates3. Consumer Price Index (CPI)4. Inflation Reports5. Gross Domestic Product (GDP)6. M2 (Money Supply)7. Treasury Budget8. Producer Price Index (PPI)9. Retail Sales10. International TradeUnemployment Report
4. The Day Trade Forex System 10 5."Micro Trading" the 1 Minute Chart System 12 6.Tom Demark FX System 13 7.The Forex News Trading System 14 8.The CI System 25 9.Forex Intraday Pivots Trading System 31 Helpful Information for all Forex Trading Systems Building blocks that I believe to be foundations to the Forex Profit System.