Transcription
Decision Science Letters 4 (2015) 137–164Contents lists available at GrowingScienceDecision Science Lettershomepage: www.GrowingScience.com/dslComparing fuzzy AHP and fuzzy TOPSIS for evaluation of business intelligence vendorsAlireza Soloukdara* and Seyedeh Akram ParpanchibaDepartment of Industrial Management, Central Tehran Branch, Islamic Azad University, Tehran, IranDepartment of Information Technology Management, Electronic Branch, Islamic Azad University, Tehran, IranbCHRONICLEArticle history:Received July 10, 2014Accepted December 31, 2014Available onlineJanuary 3 2015Keywords:Business IntelligenceVendorsFuzzy TOPSISFuzzy AHPABSTRACTThe main objective of this study is to identify the most important criteria and indicators inselection of business intelligence vendors, and ranking the vendors of such tools using FuzzyAnalytical hierarchy Process (FAHP) and Fuzzy Technique for Order Preference by Similarityto Ideal Solution (FTOPSIS), to compare results of these two methods and to provideappropriate solutions for the sample company, namely National Iranian Oil Company (NIOC).Spearman's rank correlation test was used for comparing the methods and determining theircorrelation. A strong positive correlation was observed between the ranks of businessintelligence tools at the significance level of 0.05 in both methods. The results of the rankingby means of FAHP method show that IBM Company was the best one, followed by Oracle,SAS, QlikTech, SAP and Microsoft. However, based on the FTOPSIS method, Oracle was theleading company, followed by IBM, SAS and SAP and finally Microsoft. 2015 Growing Science Ltd. All rights reserved.1. IntroductionBusiness intelligence (BI) is an IT approach that assists many organizations in making accurate andtimely decisions, improving supervision process to provide better support for their own operationalactivities, strategic and tactical planning, and forecasting and analyzing market segments. Usingbusiness intelligence solutions, organizations are able to have better access to information and useanalytical methods for optimizing their business performance. Substantial increase in value of business,better decision-making and high returns on investment are only some of the arguments offered by itsvendors. Because of such promises, many organizations have invested in business intelligence. Suchan increase of value of business has been achieved in numerous business organizations, and businessintelligence has produced satisfactory results (Turban & Turban, 2007).The term “business intelligence” has become increasingly popular in the recent decade and givenvarious definitions has been offered recently for business intelligence applications, so that it can be saidthat its definition is an endless and non-conclusive debate and varies from author to author. The current* Corresponding author.E-mail address: a soloukdar@hotmail.com (A. Soloukdar) 2015 Growing Science Ltd. All rights reserved.doi: 10.5267/j.dsl.2015.1.002
138picture of business intelligence is a multifaceted concept, which may include processes, techniques andtools to support better and faster decision-making (Pirttimak & Hannula, 2003). In many cases, somefirms are using business intelligence tools or solutions, but under various names such as managementinformation systems (MIS), decision support systems (DSS), executive information systems (EIS), andso on (Pagels-Fick, 2000). Typically, the same organizations unintentionally call a small portion ofsome systems as “business intelligence systems”, such as customer relationship management (CRM)and knowledge management that focuse exclusively on clients and knowledge, while a businessintelligence system mainly deals with the data (Solberg Soilen, 2008).Users of business intelligence systems often tend to consider their commercial aspects rather than theirtechnological ones (Bräutigam et al., 2006). This person, business intelligence user, is often responsiblefor selecting or experiencing the process of selection of the best business intelligence system for his/herorganization to invest in. Selection of business intelligence systems is a sophisticated and timeconsuming process involving many resources and sectors. Making decision about which businessintelligence solution to be implemented and which business intelligence vendor to be used is verydifficult and requires a thorough investigation and comparison of the alternatives. A proper distinctionbetween offered arguments and the arguments provided by vendors cannot be easily made without afirm basis for reasoning. Previous studies have shown that measuring the direct benefits frominvestment in IT is a difficult task (Falk & Olve, 1996). Due to the problematic nature of appraisal ofthe investment in IT sector, it can be a remarkable, interesting and different approach in evaluating andassessment of the vendors of different business intelligence tools and systems. Nevertheless, currentorganizational systems are the foundations of each organization. Design and implementation ofbusiness intelligence has been considered as an umbrella concept for developing a decision supportenvironment for managing organizational systems. The increasing tendency towards using smart toolsin business systems has intensified the necessity for evaluating and ranking business intelligence tools.As far as we are aware, little research has been devoted concerning ranking and assessment of suchtools. The results of the current research can be significantly helpful for managers and decision makersin organizations for implementing business intelligence solutions. We expect that this research helpmanagers and organizations for proper understanding and selection of business intelligence tools andeffective implementation of business intelligence systems.The main objective of this study is to identify key indicators and criteria for selecting businessintelligence tools and vendors, evaluating and ranking business intelligence tools using fuzzy multicriteria decision-making methods, and finally recommending appropriate mechanisms for the samplecompany, namely National Iranian Oil Company.2. Materials and methods2.1. Research methodThe present study is an applied one in terms of objective, and descriptive in terms of method due to thefact that the relationship between variables and indicators (factors) have not been addressed while thestatus quo of National Iranian Oil Company has been focused on; meanwhile, since the data has beenobtained from the staff of the NIOC, it is a survey research.The detailed methodology includes a descriptive and inferential method for identification of theeffective criteria and sub-criteria, an applied method in terms of ranking and prioritizing the vendors,and a correlational research method for studying the relationship and the significant differencesbetween the two methods. Accordingly, the identification of effective criteria was conducted usingdescriptive statistics methods and then Student's t-test method was applied to test the hypotheses; then,fuzzy analytical hierarchy process (FAHP) and fuzzy TOPSIS (FTOPSIS) method were used inproportion to the research objectives, the significant difference and research hypotheses. Ultimately,Spearman's correlation test was used for studying the significance of the relationship between the twomethods.
139A. Soloukdar and S. A. Parpanchi / Decision Science Letters 4 (2015)2.1.1. Fuzzy analytic hierarchy process (FAHP)Zadeh (1965) proposed fuzzy set theory for the uncertainty introduced by ambiguity. The mostimportant feature of the fuzzy set theory is its capacity to show vague and uncertain data. Leung andCao (2000) argued that one of the reasons for low accuracy of traditional AHP method in obtaining theindividuals' opinions is because the person is asked to assign a definite value to the pairwisecomparisons based on his/her understanding of the phenomenon, meanwhile, an understanding of thephenomenon cannot be expressed as a crisp score and an interval of the numbers can better reflect theunderstanding of a person regarding the importance of a phenomenon compared with other phenomenathan crisp numbers do. Thus, fuzzy AHP can better simulate the decision-making process of humanmind than traditional AHP can. Laarhoven and Pedrcyz (1983) for the first time used fuzzy AHPmethod by using triangular fuzzy numbers. In 1996, Chang introduced a new approach for fuzzy AHPanalysis. So far, many researchers have used fuzzy AHP method in their researches, for example fordetermining the importance of customer requirements (Chan et al., 2012), for vendor selection (Shawet al., 2012), selection of ERP consultants (Vayvay et al., 2012), risk assessment (Wang et al., 2012),performance appraisal of business intelligence systems (Rezaie et al., 2011) and numerous other issues.The steps required for this research include:Step 1: Obtaining hierarchical structure by finding the criteria, sub-criteria and alternativesAs previously mentioned, the criteria and sub-criteria affecting the ranking of business intelligencetools, including three main criteria, 19 sub-criteria are 6 alternatives, have been obtained by review ofthe literature and obtaining the experts' opinions regarding this problem.Step 2: Collecting experts' opinions in form of fuzzy numbers and building fuzzy pairwise comparisonmatrices and aggregating the experts' opinionsAt this stage, to collect experts' opinions, tangible and common expressions in the fuzzy AHP pairwisecomparisons questionnaires have been used rather than deterministic values common in traditionalAHP. The scale used in this research is a scale of 1-9 triangular fuzzy numbers proposed byTesfamariam and Sadiq (2006) based on Saaty scale. After collecting the responses from experts in a9-point scale and in form of some verbal expressions, the responses should be transferred to a scalecapable of analyzing the responses, since it is impossible to perform mathematical operations onqualitative variable expressions. The variable expressions, thus, must be converted to fuzzy scales. Thetriangular fuzzy scales contribute to better decision-making process (Kaufmann, & Gupta, 1988). Table1 shows the fuzzy numbers corresponding to verbal scales derived from the study by Tesfamariam andSadiq (2006).Table 1Fuzzy numbers corresponding to verbal scalesVerbal variableEqual importanceIntermediate values between two adjacent judgmentsWeak importanceIntermediate values between two adjacent judgmentsStrong importanceIntermediate values between two adjacent judgmentsExtreme importanceIntermediate values between two adjacent judgmentsAbsolute more importanceFuzzy number1 2 3 Scale of the corresponding number(1, 1, 1)(1, 2, 3)(2, 3, 4)4 5 (3, 4, 5)6 7 8 (5, 6, 7)9 (8, 9, 9)(4, 5, 6)(6, 7, 8)(7, 8, 9)
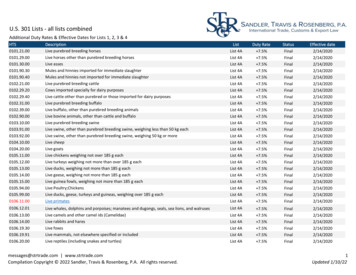
140The triangular fuzzy number is shown in Fig. 1 and Eq. (1). A triangular fuzzy number is shown as (l,m, u). Parameters l, m, and u represent the lowest possible value, the most probable value and thehighest possible value, respectively.a ijk ( lij , m ij , u ij ); l ij m ij u ij , lij , m ij , u ij [1 / 9, 9](1)U f ( x)x lm lU f ( x ) f (l) (m l) lf (u) u (u m) U f ( x ) u xu m xFig. 1. Triangular fuzzy numberEach triangular fuzzy number has a membership function according to what is stated in Eq. (2). Fuzzypairwise comparison matrix has been shown in Eq. (3). x l m l u -xU ( x) u -m 0 l x m(2)m x uOtherwisewhere: A k is the decision matrix of kth decision maker, and a ijk is the fuzzy assessment of kth decisionmaker regarding the pairwise comparison of i and j criteria, and a ij (lijk , mijk , uijk ) and alsoa ijk (1,1,1) : i j; a ijk 1: i ja ijk(3)A k [a ij ]k and B can be viewed asBasic algebraic operations for two positive triangular fuzzy numbers Asummarized in Table 2.Table 2 and B Basic algebraic operations for two positive triangular fuzzy numbers nA (l1, m1, u1);B (l2, m2, u2)EquationResultA BA-BA BA/B(l1 l2 , m1 m2 , u1 u2)(l1-u2 , m1-m2, u1-l2)(l1 l2 , m1 m2 , u1 u2)(l1/u2 , m1/m2, u1/l2)After building the matrix of pairwise comparisons for each expert, the experts' opinions should beaggregated. In this study, the arithmetic mean calculation method has been used for crisp opinions ofthe experts (according to Eq. (4)) to obtain the aggregation of opinions of individuals and preparing thefinal matrices of pairwise comparisons.
141A. Soloukdar and S. A. Parpanchi / Decision Science Letters 4 (2015) *a ij k a ij a ij . a**1*2*kij (4)(5)A ij [ a ij ]*Step 3: Calculating the consistency ratioStudying the consistency of fuzzy pairwise comparisons matrices is not as easy as that of crisp matrices.To solve this problem Csutora and Buckley (2001) showed in their paper that if A [a ij ] is the matrixof fuzzy pairwise comparisons with fuzzy triangular fuzzy numbers a ij (lij , mij , uij ) , the only thing that will bemust be determined is the consistency of A [ mij ] matrix. If A will be consistent, then Aconsistent too. However, when the decision matrix is not fully consistent, consistency index of matrixof pairwise comparisons will be determined after obtaining the intermediate values of the matrices andcalculation of the largest eigenvalue of m a x using Eq. (6):C.I max n / n 1 (6)If the concerning matrix will be fully consistent, then max n . The more the matrix will be close tothe full consistency; the closer will be the value of max to n , i.e. number of factors that are compared.The consistency index represents the consistency of decision-making matrix. As it can be seen, theindex is associated with n . For making the index independent of n , it should be divided by anotherindex called "random index" (R.I). The latter index is calculated from the mean consistency ratio of therandomly generated decision-making matrices. Table 3 shows RI values for different values. The newindex is called consistency ratio (CR) and is included in Eq. (7) (Saaty, 1990).(7)C .R C . IR .ITable 3Random index values for each dimension of decision matrix ( n )n345678910R 481.561.571.59Step 4: Calculation of crisp matrix of aggregated experts' opinions using CFCS methodAfter being ensured of the consistency of the opinions, matrix of pairwise comparisons must beconverted from fuzzy scale to crisp scale, which is called defuzzification of fuzzy pairwise comparisonmatrix. Different methods have been proposed for defuzzification of fuzzy pairwise comparison matrix,here the approach proposed by Opricovic and Tzeng (2003) will be used for defuzzification of fuzzyanswers of the experts using Eqs. (8-15). If A i j k (lijk , mijk , uijk ) will be the pairwise comparison matrixof the kth expert regarding the pairwise comparison between i and j criteria, then the steps of CFCSmethod are as follows:1: Calculating the normalized matrixxlijk (lijk min lijk ) maxminxmijk (mijk min lijk ) maxmin(8)(9)
142(10)xuijk (uijk min lijk ) maxminWhere,kk maxmin max uij min lij(11)2: Calculating the normal left (ls) and right (us) valuesxlsijk xmijk (1 xmijk xlijk )(12)(13)xusijk xuijk (1 xuijk xmijk )3: Calculating the crisp normalized valuexijk [ xlsijk (1 xlsijk ) xusijk ] [1 xlsijk xusijk ](14)4: Calculating the crisp valuesa*ijk min lijk xijk maxmin(15)Step 5: Calculating the final weightsTo obtain the weights, calculating the geometric mean of row vector of crisp decision matrix introducedby Saaty (1980) has been used (shown in Eq. (16)).n(16)*1/ nwi ( a ij )j 1nni 1j 1 ( a *ij )1/ ni , j 1, 2, ., n3. Fuzzy TOPSIS Method (FTOPSIS)TOPSIS method was introduced for the first time by Hwang and Yoon (1981). In summary, in thisapproach the best choice is the closest one to the positive ideal point and yet farthest one from thenegative ideal one. The data and inputs of the method are similar to those of the previously explainedfuzzy AHP method, i.e. experts' opinions. In this method, experts determine the relative importance ofthe criteria or sub-criteria and then assess the performance of each alternative against each criterion.However, human's thought and expression of evaluations are accompanied with uncertainty, and thisuncertainty has an impact on decision-making. To overcome this issue, fuzzy decision-making methodsare used. In this case, the decision matrix elements, or the importance of criteria against alternativesand the importance of criteria (in our problem) are expressed in a fuzzy manner by means of fuzzynumber. Fuzzy AHP methodology, like fuzzy TOPSIS method has been used in many cases by variousresearchers such as Krohling and Campanharo (2011) on the issue of oil spill incidents at sea, Torlaket al. (2011) for competitiveness of businesses in Turkey, and Liao and Kao (2011) for vendor selectionproblem, and Kelemenis et al. (2011), for selecting support managers. Fuzzy and verbal scales used tomeasure the importance of the criteria (here sub-criteria) and performance of alternatives, i.e. businessintelligence software providers, against each criterion are given in Tables 4 and 5 (Wang & Elhag,2006).Table 4Verbal scales for evaluation of importance of criteriaVerbal importanceVery HighHighMedium HighMediumLow MediumVeryVery LowCodeVHHMHMMLLVLCorresponding triangularfuzzy numbers0.9, 1.0, 1.00.7, 0.9, 1.00.5, 0.7, 0.90.3, 0.5, 0.70.1, 0.3, 0.50, 0.1, 0.30, 0, 0.1
143A. Soloukdar and S. A. Parpanchi / Decision Science Letters 4 (2015)Table 5Verbal scales for alternative performances against each sub-criterionVerbal importanceCodeVery goodVGGoodGMedium goodMGFairFMedium poorMPPoorPVery PoorVPCorresponding triangular fuzzy numbers9, 10, 107, 9, 105, 7, 93, 5, 71, 3, 50, 1, 30, 0, 1Necessary steps for implementation of fuzzy TOPSIS method are as follows (Chen et al., 2006):Step 1:Suppose that we have m alternatives, n criteria and k decision makers, then, fuzzy multi-criteriadecision-making problem can be expressed as the following matrix:X1A1 x 11 D Ai x i1 Am x m 1 X x 1 j x ij x mjj Xnx 1 n x in x m n i 1, 2, ., m ; j 1,2,.,n(17)where, A1, A2, , An are the alternatives that should be selected or ranked; C1, C2, , Cn are theevaluation criteria or characteristics; x ij is the desirability of alternative Ai against criterion Cjdetermined by the kth expert. In order to aggregate fuzzy performance scores of x ij for k experts,arithmetic mean has been used according to Eq. (18):(18)1x ij ( x 1ij x ij2 . x ijk ),kwhere, x ijk is the desirability of alternative against Ai against criterion Cj determined by the kth expertand x ijk ( aijk , bijk , cijk ) . Moreover, the mean of fuzzy importance of each sub-criterion will be determinedin this step. The weights are shown as triangular fuzzy numbers and w j ( l , m , u ) and eachcomponent of this number is the corresponding mean of (the first, second or third) opinions of theexperts.Step 2: Normalizing fuzzy decision matrix and calculating the weighted normalized fuzzy decisionmatrixIn this step, given that the raw data obtained from the removal of heterogeneous units and variousdecision-making scales should be normalized in multi-criteria decision-making problems, the linearnormalization is used for this purpose. If R is the normalized fuzzy decision matrix, then we have:R [ r ij ]m n ,i 1,2,.,m; j 1,2,.,n aij bij cij r ij , , c c c jj jc j max cij j B(19)(20)i a a a rij j , j , j a j min aij j C c b a iijij ij(21)where, B and C are the set of positive and negative criteria respectively. Considering different weights foreach sub-criterion, the weighted normalized decision matrix is calculated by multiplying the importanceweights of the criteria by normalized fuzzy decision matrix. Weighted normalized decision matrix V isdefined as follows, where w j is the weight of the jth criterion:
144V [v ij ]m n ,(22)i 1,2,.,m; j 1,2,.,nv ij r ij w jStep 3: Determining the positive and negative ideal solutionsThe positive and negative ideal solutions are defined as follows:A (v 1 , v 2 ,., v n )A (v 1 , v 2 ,., v n )where: (23)' max v ij j J , min v ij j J i 1, 2, , m A v 1 ,v 2 , ,v j , ,v nii min v ij j J , max v ij j J ' i 1, 2, , m A v 1 ,v 2 , ,v j , ,v nii (24) (25)J j 1, 2, , n :J related to negative criteriaJ ' j 1, 2, , n : J related the positive criteriaStep 4: Calculating the distance of each alternative from the positive and negative ideal pointsThe distance between each alternative and the fuzzy positive ideal solution and fuzzy negative idealsolution are calculated as follows:n(26)di d (v ij , v j ), i 1,2,.,m; j 1,2,.,nj 1ndi d (v ij , v j ),i 1,2,.,m; j 1,2,.,nj 1where, d (v a , v b ) represents a distance between the two fuzzy numbers, and d i represents the distanceof alternative i from positive ideal point, while d i represents distance of alternative i from negativeideal solution. If we have two triangular fuzzy numbers,,, و distance between two numbers is calculated as follows:1 (m1 n1 )2 (m2 n2 ) 2 (m3 n3 ) 2 d M ,N 3 Step 5: Calculating the closeness coefficient and ranking the alternatives,,then the fuzzy(27)By determining the closeness coefficient, the final step will be taken for ranking all alternatives anddecision makers can choose the best alternative among several alternatives. Closeness coefficient ofeach alternative is calculated as follows:(28)d CCi i , i 1,2,.,mdi diIf CC i index will be close to one, the alternative will be close to the positive ideal point and far fromthe negative ideal point. Thus, the larger the value of CC i will be, the better performance Ai will have.2.2 Data Collection MethodsFor understanding influencing factors and parameters on business intelligence tools and determiningsuch tools, data collection was conducted using desk studies, while gathering the data concerning thestatistical population was conducted using interviews and questionnaires. The questionnaires wereprepared for identifying the factors and indicators of business intelligence tools (at the second level)and preparing the decision matrices (to be used in TOPSIS method), while the data collection was
A. Soloukdar and S. A. Parpanchi / Decision Science Letters 4 (2015)145conducted for AHP.2.3 Statistical Population, Sampling and Sample SizeThe statistical population includes the experts of the National Iranian Oil Company in the field ofinformation technology. Considering the number of subjects included in the statistical population and inorder to achieve more accurate results, census sampling technique was used. The data regarding thefactors and parameters influencing business intelligence tools and selection of business intelligence toolswas collected by review of literature. Meanwhile gathering the data concerning the statistical populationwas conducted using interviews and questionnaires. Census sampling method was used for identifyingthe criteria and indicators using the opinions of 30 IT experts in NIOC, while with the help of AHP andfuzzy TOPSIS questionnaires and the sampling technique, the opinions of seven business intelligenceexperts were obtained and used for evaluating and ranking the criteria, sub-criteria and the alternatives.2.4 Data Analysis Methods and ToolsIn this study, data analysis was conducted using arithmetic mean (descriptive statistics) in order fordetermining and identifying the influencing parameters and factors; fuzzy AHP and fuzzy TOPSISmethods were used for identifying and ranking business intelligence tools, and Spearman's rankcorrelation test was used for comparing the methods regarding the test of the hypotheses. Theapplications used in this analysis include SPSS, Excel, Expert Choice and Matlab. The used dataanalysis methods can be noted as follows:1. Student's T-test as an inferential test for determining and identifying the effective factors andindicators.2. Fuzzy AHP method for evaluating and prioritizing indicators related to the vendors of intelligencetools and solutions.3. Fuzzy TOPSIS method for ranking the vendors of business intelligence tools and solutions based onthe experts' opinions in NIOC.4. Spearman's rank correlation test for evaluating and comparing the significance of the relationshipbetween the two methods, i.e. fuzzy AHP and fuzzy TOPSIS methods.2.5 Scope of ResearchThematic scope of this study is evaluating and ranking the criteria, sub-criteria and alternatives relatedto business intelligence tools and solutions. The spatial scope of this study is the National Iranian OilCompany as the largest producer of oil and petroleum products in Iran. The time scope of this studycovers a period of 6 months from March 2012 to September 2012.2.6 Limitations of ResearchThe main limitation of this study can be regarded as the complexity of obtaining the opinions of theexperts. Another point is that theoretically, it is possible to consider even more criteria, sub-criteria orbusiness intelligence tools in addition to what were included in the study. However, since the number/2, and by increasingof pairwise comparisons in AHP method for n factors is determined bythe number of factors or solutions, the number of pairwise comparisons will increase drastically, theseleads to a significant increase in the number of the items of the questionnaire and the experts may refuseto answer them. Insufficient number of business intelligence experts in the organization and lack oftheir knowledge regarding the methods and concepts used in this paper made us to provide explanationsregarding the questionnaires and to conduct interviews, resulting in more time spent on the collectionof the data.
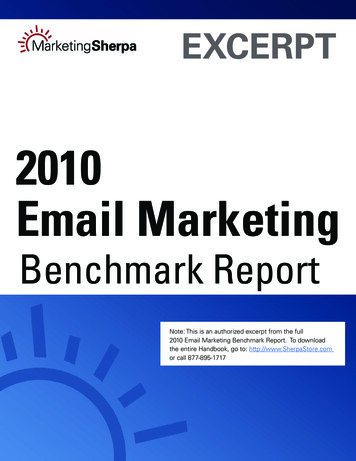
1462.7 Implementation Stages of ResearchThis research was conducted in the following stages and Fig. 1 shows the executive model of theresearch:Phase I: Identification of effective criteria and sub-criteria Identification of important criteria using desk study Collecting the experts' opinions using a Likert scale questionnaire and testing the hypotheses usingStudent's t-test method and determining and selecting the effective criteria, sub-criteria andalternativesPhase II: Implementation of fuzzy AHP method for appraisal and ranking of business intelligence toolsand solutions Prepare the hierarchical levels of criteria, sub-criteria and alternatives and coding them Create hierarchical tree model after identifying the criteria and sub-criteria and effective tools in thephase II Create a fuzzy AHP questionnaire for verbal scales Collect the experts' opinions in form of fuzzy numbers and preparing fuzzy pairwise comparisonmatrices and aggregating the experts' opinions (7 people) Calculate the consistency ratio of pairwise comparisons Calculate crisp matrix of aggregated experts' opinions using CFCS method (defuzzification) Calculate the final weightsPhase III: Implement of fuzzy TOPSIS method for evaluating and ranking business intelligence toolsand solutions Prepare fuzzy TOPSIS questionnaire Obtain the opinions of the individuals regarding the importance of the criteria and the performanceof each alternative against each criterion and preparing fuzzy decision matrix and matrix of relativeimportance of criteria for verbal scales Convert the judgments of experts into corresponding fuzzy numbers and aggregating their opinionsusing arithmetic mean Normalize fuzzy decision matrix and calculating the weighted normalized fuzzy decision matrix Determine positive and negative ideal points Calculate the distance of each alternative from positive and negative ideal points Calculate closeness coefficients and prioritizing the alternativesPhase IV: Comparison of the two methods, i.e. fuzzy AHP and TOPSIS, and hypothesis testing usingSpearman's rank correlation test Calculate the differences of the ranks andvalues.3. Results3.1 The Results Regarding the Effective Criteria and Sub-CriteriaIn this section, based on the implementation stages of the research and given the research questions andresearch hypotheses for determining effective criteria and sub-criteria, the hypotheses of such criteriaand sub-criteria were tested individually. The following example is only the first hypothesis and thesame procedure applies to other criteria and sub-criteria. The initial data was collected using Likertscale, then it was studied, and analyzed using one-sample Student's t-test.Hypothesis 1) “Technology” as a major criterion has a significant positive effect on the choice ofbusiness intelligence tools and solutions. The statistical hypotheses include: H 0 : 3 Effect of "technology" on the choice of business intelligence tools and solutions is not high. Effect of "technology" on the choice of business intelligence tools and solutions is high. H1 : 3
A. Soloukdar and S. A. Parpanchi / Decision Science Letters 4 (2015)1147Determining the criteria and a sub-criteria of the problem by review of literatureand evaluating the significance of their importance using Student's t-test method2Fuzzy AHPStep 1: Obtaining the hierarchical structure by finding the criteria, subcriteria and alternativesStep 2: Collecting experts' opinions in the form of fuzzy numbers and buildingfuzzy pairwise comparison matrices and aggregating the experts' opinionsStep 3: Calculating the consistency ratio (CR)NoCR 0.1?YesStep 4: Calculating the crisp matrix of aggregated experts' opinions usingCFCS methodStep 5: Calculating the final weights3Fuzzy TOPSISStep 1: Building fuzzy decision matrix and matrix of relative importance ofcriteria regarding verbal scalesStep 2: Normalizing fuzzy decision matrix and calcu
firms are using business intelligence tools or solutions, but under various names such as management information systems (MIS), decision support systems (DSS), executive information systems (EIS), and . Collecting experts' opinions in form of fuzzy numbers and building fuzzy pairwise comparison matrices and aggregating the experts' opinions .