Transcription
Robert Catterall, IBMrfcatter@us.ibm.comKey Metrics for DB2 for z/OS Subsystem andApplication Performance Monitoring (Part 1)New England DB2 Users GroupSeptember 17, 2015Information Management 2015 IBM Corporation
Information ManagementThe genesis of this presentation Mainframe DB2 people have an abundance of data fieldsthey can look at for performance monitoring purposes–In DB2 monitor displays and reports–In z/OS monitor displays and reports–In various DB2 -DISPLAY commands–In CICS (DSNC) DISPLAY STATISTICS command output With all of these numbers staring back at you, you could:–Freeze up (sometimes referred to as “analysis paralysis”)–Try to analyze everything, all the time (maybe OK if you have a LOT offree time on your hands)–Focus too much on “FYI” and “level 2” numbers (the latter being fieldsthat you should check if a “level 1” number is not what it should be),and overlook what’s really important2 20152013 IBM Corporation
Information ManagementMy goal Through this presentation, I want to help you to be moreeffective and efficient in monitoring DB2 subsystem andapplication performance How?–By spotlighting the relatively small set of metrics that are yourmost important indicators of good (or not) performance3 20152013 IBM Corporation
Information ManagementAgenda Part 1–DB2 monitor-generated reports versus online displays–Application performance: DB2 monitor accounting reports (anddisplays) Part 2–Subsystem performance: DB2 monitor statistics reports (and displays)–The best bits in DB2 and CICS DISPLAY command output–Important DB2-related stuff in z/OS monitor reports and displays4 20152013 IBM Corporation
Information ManagementDB2 monitor-generated reportsversus online displays5 20152013 IBM Corporation
Information ManagementOngoing tuning versus putting out fires Many sites use their DB2 for z/OS monitorexclusively in online mode–Online monitoring is valuable, especially when you needto see what’s happening right now in order to diagnose aperformance problem–For in-depth, ongoing analysis of the performance “health”of a DB2 for z/OS subsystem and associated applications,I prefer to use DB2 monitor-generated reports If you’ve only used your DB2 monitor in online mode, lookinto the product’s batch reporting capabilities In this presentation, I’ll show a lot of information excerptedfrom DB2 monitor-generated reports – you should be able tofind most of this information in online displays, as well6 20152013 IBM Corporation
Information ManagementGenerating reports with your DB2 monitor Usually involves executing a batch job that includes a DDstatement pointing to a data set containing DB2 trace records(these records are usually written to SMF)–Batch job has a control statement in SYSIN, in which you specifythings such as: 7“From” and “to” dates/timesReport type (e.g., ACCOUNTING LONG)Filtering criteria (e.g., include or exclude a DB2 plan name)Report data organization options (e.g., order by connection type) 20152013 IBM Corporation
Information ManagementThe two most useful DB2 monitor reports Accounting long (aka “accounting detail”), with:–“From” and “to” times encompassing either a busy 1- or 2-hour timeperiod, or a 24-hour time period–Data ordered by (or “grouped by”) connection type Gives you a detailed report for each DB2 connection type: CICS, IMS,DRDA, TSO, call attach, utility, etc. If you need more granularity, can get data at correlation-name level (e.g.,CICS transaction ID or batch job name), primary auth ID level, etc. Statistics long (aka “statistics detail”), with:–Same “from” and “to” times as accounting reports (see above) In addition to providing very useful information, these tworeports are pretty inexpensive (records on which the reportsare based are generated by low-overhead DB2 traces)8 20152013 IBM Corporation
Information ManagementApplication performance: DB2monitor accounting reports (anddisplays)9 20152013 IBM Corporation
Information ManagementUnderstanding your DB2 application workload What’s the biggest component of your DB2 workload?–Seems simple enough, but I’ve found that plenty of DB2 people cannotreadily answer this question as it pertains to their site “Biggest” – biggest in terms of aggregate class 2 CPU time–Information comes from DB2 accounting trace class 2–Also known as “in-DB2” CPU time–Indicates the CPU cost of SQL statement execution “Component” – connection type (e.g., CICS, batch, DRDA, etc.)10 20152013 IBM Corporation
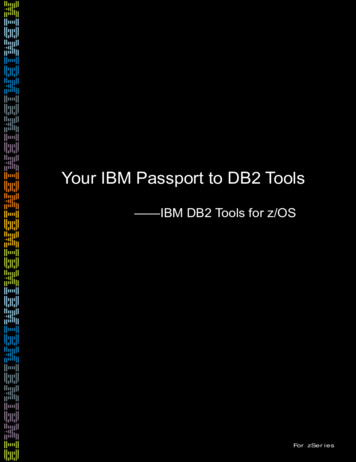
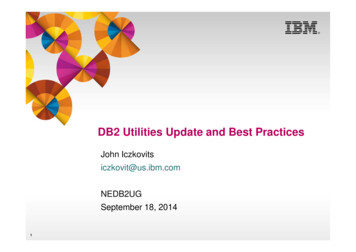
Information ManagementAnswering the “biggest component” question Accounting long report, with data ordered by connection type For each connection type, perform a simple calculation(referring to sample report output on following slide):–(average class 2 CPU time) X (number of occurrences)–“Number of occurrences” number of trace records Usually one per transaction for online, one per job for batch DB2 can “roll up” accounting records for DRDA transactions (ACCUMACC– default is 10 – and ACCUMUID parameters in ZPARM)–Reports generated by different monitors can look a little different Samples in this presentation are from reports generated by IBM’s TivoliOMEGAMON XE for DB2 Performance Expert on z/OS Fields in reports can usually be found in online monitor displays–Note: I’m leaving out some report lines and columns because puttingall on a slide would require a too-small font size11 20152013 IBM Corporation
Information ManagementSample report output (2-hour time period)CONNTYPE: DRDAAVERAGE----------CP CPU TIMEDB2 (CL.2)---------0.003614SE CPU RRENCES : 3087344Don’t forget this! (SE “specialty engine,” which usually means zIIP)(avg CL 2 CPU) X (# of occurrences) 0.006962 X 3,087,344 21,494 secondsIn a DB2 data sharing environment, do this for each member of the group toget TOTAL DRDA SQL cost, TOTAL CICS-DB2 SQL cost, etc.12 20152013 IBM Corporation
Information ManagementThe DRDA part of the overall DB2 workload Often, DRDA-related activity is the fastest-growing componentof an organization’s DB2 for z/OS workload At some sites, DRDA-related activity is the largest componentof the DB2 for z/OS workload – bigger than CICS-DB2, biggerthan batch-DB2–Again, “largest” refers to total class 2 CPU time I have found that people – even mainframe DB2 people – areoften unaware of this–Not uncommon for senior IT managers to think of the mainframe as justthe server where the “legacy” applications run–In fact, the mainframe DB2 platform is evolving to become a “supersized” (and super-available, super-secure) data server for multi-tier apps13 20152013 IBM Corporation
Information ManagementAnother important workload characteristic Is the DB2 workload CPU-constrained? A good place to check: “not accounted for” time in the DB2monitor Accounting Long report–What it is: in-DB2 (i.e., class 2) elapsed time that is not CPU time, notsuspension time (the latter being class 3, or “waiting for” time)–Basically DB2 saying, “this was time, related to SQL statementexecution, that I can’t account for”–In my experience, usually associated with DB2 wait-for-dispatch time In other words, DB2 (vs. application) tasks are not being readily dispatched–DB2 address spaces usually have a high priority in the system, so ifnot-accounted-for time is relatively high for a transactional workload, itcould be that you’ve hit a processing capacity wall14 20152013 IBM Corporation
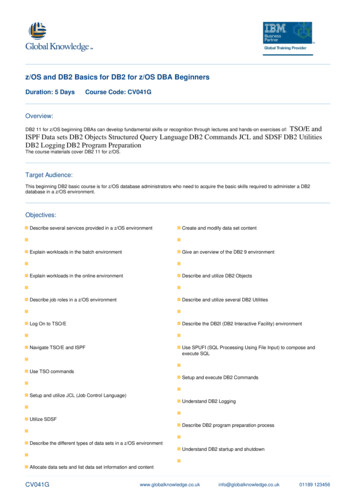
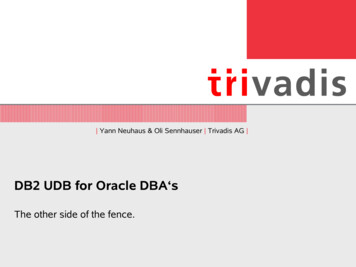
Information ManagementDB2 not-accounted-for time (1)CONNTYPE: CICSCLASS 2 TIME ------CPU 30%SECPU NOTACC 5%SUSP 65% I get concerned if not-accounted-for time is greater than 10%for a high-priority transactional workload such as CICS-DB2(or, often, DRDA)–Not so concerned if this time exceeds 10% for batch DB2 workload –that’s not uncommon15 20152013 IBM Corporation
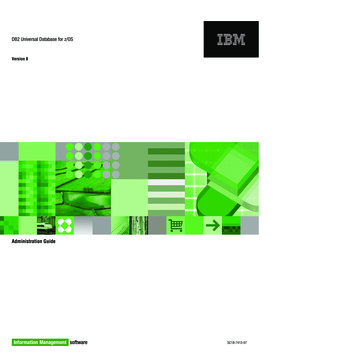
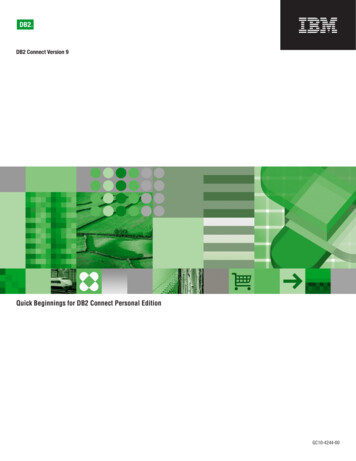
Information ManagementDB2 not-accounted-for time (2)CONNTYPE: CICSAVERAGE-----------ELAPSED TIMEDB2 (CL.2)---------0.085225 ACP CPU TIME0.025313 BSE CPU TIME0.000000 CSUSPEND TIME0.055708 DNOT ACCOUNT.0.004204 If your monitor report doesnot have the “bar chart”elapsed time breakdownshown on the precedingslide, it will likely have a“not accounted for” field inthe “class 2” time column(in red at left) If “not accounted for” timeis not provided, calculate ityourself: A – (B C D)16 20152013 IBM Corporation
Information ManagementWhat if not-accounted-for time is high? Add capacity (could just be an LPAR configuration change) If that’s not feasible –May see what you can do to reduce CPU consumption of the DB2workload (more on that to come in this presentation)–Ensure that dispatching priorities are optimized for throughput in aCPU-constrained environment IRLM should be in the SYSSTC service class (very high priority) DB2 MSTR, DBM1, DIST, and stored procedure address spaces should beassigned to a high-importance service class (my opinion: somewhat higherpriority than CICS AORs) If system is really busy, you may need to go with PRIORITY(LOW) for CICS-DB2transaction TCBs (relative to priority of CICS AOR main task – default is HIGH) Classify DRDA transactions (in WLM policy) so they won’t run as“discretionary” work17 20152013 IBM Corporation
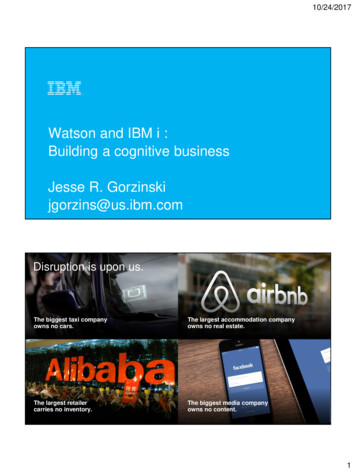
Information ManagementRelated: are you ------CP CPU TIME0.012106SECP CPU0.000166SE CPU TIME0.018054AB This field shows you how muchzIIP-eligible work actually ranon a general-purpose engine That can happen when a zIIPengine is not available at thetime zIIP-eligible work isready for dispatch Referring to the report snippet above, you want the percentageof zIIP-eligible CPU time consumed on a general-purposeengine to be low – calculation is A / (A B)–In this case, the figure is less than 1% – that’s good–If the figure is 5%, I’d be concerned about contention for zIIP MIPs That kind of “zIIP-eligible, but not zIIP-executed” figure might be seen on asystem on which zIIP engine utilization is around 60% – or even less if asystem has only one zIIP engine18 20152013 IBM Corporation
Information ManagementHow is your DB2 I/O performance?Sample report outputCONNTYPE: DB2CALLCLASS 3 SUSPENSIONS------------------SYNCHRON. I/OAAVERAGE TIME-----------6.520800BAV.EVENT-------6133.32 Average service time for synchronous I/Os A / B Times are getting to be really low (in this case, 1.06 ms)–Has much to do with advances in I/O hardware and software–Lowest I’ve seen: 0.25 ms per synch read (at site using solid state drives) A time 5 ms represents opportunity for improvement A time 10 ms could indicate a performance problem19 20152013 IBM Corporation
Information ManagementHow CPU-efficient are your DB2 applications? Usually, you’re aiming to reduce A (referring to sample reportbelow), which is in-DB2 CPU time (CPU cost of SQLstatement execution)– Note that, sometimes, reducing A can be accomplished by increasingB (recall that “SE” is short for “specialty engine,” which usually is a zIIPengine – more on this to come)Sample accounting report output20AVERAGE----------CP CPU TIMEDB2 (CL.2)---------28.311773 ASE CPU TIME0.000000 B 20152013 IBM Corporation
Information ManagementAverage CPU time – per what and for what? Depends on scope of information in accounting report(specified by you)If DRDA accounting records rolled up, number of Could be average:commits is good indicator of number of transactions–Per transaction/job for connection type (e.g., all DRDA, all call attach)–Per transaction for a CICS AOR (an example of a connection ID)–For a given batch job or CICS tran (examples of correlation names)–Per transaction or job for a given DB2 authorization ID Larger scope can be appropriate when planning change of the“rising tide lifts all boats” variety (e.g., page-fixed buffer pool)–Largest scope: DB2 subsystem ID21AVERAGE----------CP CPU TIMEDB2 (CL.2)---------28.311773SE CPU TIME0.000000 20152013 IBM Corporation
Information ManagementInformation at the program (package) levelPackage nameSample report outputM123456B----------CP CPU TIMESE CPU TIMETIMES-----------13:35.566002 Very useful if a batch job ortransaction involves execution ofmultiple programs0.000000 Requires data from DB2accounting trace classes 7 and 8 May be LOTS of packages in thereport – where do you start?– Your monitor may show in theAccounting Long report the topprograms by elapsed time (class 7)– High elapsed time often points tohigh CPU time22PROGRAM NAMECLASS 7 CONSUMERSD789123Y 3%M123092G 15%I273459Z 1% 20152013 IBM Corporation
Information ManagementApplication efficiency: thread reuse(data in this report sample happens to be for a CICS-DB2 workload)Thread reused, auth ID changedThread not reusedThread reused, no auth ID changeNORMAL TERM.------------NEW USERDEALLOCATIONRESIGNONAVERAGE-------0.790.010.20 Sample above shows a thread reuse rate of 99% -- very good Boost CICS-DB2 thread reuse via protected entry threads forhigh-use trans (PROTECTNUM in DB2ENTRY RDO resource)–Protected thread will stick around for 45 seconds (default) aftertransaction completes – can be reused by another transactionassociated with same DB2ENTRY if plan name doesn’t change Boost IMS-DB2 thread reuse via pseudo-WFI regions23 20152013 IBM Corporation
Information ManagementMaximizing performance benefit of thread reuse RELEASE(DEALLOCATE) package bind option–Table space locks, package sections allocated to thread retained untilthread deallocation, vs. being released at commit–If package is executed repeatedly via the same thread, these resourceswon’t have to be repeatedly reacquired – that improves CPU efficiency Can reduce CPU consumption by several percentage points–Biggest impact for transactions that have low in-DB2 time–Can also be beneficial for batch jobs that issue lots of commits Considerations:–Not good bind option for programs that get exclusive table space locks–Can impact scheduling of DDL, utilities, bind/rebind operations DB2 11 NFM: use of a RELEASE(DEALLOCATE) package executed via alocal persistent thread will be drained, and RELEASE will be temporarilychanged to COMMIT, so as not to block utility or DDL or bind/rebind operation24 20152013 IBM Corporation
Information ManagementRELEASE(DEALLOCATE) for DDF threads DB2 10 introduced high-performance DBATs–Instantiated when RELEASE(DEALLOCATE) package executed via DBAT Prior releases of DB2 treated RELEASE(DEALLOCATE) packages as thoughbound with RELEASE(COMMIT) when executed via DBAT–Once instantiated, high performance DBAT will remain dedicated toinstantiating connection and can be reused for 200 units of work–Best used for simple, high-volume DRDA transactions–Recommendation: bind IBM Data Server Driver or DB2 Connect packagesinto NULLID collection with RELEASE(COMMIT), and into anothercollection (e.g., NULLID2) with RELEASE(DEALLOCATE) Then, via client-side data source property, point to one collection or the other tocontrol which applications use high-performance DBATs–Can “turn off” high-performance DBATs (perhaps to get some ALTERs,REBINDs, etc. done) via command: -MODIFY DDF PKGREL(COMMIT) Turn back on with -MODIFY DDF PKGREL(BNDOPT)25 20152013 IBM Corporation
Information ManagementApplication efficiency: GETPAGES #1 determinant of CPU time for DB2-accessing job/transaction Ways to reduce GETPAGE activity:–Change query access paths Often involves adding indexes or modifying existing indexes Might involve rewriting the query to get a better-performing access path–Re-cluster data ALTER INDEX CLUSTER / NOT CLUSTER Table-controlled partitioning: can have different clustering, partitioning keys–Archive/purge “cold” data, so “warm” data not so spread out in table DB2 11 provides automatic data archiving capability -managed-data-archiving-feature.htmlTOTAL BPOOL -359.66 20152013 IBM Corporation
Information ManagementApplication efficiency: dynamic SQL cache Tends to be particularly important for client-server transactions(DRDA workload) – often involve execution of dynamic SQL–Recall that when programs issue JDBC or ODBC calls, these areexecuted as dynamic SQL statements on the DB2 for z/OS server–CPU cost of full PREPARE of a statement can be several times the costof statement execution One way to boost statement cache hits: enlarge the dynamicstatement cache (it’s been above 2 GB “bar” since DB2 V8) Also: use parameter markers (vs. literal values) in dynamicSQL statements (cache “hit” requires byte-for-byte match)DYNAMIC SQL STMT-------------------NOT FOUND IN CACHEFOUND IN CACHE27AVERAGE-------A 0.26B 1.05You want to maximizeB / (A B) 20152013 IBM Corporation
Information ManagementDB2 10 and dynamic statement caching CONCENTRATE STATEMENTS WITH LITERALS attribute ofPREPARE statement (can also be enabled on DB2 client sideby specifying keyword in data source or connection property)–If match for dynamic statement with literals not found in cache, literalsreplaced with & and cache is searched to find match for new statement If not found, new statement is prepared and placed in the cache Not quite as CPU-efficient as traditional dynamic statementcaching and parameterized SQL, but less costly than fullprepares of dynamic statements containing literals–Note: may WANT optimization using literals for range predicatesDYNAMIC SQL STMT-------------------CSWL – MATCHES FOUND28AVERAGE-------0.24 20152013 IBM Corporation
Information ManagementApplication efficiency: shifting work to zIIPs zIIP offload reduces cost of computing Options for increasing zIIP utilization:–For DRDA workload, if using traditional DB2 stored procedures, switchto native SQL procedures–If it’s a batch workload, consider binding some packages withDEGREE(ANY) to enable query parallelization May want to limit degree of parallelization via PARAMDEG in ZPARM (orthrough the DB2 10-introduced SYSQUERYOPTS catalog table)29AVERAGE----------CP CPU TIMEDB2 (CL.2)---------28.311773 ASE CPU TIME0.000000 B Aim: reduce A by increasing B 20152013 IBM Corporation
Information ManagementThanks for your timeRobert Catterallrfcatter@us.ibm.com30 20152013 IBM Corporation
Mainframe DB2 people have an abundance of data fields they can look at for performance monitoring purposes -In DB2 monitor displays and reports -In z/OS monitor displays and reports -In various DB2 -DISPLAY commands -In CICS (DSNC) DISPLAY STATISTICS command output With all of these numbers staring back at you, you could: