Transcription
NEW TECHNOLOGY AND TEACHER PRODUCTIVITYEric S. Taylor†Harvard UniversityJanuary 2018I study the effects of a labor-replacing computer technology on the productivity ofclassroom teachers. In a series of field-experiments, teachers were providedcomputer-aided instruction (CAI) software for use in their classrooms; CAIprovides individualized tutoring and practice to students one-on-one with thecomputer acting as the teacher. In mathematics, CAI reduces by one-quarter thevariance of teacher productivity, as measured by student test score gains. Thereduction comes both from improvements for otherwise low-performing teachers,but also losses among high-performers. The change in productivity partly reflectschanges in teachers’ decisions about how to allocate class time and teachers’effort.JEL No. I2, J2, M5, O33†eric taylor@harvard.edu, Gutman Library 469, 6 Appian Way, Cambridge, MA 02138, 617-4961232. I thank Eric Bettinger, Marianne Bitler, Nick Bloom, Larry Cuban, Tom Dee, DavidDeming, Caroline Hoxby, Brian Jacob, Ed Lazear, Susanna Loeb, John Papay, Sean Reardon,Jonah Rockoff, Doug Staiger, and seminar participants at UC Berkeley, University of Chicago,Harvard University, UC Irvine, Stanford University, and University of Virginia for helpfuldiscussions and comments. I also thank Lisa Barrow, Lisa Pithers, and Cecilia Rouse for sharingdata from the ICL experiment, the Institute for Education Sciences for providing access to datafrom the other experiments, and the original research teams who carried out the experiments andcollected the data. Financial support was provided by the Institute of Education Sciences, U.S.Department of Education, through Grant R305B090016 to Stanford University; and by theNational Academy of Education/Spencer Dissertation Fellowship Program.
Computers in the workplace have, broadly speaking, improved laborproductivity.1 The productivity effects of computers arise, in part, becauseworkers’ jobs change: computers replace humans in performing some tasks,freeing workers’ skills and time to shift to new or different tasks; and computersenhance human skills in other tasks, further encouraging reallocation of labor(Autor, Katz, and Krueger 1998; Autor, Levy, and Murnane 2003; Acemoglu andAutor 2011). In this study I measure the effects of a labor-replacing computertechnology on the productivity of classroom teachers. My focus on oneoccupation—and a setting where both workers and their job responsibilitiesremain fixed—provides an opportunity to examine the heterogeneity of effects onindividual productivity.Whether and how computers affect teacher productivity is immediatelyrelevant to both ongoing education policy debates about teaching quality and theday-to-day management of a large workforce. K-12 schools employ one out of tencollege-educated American workers as teachers,2 and a consistent empiricalliterature documents substantial between-teacher variation in job performance.3 Inrecent years, these differences in teacher productivity have become the center ofpolitical and managerial efforts to improve public schools. Little is known aboutwhat causes these differences, and most interventions have focused either onchanging the stock of teacher skills—through selection or training—or on1See for example Jorgenson, Ho, and Stiroh (2005), Oliner, Sichel, and Stiroh (2007), andSyverson (2011).2Author’s calculations from Current Population Survey 1990-2010.3Much of the literature focuses on teacher contributions to academic skills, measured by testscores. In a typical result, students assigned to a teacher at the 75th percentile of the jobperformance distribution will score between 0.07-0.15 standard deviations higher on achievementtests than their peers assigned to the average teacher (Jackson, Rockoff, and Staiger 2014). Otherwork documents variation in teachers’ effects on non-test-score outcomes (Jackson 2014), andteacher’ observed classroom practices (Kane, McCaffrey, Miller, and Staiger 2013). Recentevidence suggests that variability in performance contributes to students’ long-run social andeconomic success (Chetty, Friedman, and Rockoff 2014b).1
changing teacher effort—through incentives and evaluation.4 Computertechnology is both a potential contributor to observed performance differencesand a potential intervention to improve performance, but, to date, it has receivedlittle attention in the empirical literature on teachers and teaching.5Two features of most classroom teaching jobs are important to predictingthe effects of computers on individual productivity, and these features makeheterogeneous effects more likely. First, the job of a teacher involves multipletasks—lecturing, discipline, one-on-one tutoring, communicating with parents,grading, etc.—each requiring different skills to perform.6 The productivity effectsof a new computer which replaces (complements) one skill will depend on thedistribution of that particular skill among the teachers. The effects of a laborreplacing technology will further depend on how the teacher’s effort and time,newly freed-up by the computer, are reallocated across the tasks which remain theresponsibility of the teacher herself. Second, teachers have substantial autonomyin deciding how to allocate their own time and effort, and the time and effort oftheir students, across different tasks. In other words, individual teachers makemeaningful educational production decisions in their own classrooms. Differencesin these choices likely explain some of the baseline variability in teacherproductivity, even conditional on teacher skills. And, when a new labor-replacingcomputer becomes available, teachers themselves will partly decide how effortand time are reallocated. These two features are not unique to teaching, however,4For examples from the literature on teacher selection see Staiger and Rockoff (2010), andRothstein (2012). For training see Taylor and Tyler (2012). For incentives and evaluation seeBarlevy and Neal (2012) and Rockoff, Staiger, Kane and Taylor (2012).5There is some theoretical work on this topic. Acemoglu, Laibson, and List (2014) show howtechnology could permit productivity-enhancing specialization in teacher job design. Lakdawalla(2006) and Gilpin and Kaganovich (2011) consider how economy-wide technological changeaffects selection of people into and out of the teacher labor market by changing the relative skilldemands in other sectors. Barrow, Markman, and Rouse (2008, 2009) discuss how technologycould increase the quantity of instructional time.6By “skills” I mean teachers’ current capabilities whether innate, or acquired by training orexperience, or both.2
and so the analysis in this paper should have applicability in other occupations(see for example Atkin et al. 2017). The theoretical framework in Appendix Bdescribes, in greater detail, the salient features of a teacher’s job, the teacher’seducational production problem generally, and the introduction of a newtechnology.7In this paper I analyze data from a series of randomized field experimentsin which teachers were provided computer-aided instruction (CAI) software foruse in their classrooms. I first estimate the treatment effect on the variance ofteacher productivity, as measured by contributions to student test score growth. Ithen examine whether the software affected individual teachers’ productivitydifferentially, and examine the extent to which the software changed teachers’work effort and decisions about how to allocate time across job tasks.Computer-aided instruction software effectively replaces teacher labor. Itis designed to deliver personalized instruction and practice to students one-onone, with each student working independently at her own computer and thecomputer taking the role of the teacher. Most current CAI programs adaptivelyselect each new lesson or practice problem based on the individual student’scurrent understanding as measured by previous practice problems and quizzes.8The experiments collectively tested 18 different CAI software products acrossreading in grades 1, 4, and 6; and for math in grade 6, pre-algebra, and algebra.I report evidence that, among math teachers, the introduction of computeraided instruction software reduces by approximately one-quarter the variation inI propose a version of the teacher’s problem that (i) makes a clear distinction between the tasksthat comprise the job of a classroom teacher, and a teacher’s skills in each of those tasks; and (ii)explicitly considers the teacher’s own decisions about education production in her classroom. Thetask-skills distinction is a useful and increasingly common feature in the literature on howtechnical change affects labor (Acemoglu and Autor 2011).8A distinction is sometimes made between computer-aided and computer-managed instruction,with the latter reserved for software which includes the adaptive, individualized features. Forsimplicity and following prior usage in economics, I refer to this broader category as computeraided instruction or CAI.73
teacher productivity, as measured by student test scores. The standard deviation ofteacher effects among treatment teachers was 0.22 student standard deviations,compared to 0.30 for control teachers. The reduction in variance is the result ofimprovements for otherwise low-producing teachers, but also losses inproductivity among otherwise high-producing teachers. However, estimates forreading teacher productivity show no treatment effects.The sign of the effect on variance is likely consistent with most reader’spriors. If a computer skill replaces teacher skill in performing a given task, thenthe between-teacher variation in the productivity of that particular task shouldshrink. However, skill substitution in the given task is only the first-order effect.The total effect of some new technology on the variance of teacher productivitywill depend on how individual teachers choose to reallocate time and effort acrossother tasks after giving some task(s) to the computer (see Appendix B for morediscussion of this point and the next two paragraphs).I also find evidence that the new software changes how teachers’ carry outtheir job day-to-day. Data from classroom observations show a substantialreallocation of class time across tasks: treatment teachers increase by 35-38percent the share of class time devoted to individual student work (often workusing the CAI software), with offsetting reductions in the share of class time inwhole-class lectures. This reallocation is consistent with teachers making arational production decision: spending more of their class-time budget onindividual student work and less on lectures because CAI increases the marginalrate of technical substitution of the former for the latter in producing studentachievement. The reallocation is further motivated by a change in the relativeeffort costs. CAI reduces teacher effort on two margins. First, the teacher’s roleduring individual student practice time shrinks to mostly monitoring instead ofactively leading. Second, treatment math teachers reduce their total work hours,cutting time previously spent on planning and grading in particular.4
Additionally, the reduction in effort costs, especially at the labor-leisuremargin, is one explanation for why high-performing teachers might rationallychoose to begin using CAI even though it reduces their student’s achievementscores. Consistent with this explanation, as detailed below, the labor-leisure shiftis largest among the relatively high-performing teachers. Willingness to tradestudent achievement for reduced own effort adds important nuance to the notionof teachers as motivated agents (Dixit 2002).For most results in the paper, the argument for a causal interpretationrelies only the random assignment study designs. This is the case for the reductionin the variance of teacher productivity, and the average changes in teacher effortand time allocation.9 I use unconditional quantile regression methods to estimatethe treatment effect heterogeneity. Some strong interpretations of quantiletreatment effects require a rank invariance assumption. However, even if thisassumption does not hold, the results still support important causal conclusionsabout the heterogeneity of effects, including the conclusion that productivityimproved for some otherwise low-performing teachers but declined for somehigh-performers.The analysis in this paper suggests new computer technology is animportant contributor to differences in teacher productivity.10 It also highlightsinteractions between teachers’ skills and teachers’ production decisions indetermining observed performance.11 Replacing teacher labor with machines, like9Subtly, while the direction and magnitude of change in the variance of productivity are identifiedby random assignment alone, identifying the level of variance requires a further assumption, i.e.,the standard identifying assumption about student sorting common throughout the teacher valueadded literature. I discuss this issue later in the paper.10Jackson and Makarin (2016) provide experimental evidence from another empirical example:providing lesson plans as a substitute for teacher effort and skill. As with CAI, the effects dependon prior teacher performance. Previously low-performing teachers improved, while there was littleto no effect for high-performing teachers.11Examination of teachers’ production decisions by economists has been rare (Murnane andPhillips 1981; Brown and Saks 1987; and Betts and Shkolnik 1999 are exceptions).5
the computer-aided instruction example I examine, can greatly benefit students insome classrooms, especially the classrooms of low performing teachers, whilesimultaneously making students in other classrooms worse off. This difference inoutcomes arises partly because, given the option, some teachers choose to use anew technology, even if it reduces their students’ achievement, because it alsosubstantially reduces their workload.1. Computers in schools and computer-aided instructionResearch evidence on whether computers improve schooling is mixed atbest. Hundreds of studies take up the question—often reporting positive effects onstudent outcomes—but a minority of studies employ research designs appropriatefor strong causal claims. That minority find mixed or null results (see reviews byKirkpatrick and Cuban 1998; Cuban 2001; Murphy et al. 2001; Pearson et al.2005). In the economics literature, several studies examine variation in schools’computer use induced by changes in subsidies (Angrist and Lavy 2002; Goolsbeeand Guryan 2006; Machin, McNally, and Silva 2007; Leuven, Lindahl,Oosterbeek, and Webbink 2007; Barrera-Osorio and Linden 2009). In thesestudies, schools respond to the subsidies by increasing digital technologypurchases, as expected, but with no consistent effects on student outcomes. Inbroad cross-sectional data, Fuchs and Woessmann (2004) find positivecorrelations between computers and student outcomes, but also demonstrate thatthose relationships are artifacts of omitted variables bias.1212Evidence on the educational benefits of home computers is also mixed. Fuchs and Woessmann(2004), Vigdor and Ladd (2010), and Malamud and Pop-Eleches (2011) all find negative effects ofhome computers. In a recent field-experiment, Fairlie and Robinson (2013) find no effect of acomputer at home on achievement, attendance, or discipline in school. By contrast, Fairlie (2005),Schmitt and Wadsworth (2006), Fairlie, Beltran, and Das (2010), and Fairlie and London (2012)all find positive effects.6
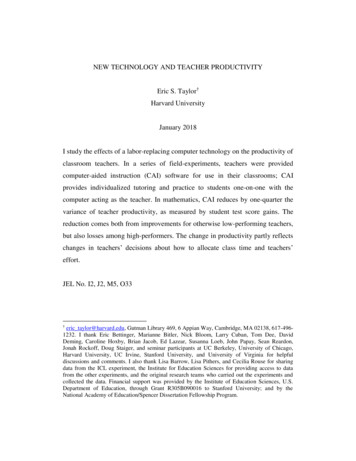
Of course, “computers in schools” is a broad category of interventions.Computers can contribute to a range of tasks in schools: from administrativetasks, like scheduling classes or monitoring attendance, to the core tasks ofinstruction, like lecturing and homework. Today, software and digital products foruse in schools is a nearly eight billion dollar industry (Education Week 2013). Inthis paper, I focus on one form of educational computer technology—computeraided instruction software—which is designed to contribute directly to theinstruction of students in classrooms.1.A Description of computer-aided instructionComputer-aided instruction (CAI) software is designed to replacetraditional teacher labor by delivering personalized instruction and practiceproblems to students one-on-one, with each student working largelyindependently at her own computer. Most CAI programs adaptively select eachnew tutorial or practice problem based on the individual student’s currentunderstanding as measured by past performance on problems and quizzes. If thestudent has yet to master a particular concept, the software teaches that conceptagain. Most products provide detailed reports on each student’s progress toteachers.Figure 1 shows screen images from two different CAI products includedin the data for this paper. As the top panel shows, from software for use in analgebra class, some CAI products largely replicate a chalkboard-like or textbooklike environment, though the product shown does actively respond in real-timewith feedback and help as the student enters responses. The bottom panel, from afirst grade reading lesson, shows one frame from a video teaching phonics for theletters l, i, and d. With its animated characters and energetic tone of voice, thelatter is, perhaps, an example of the often cited notion that computers can providea more “engaging” experience for students.7
1.B Evidence on the student achievement effects of computer-aided instructionWhile CAI was a new option for (most) teachers in this study, CAI is not anew technology. The psychologist B. F. Skinner proposed a “teaching machine”in the 1950s, and the development and research evaluation of computer-aidedinstruction dates back to at least the mid-1960s. Early experimental studiesdocumented positive, often large, effects on student achievement (Suppes andMorningstar 1969; Jamison, Fletcher, Suppes, and Atkinson 1976).In the past decade, results on CAI have been decidedly more mixed, again,especially if one focuses on studies with rigorous designs (see review in Dynarskiet al. 2007). Many field-experiments testing several software programs find zeroeffects of CAI (or at least null results) on student test scores in reading and mathclasses at elementary and secondary school levels (for reading see Rouse andKrueger 2004; Drummond et al. 2011; for math see Cavalluzzo et al. 2012; Pane,Griffin, McCaffrey, and Karam 2013; for both see Dynarski et al. 2007).Exceptions include both strong positive and strong negative effects (for positiveeffects see He, Lindon, and MacLeod 2008; Banerjee, Cole, Duflo, and Linden2009; Barrow, Markman, and Rouse 2009; for negative effects see Lindon 2008;Pane, McCaffrey, Slaughter, Steele, and Ikemoto 2010).13These generally null average test-score effects may, however, be maskingimportant differences from classroom to classroom. For example, Barrow,Markman, and Rouse (2009) show that the test-score gains from CAI are largerfor students who should benefit most from an individualized pace of instruction:students in large classes, students far behind their peers academically, andstudents with poor school attendance rates. I focus in this paper on differencesbetween teachers in how CAI affects their productivity; a question as yetResults cited in this paragraph track outcomes for just one school year: the teacher’s first yearusing the software. Outcomes in the second year are occasionally measured, but just as mixed(Campuzano et al. 2009, Pane et al. 2013).138
unaddressed in the literature on computers in schools or teacher productivitygenerally.In this study I use data from four of the experiments cited above: Dynarskiet al. (2007), Barrow, Markman, and Rouse (2009), Drummond et al. (2011), andCavalluzzo et al. (2012). All but two of the 18 products tested had no effect (or atleast null results) on average test scores.14 None of the four original analysesexamined how CAI affects teacher productivity.2. Setting, data, and experimental designsData for this study were collected in four field-experiments conductedduring the past decade. In each experiment, teachers randomly assigned to thetreatment condition received computer-aided instruction (CAI) software to beginusing in their classrooms. As described earlier, in nearly all cases, the treatmenthad no detectable effect on average student test scores (Appendix Table A1).Table 1 summarizes the key details of each experiment: randomization design,products tested, grade-levels and subjects, and key data collected.Collectively the experiments tested 18 different CAI software programs inreading classes in grades 1, 4, and 6; and mathematics in grade 6, pre-algebra(typically grade 8), and algebra (typically grade 9). The combined analysis sampleincludes more than 650 teachers and 17,000 students in over 200 schools and 80districts from all regions of United States.15 By design, participating schoolsgenerally had low levels of student achievement at baseline and served mostlystudents in poverty. Table 2 reports statistics for available student and teacher14Appendix Table A1 reports mean test-score effects both from the original study reports (Column1) and from my own re-analysis (Columns 2 and 4). The two exceptions to null effects are:Barrow, Markman, and Rouse (2009) who find a positive effect for ICL of 0.17 student standarddeviations; I find the same result. Cavalluzzo et al. (2012) report a non-significant but negativeeffect of 0.15 student standard deviations; I find essentially the same negative point estimate, butestimate it with sufficient precision to find it statistically significant.15Three of four experiments were funded by the Institute for Education Sciences, U.S. Departmentof Education. IES requires that all references to sample sizes be rounded to the nearest 10.9
characteristics. Many schools were in large urban districts, but suburban and ruralschools also participated. All schools and districts volunteered to participate.Data from classroom observations shows strong take-up of the treatment,at least on the extensive margin: students were observed using CAI in 79 percentof math teachers’ classes and 96 percent of reading teachers’ classes (see Table 5Row 1). In control classrooms the rates were 15 and 17 percent respectively.Throughout the paper I limit discussion to intent to treat effects in the interest ofspace. Two-thirds of treatment classes used CAI on computers in their ownclassroom, and one-third in shared computer labs (data from EET study only).The experiments lasted for one school year, thus, all outcomes were measuredduring teachers’ first year using the new software.2.A DataStudents in all experiments were tested both pre- and post-experimentusing standardized achievement tests. Starting at scale score units, I standardize(mean 0, standard deviation 1) all test scores within cells defined by grade,subject, and test form, using control means and standard deviations. Testpublisher and form varied by grade, subject, and experiment (see Table 1); but alltests were “low stakes” in the sense that students’ scores were not used for formalaccountability systems like No Child Left Behind or teacher evaluation.16 Eachexperiment also collected some, but differing, demographic characteristics ofstudents and teachers.Three of the four experiments conducted classroom observations tomeasure how teachers divided class time among different tasks and activities.17Using these data, I measure the proportion of class time spent in three categories:whole class instruction or lectures, small group activities, and individual student16In all but one case, the NROC experiment, the tests were administered only for purposes of theexperiment.17Appendix C describes the differences in data collection, and my decisions in combining data.10
work. The observation data also record whether CAI software—either studyprovided products or other products—was used during the class.One experiment, the “Evaluation of Educational Technologies” (EET),also conducted extensive interviews with teachers twice during the study schoolyear. Most notably, in the spring interviewers asked teachers to estimate howmany hours, in or out of school, they spent in a typical week on various workrelated tasks: teaching, preparing lessons, grading, and administering tests. I useteachers’ responses to examine labor-leisure decisions. For treatment teachers, theEET interviews also include several questions about CAI use specifically: timespent learning the software, adjusting lesson plans, and setting up the systems;frequency of technical problems; use of software reports provided by thesoftware; and others.2.B Experimental designsAll four studies divided teachers between treatment and control conditionsby random assignment, but with somewhat different designs. The “Evaluation ofEducational Technologies” (EET) study, which included 15 different CAIproducts, and the evaluation of Thinking Reader (TR) both randomly assignedteachers within schools. In the EET study, all treatment teachers in the sameschool and grade-level were given the same CAI software product to use. Theevaluation of National Repository of Online Courses Algebra I (NROC) randomlyassigned schools within three strata defined by when the school was recruited toparticipate. The evaluation of I CAN Learn (ICL) randomly assigned classeswithin strata defined by class period (i.e., when during the daily schedule the classmet). About one-half of teachers in the ICL experiment taught both a treatmentand control class.To assess whether the random assignment procedures were successful, Icompare the average pre-treatment characteristics of treatment and controlsamples in Table 2. The samples are relatively well balanced, though observable11
characteristics differ from experiment to experiment. Both treatment teachers andstudents appear more likely to be male, but I cannot reject a test of the joint nullof all mean differences equal to zero. Additional details on random assignmentprocedures and additional tests are provided in the original study reports.18My measurement of teacher productivity requires student observationswith both pre- and post-experiment test scores. Thus, even if samples werebalanced at baseline, treatment-induced differences in attrition over the schoolyear could bias my estimates. Since, as I describe shortly, teacher productivity ismeasured with student test score growth, attrition correlated with baseline testscores is of particular concern. As shown in Table 3, there is little evidence ofdifferential attrition patterns in math classes.19 Treatment did not affect averagestudent (top panel) and teacher (bottom panel) attrition rates, nor did treatmentchange the relationships between baseline test scores and the likelihood ofattrition. In reading classes, however, treatment appears to have reduced attritionoverall, but increased the likelihood that a teacher would attrit if assigned a moreheterogeneously skilled class. As shown in the appendix, these reading attritiondifferences are largely limited to the TR experiment. Notably, though, attritionrates for teachers were very low in both subjects—less than two percent of allteachers attrited.3. Effects of CAI on the variance of teacher productivityMy first empirical objective is to estimate the causal effect of treatment—providing new CAI technology to classroom teachers—on the variance of teacherproductivity. Throughout the paper I focus on one aspect of productivity: a18Results of an additional test are also consistent with random assignment: I apply the methodsdescribed in Section 3.A but replace outcome test score with baseline test score. p-values for thistest range between 0.53-0.60.19Within panels, each column in Table 3 reports coefficients from a linear probability model with“attrited” as the outcome. All models include fixed effects for randomization blocks.12
teacher’s contribution to student academic achievement as measured by test scoregrowth. A large literature documents substantial variability in this measure ofproductivity (Jackson, Rockoff, and Staiger 2014), and recent evidence suggeststhat variability is predictive of teacher productivity differences measured withstudents’ long-run economic and social outcomes (Chetty, Friedman, and Rockoff2014b).3.A MethodsA teacher’s contribution to her students’ test scores is not directlyobservable. To isolate the teacher’s contribution, I assume a statistical model ofstudent test scores where a test score, 𝐴𝑖,𝑡 , for student 𝑖 at the end of school year 𝑡can be written𝐴𝑖,𝑡 𝑓𝑒(𝑖) (𝐴𝑖,𝑡 1 ) 𝜓𝑠(𝑖,𝑡) 𝜇𝑗(𝑖,𝑡) 𝜀𝑖,𝑡 .(1)The 𝜇𝑗(𝑖,𝑡) term represents the effect of teacher 𝑗 on student 𝑖’s test score; net ofprior achievement, 𝑓𝑒(𝑖) (𝐴𝑖,𝑡 1 ), and school effects, 𝜓𝑠(𝑖,𝑡) . The specification in 1,now commonplace in the literature on teachers, is motivated by a dynamic modelof education production, suggested by Todd and Wolpin (2003), in which priortest score, 𝐴𝑖,𝑡 1 , is a sufficient statistic for differences in prior inputs.With the model in 1 as a key building block, I take two separateapproaches to estimating the effect of treatment on the variance of teacherproductivity𝛿 𝑣𝑎𝑟(𝜇 𝑇 1) 𝑣𝑎𝑟(𝜇 𝑇 0).The first approach is a least-squares estimate of the conditional variance function.Specifically, I estimate the treatment effect on the variance 𝛿̂ 𝐿𝑆 by fitting2(𝜇𝑗 𝔼[𝜇𝑗 𝑇𝑗 , 𝜋𝑏(𝑗) ]) 𝛿 𝐿𝑆 𝑇𝑗 𝜋𝑏(𝑗) 𝜈𝑗 ,(2)13
where 𝑇𝑗 is an indicator 1 if the teacher was assigned to the CAI treatment andzero otherwise, and 𝜋𝑏(𝑗) represent fixed effects for each randomization blockgroup, 𝑏. The latter are included to account for the differing probabilities ofselection into treatment; probabilities dictated by each experiment’s design (i.e.,random assignment within schools, recruitment strata, or class period).My approach to estimating Sp
priors. If a computer skill replaces teacher skill in performing a given task, then the between-teacher variation in the productivity of that particular task should shrink. However, skill substitution in the given task is only the first-order effect. The total effect of some new technology on the variance of teacher productivity