Transcription
Session 77, Medicaid Risk Adjustment: Understanding StateSpecific Design & Application for Effective Program ManagementSOA Antitrust DisclaimerSOA Presentation Disclaimer
2019 Health MeetingDAVE NEIMAN, FSA, MAAASUZANNA-GRACE SAYRE, FSA, MAAA, CERAZACH ATERS, ASA, MAAAAMOS ROSSSession 077 Medicaid Risk Adjustment: Understanding StateSpecific Design & Application for Effective Program ManagementJune 25, 2019
Session Overview Explore the national landscape of state Medicaid risk adjustmentprogram design and application and the key differences that driveeffective managed care organization program management. Although many states utilize this mechanism, the application of riskadjustment can vary significantly across states. The primarydifferences include state-specific nuances, population, risk scoremodels and data collection. These state application nuances affect the strategies and tacticsutilized by MCOs for effective risk adjustment program managementincluding provider financial alignment, encounter data submissionand the capture of accurate diagnosis codes. Topics included are Beginner and Intermediate Level2
SOCIETY OF ACTUARIESAntitrust Compliance GuidelinesActive participation in the Society of Actuaries is an important aspect of membership. While the positive contributions of professional societies and associations arewell-recognized and encouraged, association activities are vulnerable to close antitrust scrutiny. By their very nature, associations bring together industry competitorsand other market participants.The United States antitrust laws aim to protect consumers by preserving the free economy and prohibiting anti-competitive business practices; they promotecompetition. There are both state and federal antitrust laws, although state antitrust laws closely follow federal law. The Sherman Act, is the primary U.S. antitrust lawpertaining to association activities. The Sherman Act prohibits every contract, combination or conspiracy that places an unreasonable restraint on trade. There are,however, some activities that are illegal under all circumstances, such as price fixing, market allocation and collusive bidding.There is no safe harbor under the antitrust law for professional association activities. Therefore, association meeting participants should refrain from discussing anyactivity that could potentially be construed as having an anti-competitive effect. Discussions relating to product or service pricing, market allocations, membershiprestrictions, product standardization or other conditions on trade could arguably be perceived as a restraint on trade and may expose the SOA and its members toantitrust enforcement procedures.While participating in all SOA in person meetings, webinars, teleconferences or side discussions, you should avoid discussing competitively sensitive information withcompetitors and follow these guidelines: Do not discuss prices for services or products or anything else that might affect prices Do not discuss what you or other entities plan to do in a particular geographic or product markets or with particular customers. Do not speak on behalf of the SOA or any of its committees unless specifically authorized to do so.Do leave a meeting where any anticompetitive pricing or market allocation discussion occurs.Do alert SOA staff and/or legal counsel to any concerning discussionsDo consult with legal counsel before raising any matter or making a statement that may involve competitively sensitive information.Adherence to these guidelines involves not only avoidance of antitrust violations, but avoidance of behavior which might be so construed. These guidelines only providean overview of prohibited activities. SOA legal counsel reviews meeting agenda and materials as deemed appropriate and any discussion that departs from the formalagenda should be scrutinized carefully. Antitrust compliance is everyone’s responsibility; however, please seek legal counsel if you have any questions or concerns.3
Presentation DisclaimerPresentations are intended for educational purposes only and do not replaceindependent professional judgment. Statements of fact and opinions expressed arethose of the participants individually and, unless expressly stated to the contrary, arenot the opinion or position of the Society of Actuaries, its cosponsors or itscommittees. The Society of Actuaries does not endorse or approve, and assumes noresponsibility for, the content, accuracy or completeness of the informationpresented. Attendees should note that the sessions are audio-recorded and may bepublished in various media, including print, audio and video formats without furthernotice.4
Dave Neiman
Suzanna-Grace SayreBorn in Greenville, South CarolinaGraduated from Georgia Tech in 2003 with a degree inMath and PhysicsMasters from Georgia State in Actuarial ScienceConsultant with Wakely since 2016Hobbies:- Rock Climbing- Travel- Really nerdy board games
Zachary AtersBorn in New Albany, Indiana (Louisville, KY)Married for 30 years to Julie Aters. We have twochildren, 28 yr old daughter (Erika) and 25 yr old son(Seth)Practicing within the Medicaid arena since 2005,experience in 15 states and all types of programs.Currently the Actuary of record for 3 state MedicaidprogramsA Senior Actuary with Optumas since 2011Hobbies:- Family/Friends- Golf/Diving- Music
Amos RossBorn in Wheeling, West VirginiaGraduated from West Virginia University in 2005 with adegree in AccountingMBA and Masters in Public Policy Management fromCarnegie Mellon UniversityJoined Highmark in 2012Hobbies:- Playing Music- Taking things apart- Running
Agenda Introduction History of Risk Adjustment in Medicaid Current “State” Using Risk Adjustment in Rate Setting Predictive value of CDPS and other national models Limitations in Predictive Values of Risk Scores Operational considerations
Introduction – State Implementation Considerations Risk Adjustment (or not) by Category of Aid Data Sources & Timeline Model Selection Risk Weights: Prospective / Concurrent, Standard / Calibrated, Population Level (?) Eligibility Requirements: Base Period & Concurrent Payment Period Enrollment (?) Data Exclusions & Limitations Risk Score Measurement Period and Payment Application Lag Encounter Data Submission (Supplemental Data Feeds?) State Reporting
Goals of Risk Adjustment To make equitable comparisons among health plans that take the health status oftheir enrolled members into consideration To minimize the incentives for plans and providers from selectively enrollinghealthier members To provide adequate financing for those who treat individuals with higher-thanaverage health needs For Medicaid, provide a budget-neutral (zero-sum) mechanism to allocatecapitated payments between contracted managed care organizationsSource: ResDAC
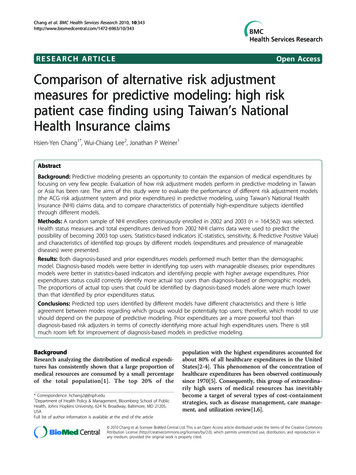
Medicaid Risk Adjustment Overview Programs vary by state Zero-sum, budget neutral approach Prospective adjustment (issuers know their risk scores in advance) Member-level risk scores calculated using encounter data Five most common risk-adjustment models: CDPS/MedicaidRx, CRG, ACG, ERG,DxCG Some states have developed state-specific risk weights
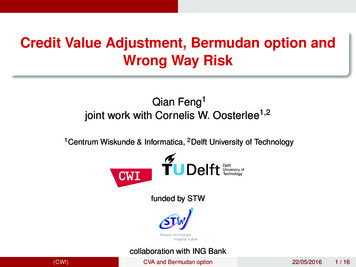
Medicaid Risk Adjustment Overview% of Total Medicaid Enrollment by Model47.79%Number of States with Each Model
Medicaid Risk Adjustment Models Chronic Illness and Disability Payment System (CDPS) – developed by RichardKronick at UC San Diego MedicaidRx – developed by Richard Kronick and Todd Gilmer at UC San Diego Clinical Risk Groups (CRG) – developed by DRG team at 3M Adjusted Clinical Groups (ACG) – developed by Jonathan Weiner and BarbaraStarfield at Johns Hopkins University Episode Risk Groups (ERG) – developed by Symmetry, now owned by Optum Diagnostic Cost Groups (DxCG) – developed by Arlene Ash and Randall Ellis ofBoston University
Risk Adjustment Using CDPS CDPS begins with an intercept factor, adds demographic components CDPS maps diagnoses to 67 CDPS categories corresponding to major body systems or chronicdiseases The CDPS model is similar to HCC models used for Medicare, but places greater emphasis on lesscommon, more costly conditions that are more prevalent among disabled Medicaid beneficiaries CDPS has different sets of risk weights for disabled, adults, and children Conditions are hierarchical within major categories For example, in the major category cardiovascular: CARVH, very high (e.g. heart transplant) CARM, medium (e.g. heart failure) CARL, low (e.g. AMI) CAREL, extra low (e.g. hypertension)
Risk Adjustment Using CDPS Weights are additive across categories Within major categories, only the most severe diagnosis counts Example: if a beneficiary has both diabetes and depression, both count towardsthe risk score Example: if a beneficiary has heart failure and hypertension, only heart failure(CARVH) counts towards the risk score
Risk Score Adjustments Risk scores are calculated for each beneficiary Adjustments for region, category of aid, etc may be applied Most programs calculate an average case-mix score for each health plan The same capitation amount is paid for each member Plan-base risk adjustment advantages: Reduced IT burden Easier to account for new members without claims history Easier to monitor plan payments and adjust if necessary
Actuarial Adjustments Partial capitation Partial risk adjustment Members without sufficient claims history Risk corridors Reinsurance Carve-outs (removing risk weights) Behavioral health Pregnancy and delivery Pharmacy
Should Health Based Risk Adjustment be used in RateDevelopment?Medicaid Program Background Comprised of many populations, Categoriesof Aid (COA) Each COA must have an actuarially sound rate Typically, multiple MCOs participate in aprogram Equal distribution of risk across MCOs/COAs isnot likely Goal of rate development is “Paymentmatching Risk”
Widely Accepted Risk Score Tool Implies Actuary canUse it Within a Program, Right?What about ASOP 45 – Use of Health Status Based Risk Adjustment Methodologies? Intended Use – The actuary should consider whether the model was designed to estimatewhat the actuary is trying to estimate. Population and Program - The actuary should consider whether the population andprogram to which the model is being applied is reasonably consistent with those used todevelop the model. Predictive Ability—The actuary should consider the predictive ability of the model and thecharacteristics of the various predictive performance measures commonly used andpublished. Input Data—The input data needs to be consistent with the data used to develop themodel and also needs to undergo significant data validation prior to implementing riskscore tool. Program Specifics—The specifics of the program for which risk adjustment is being usedshould be considered. Recalibration—The actuary should consider the necessity and advantages of recalibrationin the context of available resources, materiality of expected changes in results,appropriateness of the unadjusted model risk weights, and limitations in the data availablefor recalibration
Predictive Value of Various Risk Score ToolsBased on SOA study: Accuracy of Claims Based Risk Scoring Models, October 2016 Concurrent Diagnosis Only Models – 24.2% to 52.7% Concurrent Pharmacy Only Models – 12.9% to 30.1% Concurrent Diagnosis/Pharmacy Models – 25.6% to55.4% Prospective Diagnosis Only Models – 9.1% to 20.7% Prospective Pharmacy Only Models – 8.6% to 15.1% Prospective Diagnosis/Pharmacy Models – 10.0% to22.0%
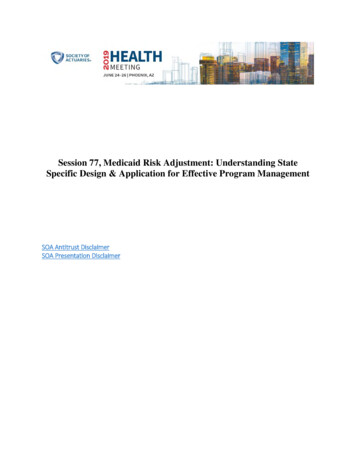
Limitations of Predictive Value – Example of UnintendedConsequencesSituation Your state program is going through a redesign requiring members to bereassigned to MCOs An attribution policy is designed by state to ensure member continuity of carewhen assigning members to MCOs. The attribution policy allows chronic members to stay with their existing andbe excluded from random assignment between MCOs. CDPS Rx has historically been utilized within the program to assist withmatching payment to risk.Question Should the actuary continue to use CDPS Rx to ensure payment matches riskunder the redesigned program?
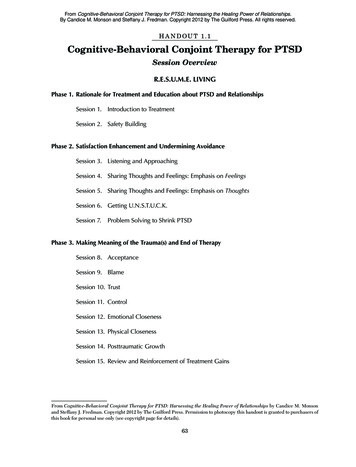
Limitations of Predictive Value – Example of UnintendedConsequencesResultsCOATANFCHILD 06-18Aged/DisabledCAFExpansionExcluded MembersMMsPMPMRisk Score57,163 812.042.5049,780 611.392.53103,199 1,786.612.104,475 1,112.585.3396,354 1,136.113.48Included MembersMMsPMPMRisk Score204,727 195.330.82942,450 98.220.74104,915 377.200.6250,654 307.301.64135,381 192.380.89% DifferencePMPMRisk .8%490.6%290.4%% Difference shows that using risk scores would haveunderestimated acuity level for Excluded Members. ExcludedMembers include members with chronic conditions that havehigh annual total cost of care.
2019 Health MeetingMedicaid Risk AdjustmentProvider Engagement Consideration
Simplify for Success – RA OperationsInform RA operations strategy with output fromanalytical models to ensure risk adjustmentprograms are aligned with specific opportunitiesidentified:Known & Suspected Risk Gaps1. Increase opportunity: Direct engagement with members Provider engagement with members Wait and chase2. Improve recapture:Lack of OpportunityFailure to recapture Prospective - integrate gap data into care delivery Retrospective - chart reviews and data submission3. Improve documentation: Embed clinical support to facilitate documentationand education Monitor and educate as neededCondition not documentedClosed Risk Gaps26
Potential Provider Roles in Medicaid Risk Adjustment Member Engagement Medical Management & Services Rendered Health Risk Assessment / Annual Health Assessment Social Determinants of Health Data Capture Clinical Data Accuracy Complete & Accurate Claims Submission State Reporting Medical Record Retrieval Claims Re-Submission
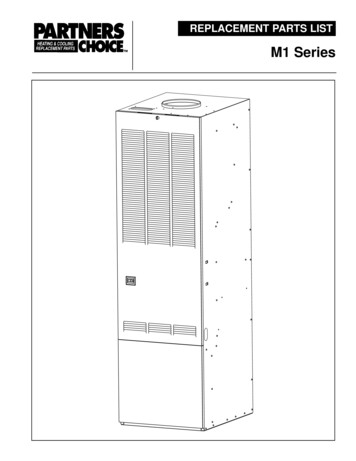
Provider Engagement1. Reimburse providers for quality of care andquality of coding work or include in valuebased payment model easy to understand andmeasure2. Leverage existing workflows or have flexibleworkflows that minimize workflow disruptionsfor practitioners3. Attribution is key for practitioners – give themcredit for the work they perform and to notpenalize them for work they cannot perform1. Clearconnection toreimbursement6. Willingnessto modifyprogram andtools4. Embed Clinical and administrative support atsystems where you have critical mass andempower them with actionable data2. MinimizeWorkflowDisruptionsProvider Engagement Listen Ask about other riskprograms – what works andwhat does not3. AttributionCredibility5. Gap Credibility5. Refine suspected gap data with embedded staffor get clear alignment on what suspected gapsare being pushed6. Listen and modify – success sounds like “I likethis program because I don’t have to ”4. ClinicalSupport28
Provider Engagement – when we get it right95% .of risk adjusted conditionspresented are addressed
differences include state-specific nuances, population, risk score models and data collection. These state application nuances affect the strategies and tactics utilized by MCOs for effective risk adjustment program management including provider financial alignment, encounter data submission and the capture of accurate diagnosis codes.