Transcription
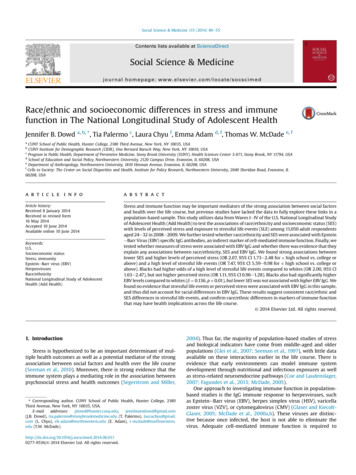
Social Science & Medicine 115 (2014) 49e55Contents lists available at ScienceDirectSocial Science & Medicinejournal homepage: www.elsevier.com/locate/socscimedRace/ethnic and socioeconomic differences in stress and immunefunction in The National Longitudinal Study of Adolescent HealthJennifer B. Dowd a, b, *, Tia Palermo c, Laura Chyu f, Emma Adam d, f, Thomas W. McDade e, faCUNY School of Public Health, Hunter College, 2180 Third Avenue, New York, NY 10035, USACUNY Institute for Demographic Research (CIDR), One Bernard Baruch Way, New York, NY 10010, USAcProgram in Public Health, Department of Preventive Medicine, Stony Brook University (SUNY), Health Sciences Center 3-071, Stony Brook, NY 11794, USAdSchool of Education and Social Policy, Northwestern University, 2120 Campus Drive, Evanston, IL 60208, USAeDepartment of Anthropology, Northwestern University, 1810 Hinman Avenue, Evanston, IL 60208, USAfCells to Society: The Center on Social Disparities and Health, Institute for Policy Research, Northwestern University, 2040 Sheridan Road, Evanston, IL60208, USAba r t i c l e i n f oa b s t r a c tArticle history:Received 8 January 2014Received in revised form16 May 2014Accepted 10 June 2014Available online 10 June 2014Stress and immune function may be important mediators of the strong association between social factorsand health over the life course, but previous studies have lacked the data to fully explore these links in apopulation-based sample. This study utilizes data from Waves IeIV of the U.S. National Longitudinal Studyof Adolescent Health (Add Health) to test the associations of race/ethnicity and socioeconomic status (SES)with levels of perceived stress and exposure to stressful life events (SLE) among 11,050 adult respondentsaged 24e32 in 2008e2009. We further tested whether race/ethnicity and SES were associated with EpsteineBarr Virus (EBV) specific IgG antibodies, an indirect marker of cell-mediated immune function. Finally, wetested whether measures of stress were associated with EBV IgG and whether there was evidence that theyexplain any associations between race/ethnicity, SES and EBV IgG. We found strong associations betweenlower SES and higher levels of perceived stress (OR 2.07, 95% CI 1.73e2.48 for high school vs. college orabove) and a high level of stressful life events (OR 7.47, 95% CI 5.59e9.98 for high school vs. college orabove). Blacks had higher odds of a high level of stressful life events compared to whites (OR 2.00, 95% CI1.63e2.47), but not higher perceived stress (OR 1.11, 95% CI 0.96e1.28). Blacks also had significantly higherEBV levels compared to whites (b ¼ 0.136, p 0.01), but lower SES was not associated with higher EBV IgG. Wefound no evidence that stressful life events or perceived stress were associated with EBV IgG in this sample,and thus did not account for racial differences in EBV IgG. These results suggest consistent race/ethnic andSES differences in stressful life events, and confirm race/ethnic differences in markers of immune functionthat may have health implications across the life course. 2014 Elsevier Ltd. All rights reserved.Keywords:U.S.Socioeconomic statusStress, immunityEpsteineBarr virus (EBV)HerpesvirusesRace/ethnicityNational Longitudinal Study of AdolescentHealth (Add Health)1. IntroductionStress is hypothesized to be an important determinant of multiple health outcomes as well as a potential mediator of the strongassociation between social factors and health over the life course(Seeman et al., 2010). Moreover, there is strong evidence that theimmune system plays a mediating role in the association betweenpsychosocial stress and health outcomes (Segerstrom and Miller,* Corresponding author. CUNY School of Public Health, Hunter College, 2180Third Avenue, New York, NY 10035, dowd@gmail.com(J.B. Dowd), tia.palermo@stonybrookmedicine.edu (T. Palermo), laurachyu@gmail.com (L. Chyu), ek-adam@northwestern.edu (E. Adam), t-mcdade@northwestern.edu (T.W. .06.0110277-9536/ 2014 Elsevier Ltd. All rights reserved.2004). Thus far, the majority of population-based studies of stressand biological indicators have come from middle-aged and olderpopulations (Glei et al., 2007; Seeman et al., 1997), with little dataavailable on these interactions earlier in the life course. There isevidence that early environments can model immune systemdevelopment through nutritional and infectious exposures as wellas stress-related neuroendocrine pathways (Coe and Laudenslager,2007; Fagundes et al., 2013; McDade, 2005).One approach to investigating immune function in populationbased studies is the IgG immune response to herpesviruses, suchas EpsteineBarr virus (EBV), herpes simplex virus (HSV), varicellazoster virus (VZV), or cytomegalovirus (CMV) (Glaser and KiecoltGlaser, 2005; McDade et al., 2000a,b). These viruses are distinctive because once infected, the host is not able to eliminate thevirus. Adequate cell-mediated immune function is required to
50J.B. Dowd et al. / Social Science & Medicine 115 (2014) 49e55maintain the virus in a dormant (i.e. non-replicating) state (Glaseret al., 1991). However, when immune control is weakened, the virusbegins to replicate, which in turn stimulates memory B lymphocytes to increase output of virus-specific IgG antibody (Cacioppoet al., 2002). This results in the seemingly paradoxical observation that increased antibody levels (‘titers’) reflect poorer immunecontrol (Glaser et al., 1991; Kuo et al., 2008). Thus higher EBV antibodies, one focus of this study, provide an indirect measure of oneaspect of cell-mediated immune function (Glaser et al., 1991;Segerstrom and Miller, 2004).The psychoneuroimmunological literature has found consistentassociations between herpesvirus antibody titers and stress-relatedimmune suppression (Glaser and Kiecolt-Glaser, 2005), althoughthese findings are most often measured via short-term stressors inspecialized populations. In particular, studies that have linkedherpesvirus antibodies to stressors include academic stress inmedical students and military cadets (Glaser et al., 1999; Sarid et al.,2002), caregiving for a family member with Alzheimer's disease(Glaser and Kiecolt-Glaser, 1997), involvement in a poor qualitymarriage (Herbert and Cohen, 1993), anticipation of space flight byastronauts (Mehta et al., 2000) and early childhood adversityincluding institutionalization and physical abuse (Shirtcliff et al.,2009). Elevated EBV antibodies specifically have been associatedwith chronic psychosocial stress in Samoan adolescents,discrimination-related stress in Latino immigrants in Oregon, and inU.S. adolescents in the Great Smoky Mountains exposed to lifestrain and traumatic events (McClure et al., 2010; McDade, Stallings,Angold, et al., 2000; McDade et al., 2000). Thus far, the majority ofthis research has come from small-scale, community-based samples that may not generalize to the broader U.S. population. Previous work using nationally representative data from the NationalHealth and Nutritional Examination Survey (NHANES) crosssectionally linked markers of socioeconomic status (SES) toelevated antibody titers of a related herpesvirus, cytomegalovirus(CMV) (Dowd and Aiello, 2009; Dowd et al., 2012). With the limiteddata on chronic or acute stressors available in NHANES, theconnection between SES, stress, and impaired immune function wasonly speculative in these studies. The current study addresses thisgap by examining the connections between social factors, stress,and immune function in young adults in a prospective survey.Exposure to stressors is hypothesized to be patterned by the socialenvironment (Baum et al., 1999), but little recent empirical evidencefrom the U.S. has explicitly examined this link. Lantz et al. foundhigher numbers of negative life events and higher ratings of marital,parental, and financial stress for those with less education and income among adults aged 24e64 years in the American's ChangingLives Study (Lantz et al., 2005), while Gryzwacz and colleagues foundthat adults aged 25e74 with lower levels of education reported fewerdaily stressors in the National Study of Daily Experiences, but thesestressors were more severe (Grzywacz et al., 2004). A small butgrowing literature suggests that SES may moderate associations between stress and health. Results from an adult German sample foundthat the association between CMV IgG and psychological stress wasstrongest in low SES individuals (Rector et al., 2014). Low SES has alsobeen found to predict exaggerated stress reactivity of immune(Brydon et al., 2004) and HPA-axis activity (Gruenewald et al., 2006;Kunz-Ebrecht et al., 2004). The higher frequency or severity ofstressors among disadvantaged individuals may deplete their“reserve capacity,” leading to an erosion of the ability to cope withstress, which may manifest itself biologically (Gallo and Matthews,1999). Individuals with the dual burden of socioeconomic disadvantage and race/ethnicity related stressors may be at even greater risk oflimited access to psychosocial and material coping mechanisms(Myers, 2009). The idea of impaired coping is consistent with thebiological conceptualization of allostatic load (Seeman et al., 2010).The current study utilizes prospective data from Waves IeIV ofthe National Longitudinal Study of Adolescent Health (Add Health)to examine the associations between race/ethnicity and SES, stress,and EBV IgG levels. We hypothesized that black and lower SES respondents would report higher levels of perceived stress and agreater number of stressful life events. We also hypothesized thatlower SES and black race/ethnicity would be associated with higherEBV IgG levels, and that these associations would be partiallyexplained by higher levels of reported stress.2. Data and methodsData come from the National Longitudinal Study of AdolescentHealth (Add Health), a longitudinal study of a nationally representative sample of adolescents begun in 1994e1995 and followedthrough 2008. Four waves of data are available, and the surveyscollect data on social, economic, psychological and physical wellbeing with contextual data on the family, neighborhood, community, school, friendships, peer groups, and romantic relationships.Collection of biological data including EBV antibodies via driedblood spot was expanded in Wave IV to understand the social,behavioral, and biological linkages in health trajectories as the AddHealth cohort ages through adulthood (Carolina PopulationCenter). At the time of the Wave IV interview, respondents werebetween 24 and 32 years old, and included 80.3% of the eligibleWave I in-home sample respondents. Those lost to follow-up sinceWave 1 were significantly more likely to be male, Hispanic or Asian,non-US born, and have a parent with less than a high school education. Trained and certified interviewers used a finger prick toobtain whole blood spots that were dried and shipped to the University of Washington Medical Center Immunology Lab, in SeattleWA for analysis. The blood spots were frozen until processing, andthen analyzed for EpsteineBarr viral capsid antigen IgG using anadaptation of a previously validated ELISA protocol (McDade et al.,2000). Acceptability of the assay was determined by comparing theEBV optical density concentrations of the quality control sampleswith their established values. The sensitivity of the EBV assay was9 AU/ml (arbitrary units per milliliter), the within-assay coefficientof variation was 3.9%, and the between-assay coefficient of variation was 10.2%. EBV concentrations of 162 dried blood spot andpaired serum samples were strongly linearly associated (Pearsonr ¼ 0.95). Additional details of the protocol are available at: nflammation-and-immune-function (Whitsel et al., 2012). IRB approved Add Health contracts forrestricted data access are in place at both Northwestern University andStony Brook University.2.1. MeasuresBecause associations between stress and herpesvirus antibodytiters depend on having been previously infected, the primaryoutcome variable in this analysis was EBV IgG antibody titers forthose respondents who are EBV seropositive. As Add Health has notyet provided guidance regarding seropositivity cut-offs despite theimportance of excluding seronegatives for analysis (Dowd et al.,2013b; Slopen et al., 2013b), we estimated those seropositive asthe top 90% of antibody levels for the survey-weighted populationbased on recent nationally representative estimates from NHANES(Dowd et al., 2013). Continuous EBV antibody levels were logarithmically transformed to normalize the distribution. Sensitivityanalyses examining threshold effects for high EBV titers (top 10%and top 25%) as the outcome revealed similar substantive resultsand are available upon request.
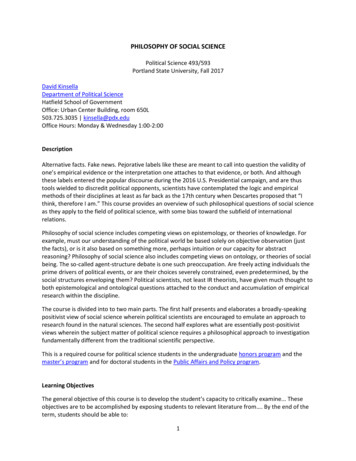
J.B. Dowd et al. / Social Science & Medicine 115 (2014) 49e55The main social exposures of interest were socioeconomic status(SES) and race/ethnicity. SES was measured using completed education levels (less than a high school degree; high school degree,general equivalency diploma, or vocational training instead of highschool; vocational training after high school or some college; college graduate or professional training beyond college) and adulthousehold income, coded categorically as 35,000; 35,000e62,499; 62,500e87,499; and 87,500. A binary indicator for missing current income was included. Adjustment of income by household size was made by including the natural log ofhousehold size as a covariate.Race/ethnicity (white, black, Hispanic, Asian, or other race) wascoded as mutually exclusive categories, though respondents mayhave self-identified as multiple categories. If the respondentanswered “yes” to the question “Are you of Hispanic or Latinoorigin?” that respondent was given a race designation of “Hispanic.” If the respondent marked “black or African American” and anyother race, they were designated as black or African American, andeliminated from the other marked categories. The process wasrepeated for the remaining race categories in the following order:Asian, Native American, other, and white.Stress was measured as perceived stress and both 12-month andlifetime stressful life events (SLE). Since appraisal of stressors is animportant contributor to the resulting physiological response(McEwen and Seeman, 1999), it is possible that perceived stress willbe more closely tied to immune function than more objectivemeasures. Alternatively, stressful life events occurring at criticaldevelopment periods could contribute to immune dysregulation ina more persistent way than recent stress (Fagundes et al., 2013).Perceived stress was assessed in Wave 4 with a validated 4-itemshortened version of the Cohen Perceived Stress scale (PSS)(Cohen et al., 1983). The items assessed stress in the past two weeks(felt unable to control important things in your life; felt confidentabout your ability to handle your personal problems; felt thatthings were going your way; felt difficulties were piling so high thatyou could not overcome them) using a 5-level response scale. Responses for each of the four items were summed, and total scoresranged from 0 to 16. Scores were then categorized into low (0e3),medium (4e6) and high (7e16) perceived stress, based onapproximate tertiles of the data.SLE was assessed with two indices (lifetime and 12 months),both based on a previously utilized additive index (Adkins, 2009)and modified to reflect additional events reported at Wave IV. Thelifetime index summed affirmative responses to questions aboutspecific life events reported at any wave (which varied slightlybetween waves) including: death of parent or mother/fatherfigure; death of sibling; injury resulting from suicide attempt;having had a friend or family member commit suicide; havingwitnessed violence; having been the victim or perpetrator ofviolence or threat of violence (knife or gun pulled, shot or stabbed,slapped/hit/choked/beaten up); child physical abuse; child sexualabuse; running away from home; expulsion from school; experience of miscarriage, stillbirth, abortion or child death; experienceof an unplanned pregnancy; putting a child up for adoption; victimof intimate partner violence; STI diagnosis; experience of combatzone; experience of a firefight in combat; being wounded in combat; killing an enemy in combat; being separated, widowed ordivorced; death of a partner; arrest; conviction of a crime; havingspent time in jail or prison; having spent time in juvenile detentioncenter; cancer diagnosis, being evicted from residence; exchangingsex for money; having been raped; and having been in a motorvehicle accident. Missing information for any wave was coded ¼ 0for that wave, and due to overlapping recall periods in differentwaves, each event was counted a maximum of one time for eachrespondent.51The 12-month SLE index included the following eventsoccurring in the 12 months prior to the Wave IV interview:mother/father-figure death; sibling death; injury resulting fromsuicide attempt; friend or family member committed suicide;witnessing violence; victim or perpetrator of violence or threat ofviolence (knife or gun pulled, shot or stabbed, slapped/hit/choked/beaten up); pregnancy ended in miscarriage, abortion,stillbirth; victim of intimate partner violence; STI diagnosis;cancer diagnosis; arrest; conviction; spent time in jail or prison;or loss of a job; being evicted from residence; experiencing aserious injury; and having been in a motor vehicle accident.Because of the skewed distribution of SLE, for each of theseindices, we calculated quartiles of risk and compared individualsin the highest SLE quartiles to all others ( 6 events for lifetimeSLE, 3 events for 12 month SLE). Results for models usingcontinuous SLE as an exposure or different comparison groupswere substantively similar and available upon request.Additional covariates included body-mass index (BMI) calculated from measured height and weight in Wave IV and acuteinfection reported in the last month due to their potential association with stress and immune parameters (Visser et al., 2001).2.2. Statistical analysisFirst, ordered logistic regression was used to examine the association of SES and race/ethnicity with the Cohen Perceived Stressscale, and binomial logistic regressions were used to test for factorsassociated with the highest quartile of stressful life events (lifetime); both sets of analyses were run on the seropositive sampleonly. Next, we examined the overall associations of SES, race/ethnicity and EBV antibody levels (among seropositives), and individual stress measures and EBV using linear regression modelswith continuous log(EBV) as the outcome. Previous research hasfound EBV to be correlated with life events in girls but not in boys(McDade et al., 2000), but gender interaction tests in our samplewere not significant and thus all analyses use the combined sample.Based on the hypothesis that disadvantaged individuals may havedepleted coping abilities (Gallo and Matthews, 1999), we alsotested whether associations between SLE, perceived stress, and EBVwere moderated by SES or race/ethnicity using interaction terms.All analyses were conducted with weights to account for thecomplex survey design.3. Results3.1. Sample descriptionOf the 15,701 individuals interviewed at Wave IV, 14,038 hadvalid data on EBV IgG levels, 12,690 were EBV seropositive, and 11,486 of these had non-missing values for covariates and samplingweights. Among this group, an additional 484 respondents wereexcluded for report of HIV or Hepatitis C infection, or currentpregnancy, leaving a final analytical sample of 11,050. Of the studyvariables, those dropped from the analysis sample were more likelyto be black, have higher EBV levels, lower BMI, and were less likelyto have attained some college education. Table 1 describes theoverall sample characteristics.3.2. Social factors and perceived and lifetime stressLower levels of completed education and household incomewere strongly associated with increased levels of perceived stress(Table 2). Respondents with less than a high school education hadroughly twice the odds of being in a higher perceived stress category compared to those who completed college and above (OR 2.07,
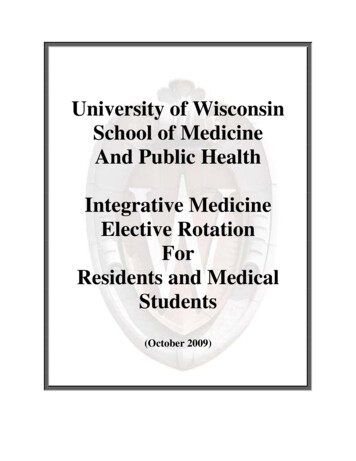
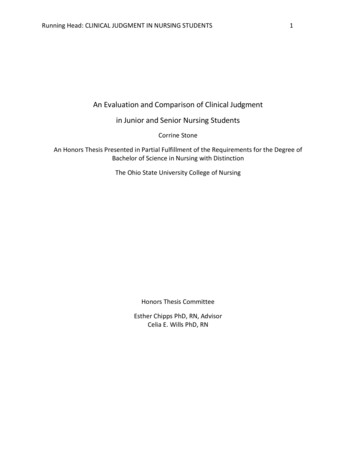
52J.B. Dowd et al. / Social Science & Medicine 115 (2014) 49e55Table 1Sample characteristics, Add Health, Wave IV, weighted (n ¼ 11,050).EBV antibodies (AU/ml)Log (EBV) (AU/ml)Lifetime stressful life events (0e20)0e2 events3e6 events7e10 events11e20 events12 month stressful life events (0e13)0 events1 event2 events3e4 events5 or more eventsCohen perceived stress scaleLow stressMedium stressHigh StressFemaleMaleAgeCompleted educationLess than high schoolHigh schoolSome collegeCollege and aboveIncomeMissing 35,000 35,000e62,499 62,500e87,499 87,500Race/ethnicityWhiteBlackHispanicAsianOther raceActive infection past monthBody Mass Index (kg/m2)Household sizeMean/percentStandard 2.031.760.830.320.270.120.04expected, high lifetime and 12-month SLE were both correlatedwith increased perceived stress.Lower levels of education and income were also strongly associated with more reported stressful life events (Table 3). In fullyadjusted models, respondents with less than a high school education had 7.47 times (95% CI 5.59e9.98) the odds of falling into thehighest quartile of stressful life events compared to college graduates, with a corresponding 3.38 times the odds (95% CI 2.63e4.34)for those who only completed high school. In contrast to perceivedstress, males reported a higher number of SLE, with 1.83 times theodds (95% CI 1.62e2.08) of falling into the highest quartile of SLE.Also in contrast to perceived stress, there were no significant differences between Asians and whites in SLE, but blacks had 2.0 times(95% CI 1.63e2.47) the odds of falling into the highest SLE quartilecompared to whites in fully adjusted models. Hispanics had 32%higher odds of high SLE (OR 1.32, 95% CI 1.01e1.72) compared towhites.3.3. Social factors, stress, and EBV antibody levelsContrary to our hypothesis, we found no associations betweenSES and EBV IgG (Table 4). These results were robust whether education and income were included individually or together in themodel. Race/ethnicity, in contrast, was strongly associated withEBV antibody levels. Specifically, blacks had EBV antibody levelsthat were 13.6% higher than whites, adjusting for education andincome. No significant differences in EBV were found for Asians orHispanics compared to whites. Neither perceived stress nor lifetimestressors were significantly associated with EBV, and consequentlydid not account for any racial differences in EBV antibody levels.Furthermore, from interaction tests we found no evidence that SESor race/ethnicity significantly modified associations between stressand EBV, consistent the absence of main effects of SES and stressors.4. Discussion95% CI 1.73e2.48). Asians reported significantly higher levels ofperceived stress compared to whites, while there were no significant differences for blacks or Hispanics compared to whites. Maleshad lower levels of perceived stress compared to females. AsThis study tested associations between race/ethnicity, SES,stress, and EBV IgG levels in the well-characterized Add Healthcohort. We found that adult education and income levels werestrong predictors of perceived stress and reported lifetime stressfulevents at ages 24e32, but adult socioeconomic factors were notconsistently associated with reduced control of a latentTable 2Ordered logistic regression of characteristics associated with Cohen Perceived Stress Scale.Add Health Wave IV, weighted (n ¼ 11,050)Highest quartile of lifetime stressful life eventsHighest quartile of 12 month stressful life eventsMaleAgeCompleted education (ref ¼ college/above)Less than high schoolHigh schoolSome collegeIncome (ref¼ 87,500) 35,000 35,000e62,499 62,500e87,499Race/ethnicity (ref ¼ white)BlackHispanicAsianF-statistic(1)(2)(3)OR (CI)OR (CI)OR (CI)1.63** (1.44e1.85)0.69** (0.63e0.76)1.02 (0.99e1.05)0.66** (0.60e0.73)1.01 (0.99e1.04)1.51** (1.33e1.71)0.66** (0.60e0.73)1.02 (0.99e1.05)2.07** (1.73e2.48)1.64** (1.40e1.94)1.39** (1.25e1.55)1.76** (1.47e2.11)1.52** (1.29e1.79)1.30** (1.17e1.45)1.87** (1.57e2.24)1.57** (1.33e1.85)1.33** (1.20e1.48)2.79** (2.36e3.29)1.86** (1.61e2.15)1.37** (1.21e1.55)2.64** (2.22e3.14)1.84** (1.59e2.13)1.35** (1.20e1.53)2.71** (2.29e3.21)1.86** (1.61e2.15)1.36** (1.21e1.54)1.11 (0.96e1.28)1.01 (0.86e1.19)1.64** (1.32e2.04)25.921.04 (0.90e1.20)0.99 (0.86e1.15)1.67** (1.34e2.09)30.941.04 (0.90e1.20)0.99 (0.84e1.16)1.66** (1.33e2.07)31.2**p 0.01, *p 0.05.Notes: Robust 95% confidence intervals in parentheses; models also control for "other" race, missing income, recent infection, BMI, and household size.
J.B. Dowd et al. / Social Science & Medicine 115 (2014) 49e5553Table 3Logistic regression of characteristics associated with highest quartile of lifetime stressful life events.Add health Wave IV, weighted (n ¼ 11,050)MaleCompleted education (ref ¼ college/above)Less than high schoolHigh schoolSome collegeIncome (ref¼ 87,500) 35,000 35,000e62,499 62,500e87,499Race/ethnicity (ref ¼ white)BlackHispanicAsianF-statistic(1)(2)(3)OR (CI)OR (CI)OR (CI)1.90** (1.69e2.13)1.70** (1.50e1.93)1.83** (1.62e2.08)9.75** (7.29e13.04)4.14** (3.22e5.31)3.39** (2.76e4.16)7.47** (5.59e9.98)3.38** (2.63e4.34)3.01** (2.44e3.72)2.16** (1.76e2.66)1.38** (1.11e1.72)1.31** (1.09e1.57)2.44** (1.99e3.01)1.46** (1.13e1.89)0.64** (0.45e0.89)30.372.25** (1.83e2.77)1.30 (0.99e1.72)0.84 (0.59e1.21)34.952.00** (1.63e2.47)1.32* (1.01e1.72)0.87 (0.62e1.22)27.66**p 0.01, *p 0.05.Notes: Robust confidence intervals in parentheses; models also control for "other" race, missing income, recent infection, BMI, household size, and age.herpesvirus, one aspect of cell-mediated immune function. Substantial racial/ethnic differences in EBV levels were seen, withblacks having significantly higher levels compared to whites. Theseassociations were not explained by reported stress, which had noassociation with EBV IgG levels. These results suggest that whilesocioeconomic factors strongly predict reported stress, the physiological impact of this stress is not reflected in EBV levels in thisyoung adult sample.Our findings for SES and EBV contribute to a mixed literature inthe association of SES and herpesvirus antibodies. Several previousstudies have identified associations between lower SES and higherherpesvirus antibody levels including CMV in the overall U.S.population (Dowd and Aiello, 2009), CMV and HSV-1 in an sampleof elderly Latino Americans (Dowd et al., 2008) and for HSV-1 in acommunity-based sample from Texas (Stowe et al., 2010). Of note,Stowe et al. found that those with higher levels of education hadhigher levels of EBV antibody despite lower levels of HSV-1 antibody in their sample. Recent national estimates from NHANES alsofound no significant differences in EBV titers by family SES amongchildren aged 6e19, although elevated EBV antibodies were seen inblacks compared to whites, consistent with our findings (Dowdet al., 2013; Ford and Stowe, 2013). Together these results suggestthat the association of SES with EBV may differ from that of otherherpes viruses; a result that deserves further investigation.Previous population-based research has demonstrated race/ethnic differences in the seroprevalence of herpes viruses, with U.S.blacks more likely to be seropositive for EBV, HSV-1, and CMV(Zajacova et al., 2009), but research on race/ethnic differences inherpersvirus antibody levels has been mixed. Blacks were found tohave significantly higher CMV levels compared to whites inNHANES III data, with no differences between Mexican-Americansand whites (Dowd and Aiello, 2009). A community-based studyfrom Texas found higher levels of HSV-1 antibodies in both blacksand Mexican-American adults, but no significant race/ethnic differences for EBV (Stowe et al., 2010). Recent national estimatesidentified higher levels of EBV antibodies in black children agedTable 4Linear regression of continuous logged EpsteineBarr Virus antibodies (AU/ml), Add Health Wave IV, weighted (n ¼ 11,050).Highest quartile lifetime stressful life eventsHighest quartile 12-month stressful life eventsCohen Perceived Stress Scale (ref ¼ low)MediumHighMaleCompleted education (ref ¼ college/above)Less than high schoolHigh schoolSome collegeIncome (ref¼ 87,000) 35,000 35,000e62,499 62,500e87,499Race/ethnicity (ref ¼ white)BlackHispanicAsianF-statistic(1)(2)b (SE)b (SE)(3)(4)(5)b (SE)b (SE)b (SE)0.010 (0.017) 0.009 (0.019) 0.123** (0.013)0.139** (0.019)0.026 (0.029) 0.030 (0.032)28.73 0.124** (0.014) 0.125** (0.014) 0.124** (0.014) 0.011 (0.019) 0.029 (0.020) 0.127** (0.014)0.035 (0.032)0.012 (0.024)0.013 (0.017)0.031 (0.033)0.010 (0.025)0.011 (0.017)0.037 (0.032)0.013 (0.025)0.013 (0.017)0.039 (0.032)0.015 (0.025)0.015 (0.017)0.009 (0.026)0.014 (0.022) 0.001 (0.020)0.008 (0.026)0.014 (0.022) 0.001 (0.020)0.010 (0.026)0.014 (0.022) 0.001 (0.020)0.015 (0.026)0.018 (0.022)0.001 (0.020)0.136** (0.019)0.024 (0.029) 0.025 (0.032)15.620.134** (0.019)0.024 (0.029) 0.025 (0.032)14.610.137** (0.020)0.025 (0.029) 0.026 (0.032)14.550.136** (0.019)0.024 (0.029) 0.023 (0.032)14.07**p 0.01, *p 0.05, þp 0.10.Notes: Robust confidence intervals in parentheses; models also control for "other" race, missing income, recent infection, BMI, household size, and age. Coefficients represent %change in EBV antibodies assoc
a CUNY School of Public Health, Hunter College, 2180 Third Avenue, New York, NY 10035, USA b CUNY Institute for Demographic Research (CIDR), One Bernard Baruch Way, New York, NY 10010, USA c Program in Public Health, Department of Preventive Medicine, Stony Brook University (SUNY), Health Sciences Center 3-071, Stony Brook, NY 11794, USA