Transcription
May 1, 2018Shareholder LetterQ1 2018Zendesk Shareholder Letter Q1 2018 - 1
Mikkel SvaneCEO 129.8MQ1 2018 Revenue38%Q1 Y/Y Revenue Growth125,000Paid Customer AccountsElena GomezCFOMarc CabiStrategy & IRIntroductionWe achieved a major milestone during the first quarter by surpassing a 500 million annual revenue run rate, making Zendesk the fastest-growingdedicated customer service and engagement platform. How did we getthere? By staying true to our origins while also growing entirely new areasof our business. We have extended our reach with small and midsizedorganizations, while also building our enterprise business—focused on largercompanies—which represents a significant part of our revenue today.We believe that our success in both areas is a reflection of the broad appealof our products. Over the four years since our IPO, our annual revenue runrate has grown at a compounded annual growth rate of 50% from the 100million that we reported in May 2014 to more than 500 million today. Wenow have more than 125,000 paid customer accounts that are using Zendeskto offer service and support in more than 30 languages.Note: All results and guidance in this letter are based on the new revenue recognition standard ASC 606.Zendesk Shareholder Letter Q1 2018 - 2
In the first quarter of 2018, we delivered 129.8 million in revenue, anand in growing the size of deals with larger customers. We view Zendeskincrease of 38% year over year. Our paid customer account growth in theSupport MRR coming from customers with 100 or more Support agents as afirst quarter was healthy at 23% year over year, and the dollar-based netproxy of our growth upmarket, and that metric ended the first quarter at 38%expansion rate for existing customers was 120%. Our growth was strongcompared to 34% a year ago.across both enterprise customers and small and midsized customers.Our omnichannel product development also advanced during the quarter.We expect continued growth in both areas throughout the year thanksWe integrated more channels in our Embeddables offering, and we saw moreto our focus on accelerating our push upmarket and further maturing ourcustomers of all sizes using multiple products. MRR from customers with twoomnichannel offering. We are expanding our portfolio of products designedor more products grew more than 80% year over year. We believe we havefor larger organizations, while improving the effectiveness of our enterprisea particularly large opportunity to sell our omnichannel offering to small andsales teams and go-to-market efforts. In April, we introduced Zendesk Guidemidsized organizations that are seeking to better connect and manage all ofEnterprise—our artificial intelligence-powered self-service product for largertheir customer conversations.companies—and saw momentum both in attracting new enterprise customersFirst Quarter of 2018(in thousands, except per share data)Three months endedMarch 31,Revenue Gross profit129,791*As adjusted 90,735Gross marginOperating loss20172018GAAP results65,78169.9% (33,615)Net loss Net loss per share, basic and diluted93,88870.1% (25,261)(29,325) (25,081) (0.28) (0.26) 95,067 69,314 (2,994) (3,441)Operating margin-25.9%-26.9%Non-GAAP resultsNon-GAAP gross profitNon-GAAP gross marginNon-GAAP operating loss73.2%Non-GAAP operating margin*Adjusted to reflect the adoption of ASC 606.73.8%-2.3%-3.7%Non-GAAP net income (loss) 2,016 (3,261)Non-GAAP net income (loss) per share, basic and diluted 0.02 (0.03)Zendesk Shareholder Letter Q1 2018 - 3
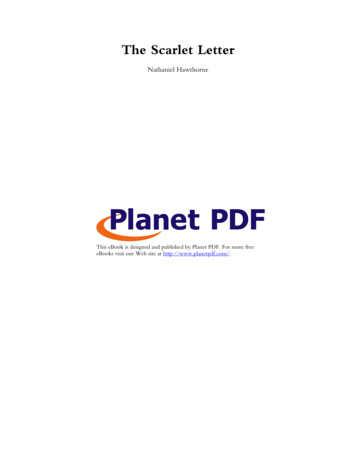
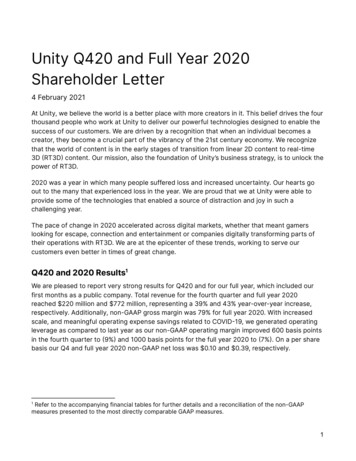
Enterprise MomentumWe continue to accelerate our push upmarket with investments inbroadening our go-to-market capabilities and evolving our products forFounded in 1966, Peet’s Coffee has more than 400more complex use cases. Given our solid growth in revenue during the firstretail locations and sells its specialty coffee and teaquarter and a healthy portfolio of larger customer opportunities, we believeproducts in more than 15,000 grocery stores in thewe are off to a strong start for 2018.United States. A Zendesk customer for three years,A big part of our go-to-market investments remains focused on hiring salesexpertise to pursue new opportunities with larger enterprises. In addition,we already serve a large population of enterprise companies in which wecan expand into new use cases. With a new SVP of worldwide sales inplace and a focus on sales team stability as we grow, we have seen positiveresults both in sales execution and productivity.Peet’s uses Zendesk for several internal teams—including IT, sales operations, and accounting—andmanages its online customer interactions withZendesk Support and Chat. In 2017, customerservice and internal teams solved almost 100,000tickets in Support. Thanks to Zendesk’s ease of use,Peet’s can easily roll out Zendesk to new teams toSupporting our efforts to increase success with enterprise customers, webe administered and managed by business users,have further expanded our capabilities in both pre-sales technical consultingwithout burdening its IT team.as well as a broader set of professional services. During the first quarter of2018, our revenue from professional services continued to grow at a fasterProducts Usedrate than overall revenue growth, although professional services revenueremains less than 5% of our total revenue.Zendesk Shareholder Letter Q1 2018 - 4
Zendesk Guide and Artificial Intelligence (AI)As part of our enterprise expansion initiatives, we have focused on enhancing our family of productswith capabilities and features aimed at larger organizations and complex use cases. In April, welaunched our third enterprise-focused product in the past nine months: Guide Enterprise, which joinsChat Enterprise and Talk Enterprise. Guide Enterprise helps our largest customers identify knowledgegaps in customer service content and collaborate more easily across their extended teams.With Guide Enterprise, we released our newest AI-powered feature: Content Cues, which worksin conjunction with Answer Bot to help businesses create robust self-service experiences. WhileAnswer Bot automates responses to customers, the Content Cues algorithm reviews questions fromcustomers and existing help center articles to suggest topics that are missing or need improvement.With this guidance, content teams can be more proactive and efficient in optimizing the quality andcomprehensiveness of their help center content.Guide Enterprise’s advanced workflow and approvals feature, called Team Publishing, makes iteasy for large organizations to collaborate on knowledge base content by getting their agents andteam members more involved in the process. Customers found that Team Publishing increased thepercentage of support agents who contribute to their organization’s knowledge base by approximatelythree times.Zendesk Shareholder Letter Q1 2018 - 5
Omnichannel UpdateDelivering true omnichannel capabilities to our small and midsized customersStanley Black & Decker is a Fortune 500 company andleading provider of tools and storage, commercialelectronic security solutions, and engineeredis a priority in 2018. Our expanded omnichannel approach delivers additionalvalue to our customers, promotes higher engagement across our productportfolio, and is expected to improve our customer retention and expansion.fastening systems. Within three weeks of signing offAs part of our goal to mature our omnichannel offering, we introducedon a multiproduct deployment that includes Zendeskadditional features in the first quarter that integrate more channels into theSupport, Guide, Chat, and Talk, the globally distributedcustomer experience and provide greater visibility into performance metricsStanley Black & Decker support teams were up andacross channels.running on all channels after only a single day oftraining, thanks to help from the Zendesk ProfessionalServices team. Agents support customers in English,Spanish, Portuguese, and Turkish, and the companyplans to add additional language support in the comingmonths. The company has integrated more than 50Facebook pages into Support and implemented theWeb Widget on its support pages.Part of our Embeddables offering, the Web Widget delivers support directlywithin any web page. We added Zendesk Talk to the widget with the limitedavailability feature Request a Callback, so customers can click to receive aphone call from an agent. When the feature becomes generally available,our customers using our Support, Talk, Chat, and Guide products will beable to integrate email, phone, live chat, and self-service support all in thesame online experience for their customers. Additionally, we launched abeta application called Omnichannel Dashboard that provides consolidatedaccess to real-time performance monitoring across channels.Implementation Time3 weeksCSAT90%Products UsedZendesk Shareholder Letter Q1 2018 - 6
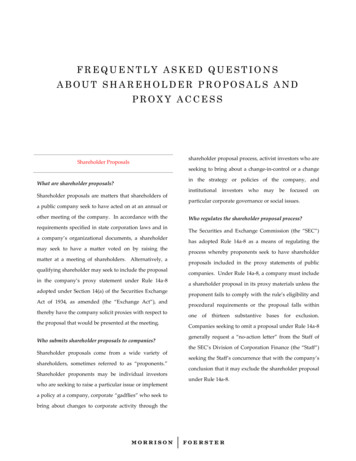
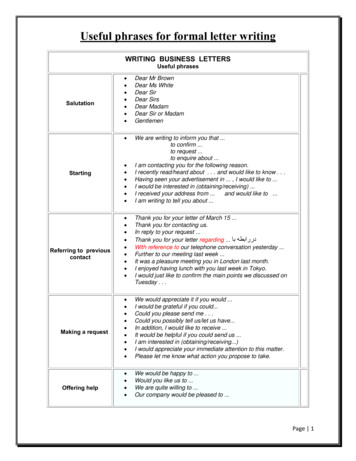
TimelinePaid customer accountsEmployee countTimeline not to scale.Zendesk Shareholder Letter Q1 2018 - 7
Infrastructure InvestmentsOur transition from co-located data centers to cloud infrastructure isprogressing as planned. Throughout 2017, we made investments to ensureeach of our customers has a successful outcome as they are transitionedto cloud infrastructure. As of the end of the first quarter of 2018, we havemoved nearly 75% of our customers to Amazon Web Services. We anticipatecompleting the full transition by the end of the fourth quarter of this year.Our investments in cloud services-based infrastructure ensure Zendeskmaintains flexibility and agility as it scales to meet the requirements of ourlargest customers.GDPRAs we prepare for the EU General Data Protection Regulation (GDPR) to takeeffect on May 25, 2018, we have continued to reap the benefits of our earlierdata privacy investments, including the approval of our binding corporaterules for data processors and data controllers and the certification of compliance with the EU-U.S. and Swiss-U.S. Privacy Shield Frameworks. In preparation for the GDPR, we have built upon these investments by increasing ourefforts to ensure that our products have the functionality necessary to allowEstablished in 1954, Relais & Châteaux is anassociation of more than 560 landmark hotels andrestaurants operated by independent innkeepers,chefs, and owners, who share a passion for theirbusinesses and a desire for authenticity in theirrelationships with their clientele. Last year, theysought a new partner to optimize their customerservice and operations. “We have a luxury image,and we absolutely wanted to improve the qualityof service of our call centers and to monitor eachrequest with a real, personalized answer,” explainsArnaud Wielgus, Chief Commercial and MarketingOfficer. “Zendesk will align us with the new digitalstandards of the industry.”Products Usedour customers to comply with the GDPR. Additionally, we have deliveredregional webinars for our customers, provided a detailed EU Data Protection microsite to explain the product features with which our customers cansupport their GDPR compliance programs, and developed extensive internaland external resources. Following the effective date of the GDPR, we lookforward to the continued opportunity to ensure that our customer base hasthe tools necessary within our products to serve their global end users.Zendesk Shareholder Letter Q1 2018 - 8
CustomersAmong the customers to join us or expand with us recently include:BreuningerA German department store selling clothing and premium household goodsEuro Car PartsA car parts and accessories distributor with 200 U.K. and Ireland locationsGlovoAn on-demand delivery service with couriers in Central and South Americaand EuropeGrabA Singapore-based ride sharing and logistics services companyHuobiA digital currency trading platform and exchange based in BeijingN Brown Group PlcAn online retailer offering clothing, footwear, and homewaresPeet’s CoffeeA California-based specialty coffee roaster and retailerRelais & ChâteauxA global association of individually owned and operated luxury hotels andrestaurantsStanley Black & DeckerA manufacturer of tools and hardware, and provider of security productsTrivagoOne of the world’s largest hotel price comparison sitesVorwerkA German-based distributor of household products and appliancesZendesk Shareholder Letter Q1 2018 - 9
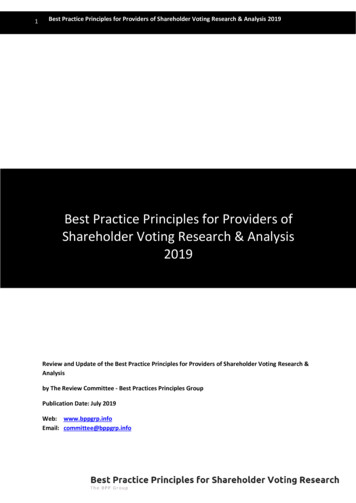
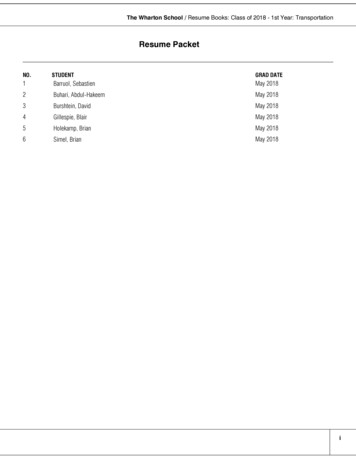
Operating MetricsA key metric we use to gauge our penetration% of total quarter-ending Support MRRfrom paid customer accounts with 100 Support agentswithin larger organizations is represented bythe percentage of Support MRR generated bycustomers with 100 or more Support agents. Thatpercentage remained strong at 38% at the end ofthe first quarter of 2018, compared to 38% at theend of the fourth quarter of 2017 and 34% at theend of the first quarter of 2017.As a proxy of our success with upmarketQ1 2018100 agents38%opportunities, we measure our number ofcontracts signed with an annual value of 50,000or greater. In the first quarter of 2018, the numberof these contracts we closed was over 60%greater than in the first quarter of 2017, while theaverage size of those transactions was larger ascompared to the same period last year.Our dollar-based net expansion rate, which weuse to quantify our annual expansion withinexisting customers, increased by one percentagepoint to end the first quarter at 120%, comparedto 119% at the end of the fourth quarter of 2017.Our dollar-based net expansion rate was 115%at the end of the first quarter of 2017. Consistentwith expectations in prior quarters, we expect ourdollar-based net expansion rate to remain in the110% - 120% range over the next several quarters.Zendesk Shareholder Letter Q1 2018 - 10
Corporate Social ResponsibiltyCorporate social responsibility (CSR) has long been animportant part of Zendesk’s culture and brand, and we believeit is gaining even more significance to our business. We viewCSR as a critical way to build greater empathy among ouremployees and increase their engagement both with ourcommunity and their work.We previously shared results of a study we sponsored withDrexel University, which found that our customer advocateswho volunteered at least once every two months were threetimes more likely to be rated in the top third of the companyfor empathy. We believe this result is significant because ofthe growing importance of empathy in business generally. Asautomation increases across industries, it is leading to an evenbigger expectation from customers that the companies they dobusiness with act more human than ever before. Meeting thisexpectation requires empathetic employees who are engagedwith one another and their work.Within our own company, we continue to see strong interest involunteerism among our employees and believe it helps bothengage and retain current employees while attracting newtalent. In the first quarter of 2018 alone, Zendesk employeesinvested more than 3,100 hours in community engagement andvolunteering through Zendesk programs.Zendesk Shareholder Letter Q1 2018 - 11
Select Financial Measures(in millions, except per share data)Three months endedMarch 31, 2018December 31, 2017March 31, 2017*As adjusted*As adjusted 121.9 93.9Up 6.5% q/q and 38.2% y/y largely due to a strong dollar-based netexpansion rate and growth in paid customer accountsDeclined 140 basis points (bps) q/q and 20 bps y/y largely due to additionalcosts to migrate customers from co-located data centers to cloudinfrastructureWe expect to incur up to approximately 100 bps of additional depreciationand related costs in each quarter until all customers have been transitionedCommentsGAAP resultsRevenueGross margin 129.869.9%71.3%70.1% (33.6) (26.9) (25.3)-25.9%-22.0%-26.9%Declined 390 bps q/q largely due to higher headcount and additonal coststo migrate customers from co-located data centers to cloud infrastructureImproved 100 bps y/y largely due to scale as revenue growth outpacedoperating expenses growthNon-GAAP gross margin73.2%74.2%73.8%Declined 100 bps q/q and 60 bps y/y largely due to additional costs tomigrate customers from co-located data centers to cloud infrastructureWe expect to incur up to approximately 100 bps of additional depreciationand related costs in each quarter until all customers have been transitionedNon-GAAP operating loss (3.0) (0.9) (3.4)-2.3%-0.7%-3.7% 16.2 17.3 7.3Free cash flow (non-GAAP) 7.1 12.0 0.6Cash and cash equivalents 609.2 109.4 109.3Marketable securities 250.5 235.0 206.8 29.2 24.5 20.9Amortization of purchased intangibles 0.7 0.7 0.9Acquisition-related expenses 0.7 0.7—Operating lossOperating marginNon-GAAP resultsNon-GAAP operating marginDeclined 160 bps q/q largely due to higher headcount and additonal coststo migrate customers from co-located data centers to cloud infrastructureImproved 140 bps y/y largely due to scale as revenue growth outpacedoperating expenses growthOther financial measuresNet cash provided by operating activitiesNet cash provided by operating activities, less purchases of property andequipment and internal-use software development costsIncreased largely due to issuance of 575 million in convertible seniornotes, offset by the cost of the capped call and issuance costsNon-GAAP results exclude the followingShare-based compensation and related expenses*Adjusted to reflect the adoption of ASC 606.*Quarter-over-quarter comparisons (q/q) are for the three months ended March 31, 2018, compared to the three months ended December 31, 2017.*Year-over-year comparisons (y/y) are for the three months ended March 31, 2018, compared to the three months ended March 31, 2017.Increased q/q and y/y largely due to higher headcount, higher share price,and timing of awardsZendesk Shareholder Letter Q1 2018 - 12
GuidanceWe have not reconciled free cash flow guidance to net cash from operatingFor the quarter ending June 30, 2018, we expect to report:the reconciling items between net cash from operating activities and free Revenue in the range of 136.0 - 138.0 million GAAP operating income (loss) in the range of (34.0) - (32.0) million,which includes share-based compensation and related expenses ofapproximately 30.7 million, amortization of purchased intangiblesof approximately 0.7 million, and acquisition-related expenses ofapproximately 0.6 million Non-GAAP operating income (loss) in the range of (2.0) - 0.0 million,which excludes share-based compensation and related expenses ofapproximately 30.7 million, amortization of purchased intangiblesof approximately 0.7 million, and acquisition-related expenses ofapproximately 0.6 millionactivities for the full year of 2018 because we do not provide guidance oncash flow as a result of the uncertainty regarding, and the potential variabilityof, these items. The actual amount of such reconciling items will have asignificant impact on our free cash flow and, accordingly, a reconciliation ofnet cash from operating activities to free cash flow for the full year of 2018 isnot available without unreasonable effort.Zendesk’s estimates of share-based compensation and related expenses,amortization of purchased intangibles, and acquisition-related expenses infuture periods assume, among other things, the occurrence of no additionalacquisitions, investments or restructurings, and no further revisions to sharebased compensation and related expenses. Approximately 105.2 million weighted average shares outstanding (basic) Approximately 109.9 million weighted average shares outstanding (diluted)For the full year 2018, we expect to report: Revenue in the range of 565.0 - 572.0 million GAAP operating income (loss) in the range of (132.0) - (127.0) million,which includes share-based compensation and related expenses ofapproximately 126.8 million, amortization of purchased intangibles ofapproximately 2.7 million, and acquisition-related expenses ofapproximately 2.5 million Non-GAAP operating income (loss) in the range of 0.0 - 5.0 million,which excludes share-based compensation and related expenses ofapproximately 126.8 million, amortization of purchased intangiblesof approximately 2.7 million, and acquisition-related expenses ofapproximately 2.5 million Approximately 106.0 million weighted average shares outstanding (basic) Approximately 111.8 million weighted average shares outstanding (diluted) Free cash flow in the range of 25.0 - 30.0 millionZendesk Shareholder Letter Q1 2018 - 13
Condensed consolidatedstatements of operations(In thousands, except pershare data; unaudited)Three months endedMarch 31,2018Revenue2017*As adjusted 129,791 93,888Cost of revenue39,05628,107Gross profit90,73565,781Research and development37,08526,456Sales and marketing65,05846,269General and ,261)Operating expenses:Total operating expensesOperating lossOther income, net1,000218Loss before provision for (benefit from) income taxes(32,615)(25,043)Provision for (benefit from) income taxes(3,290)38 (29,325) (25,081) (0.28) (0.26)103,69297,475Net lossNet loss per share, basic and dilutedWeighted-average shares used to compute net loss per share, basic and diluted*Adjusted to reflect the adoption of ASC 606.Zendesk Shareholder Letter Q1 2018 - 14
March 31, 2018Condensed consolidatedbalance sheets(In thousands, except parvalue; unaudited)AssetsDecember 31, 2017*As adjustedCurrent assets:Cash and cash equivalents 609,229 109,370Marketable securities128,751137,576Accounts receivable, net of allowance for doubtful accounts of 1,445 and 1,252 as of March 31, 2018 and December 31, 2017,respectively52,73857,096Deferred costs17,01015,771Prepaid expenses and other current assets29,41224,165Total current assets837,140343,978Marketable securities, noncurrent121,75497,447Property and equipment, net61,00059,15716,85115,39566,31667,034Deferred costs, noncurrentGoodwill and intangible assets, netOther assets9,4628,359Total assets 1,112,523 591,370Accounts payable 6,586 5,307Accrued liabilities37,63321,876Accrued compensation and related benefits33,14229,017183,936173,147Liabilities and stockholders’ equityCurrent liabilities:Deferred revenueTotal current 6,626711,870237,186Preferred stock, par value 0.01 per share——Common stock, par value 0.01 per 8)(398,043)400,653354,184 1,112,523 591,370Convertible senior notes, netDeferred revenue, noncurrentOther liabilitiesTotal liabilitiesStockholders’ equityAdditional paid-in capitalAccumulated other comprehensive lossAccumulated deficitTotal stockholders’ equityTotal liabilities and stockholders’ equity*Adjusted to reflect the adoption of ASC 606.Zendesk Shareholder Letter Q1 2018 - 15
Three months endedMarch 31,Condensed consolidatedstatements of cash flows(In thousands; unaudited)20182017*As adjustedCash flows from operating activitiesNet loss (29,325) s to reconcile net loss to net cash provided by operating activities:Depreciation and amortizationShare-based compensationAmortization of deferred costsAmortization of debt discount and issuance 2,524(2,596)6,70416,2427,282(6,808)(4,791)Changes in operating assets and liabilities:Accounts receivablePrepaid expenses and other current assetsDeferred costsOther assets and liabilitiesAccounts payableAccrued liabilitiesAccrued compensation and related benefitsDeferred revenueNet cash provided by operating activitiesCash flows from investing activitiesPurchases of property and equipmentInternal-use software development costs(2,344)(1,852)Purchases of marketable securities(78,321)(40,758)Proceeds from maturities of marketable securities55,26331,654Proceeds from sales of marketable securitiesNet cash used in investing activitiesCash flows from financing activitiesProceeds from issuance of convertible senior notes, net of issuance costs paid of 12,9376,982(25,228)8,602(7,145)562,063—Purchase of capped call related to convertible senior notes(63,940)—6,19311,6895,0963,844Proceeds from exercises of employee stock optionsProceeds from employee stock purchase planTaxes paid related to net share settlement of share-based awardsNet cash provided by financing activitiesEffect of exchange rate changes on cash, cash equivalents and restricted cashNet increase in cash, cash equivalents and restricted cashCash, cash equivalents and restricted cash at beginning of periodCash, cash equivalents and restricted cash at end of period*Adjusted to reflect the adoption of ASC 606 and ASU 4110,88895,062 610,545 110,776Zendesk Shareholder Letter Q1 2018 - 16
Non-GAAP results(In thousands, except pershare data)The following table showsZendesk’s GAAP resultsreconciled to non-GAAPresults included in this letter.Three months endedMarch 31,20182017*As adjustedReconciliation of gross profit and gross marginGAAP gross profit 90,735 65,7813,0982,104260169Plus: Amortization of purchased intangibles612830Plus: Amortization of share-based compensationcapitalized in internal-use software362430 95,067 69,31470%70%3%4%73%74% 37,085 26,456(10,231)(6,914)Less: Employer tax related to employee stock transactions(742)(548)Less: Acquisition-related expenses(384)— 25,728 18,994GAAP research and development as percentage of revenue29%28%Non-GAAP research and development as percentage of revenue20%20% 65,058 46,269(8,007)(5,524)(575)(367)Less: Amortization of purchased intangibles(110)(102)Less: Acquisition-related expenses(281)— 56,085 40,276GAAP sales and marketing as percentage of revenue50%49%Non-GAAP sales and marketing as percentage of revenue43%43%Plus: Share-based compensationPlus: Employer tax related to employee stock transactionsNon-GAAP gross profitGAAP gross marginNon-GAAP adjustmentsNon-GAAP gross marginReconciliation of operating expensesGAAP research and developmentLess: Share-based compensationNon-GAAP research and developmentGAAP sales and marketingLess: Share-based compensationLess: Employer tax related to employee stock transactionsNon-GAAP sales and marketing*Adjusted to reflect the adoption of ASC 606.Zendesk Shareholder Letter Q1 2018 - 17
(continued.)Three months endedMarch 31,Non-GAAP results(In thousands, except pershare data)The following table showsZendesk’s GAAP resultsreconciled to non-GAAPresults included in this letter.2018GAAP general and administrativeLess: Share-based compensation2017*As adjusted 22,207 18,317(5,652)(4,562)Less: Employer tax related to employee stock transactions(307)(270)Non-GAAP general and administrativeGAAP general and administrative as percentage of revenueNon-GAAP general and administrative as percentage of revenue 16,248 13,48517%13%20%14% (33,615) (25,261)26,98819,1041,8841,354Plus: Amortization of purchased intangibles722932Plus: Acquistion-related expenses665—Plus: Amortization of share-based compensation capitalized ininternal-use software362430 (2,994) (3,441)(26)%(27)%Non-GAAP adjustments24%23%Non-GAAP operating margin(2)%(4)% (29,325) (25,081)26,9881,88472219,1041,354932Reconciliation of operating loss and operating marginGAAP operating lossPlus: Share-based compensationPlus: Employer tax related to employee stock transactionsNon-GAAP operating lossGAAP operating marginReconciliation of net income (loss)GAAP net lossPlus: Share-based compensationPlus: Employer tax related to employee stock transactionsPlus: Amortization of purchased intangiblesPlus: Acquisition-related expenses665—Plus: Amortization of share-based compensation capitalized ininternal-use software362430Plus: Amortization of debt discount and issuance costs720— 2,016 (3,261)Non-GAAP net income (loss)*Adjusted to reflect the adoption of ASC 606.Zendesk Shareholder Letter Q1 2018 - 18
Three months endedMarch 31,(continued.)Non-GAAP results(In thousands, except pershare data)The following table showsZendesk’s GAAP resultsreconciled to non-GAAPresults includedin this letter.20182017*As adjustedReconciliation of net income (loss) per share, basicGAAP net loss per share, basic (0.28) (0.26)0.300.23 0.02 (0.03) (0.28) (0.26)0.300.23 0.02 397,475 16,242 7,282Non-GAAP adjustments to net lossNon-GAAP net income (loss) per share, basicReconciliation of net income (loss) per share, dilutedGAAP net loss per share, dilutedNon-GAAP adjustments to net lossNon-GAAP net income (loss) per share, dilutedWeighted-average shares used in GAAP per share calculation, basic and dilutedWeighted-average shares used in non-GAAP per share calculationComputation of free cash flowNet cash provided by operating activitiesLess: purchases of property and equipment(6,808)(4,791)Less: internal-use software development costs(2,344)(1,852) 7,090 639Free cash flow*Adjusted to reflect the adoption of ASC 606.Zendesk Shareholder Letter Q1 2018 - 19
About ZendeskThe best customer experiences are built with Zendesk. Zendesk’s powerful and flexiblecustomer service and engagement platform scales to meet the needs of any business,from startups and small businesses to growth companies and enterprises. Zendesk servesbusinesses across a multitude of industries, with more than 100,000 paid customer accountsoffering service and support in more than 30 languages. Headquartered in San Francisco,Zendesk operates worldwide with 15 offices in North America, Europe, Asia, Australia, andSouth America. Learn more at www.zendesk.com.About Non-GAAP Financial MeasuresForward-Looking StatementsShare-based Compensation and Amortization of Share-based Compensation Capitalizedin Internal-use Software: Zendesk utilizes share-based compensation to attract and retainemployees. It is principally aimed at aligning their interests with those of its stockholdersand at long-term retention, rather than to address operational performance for any particularper
Web Widget on its support pages. Implementation Time 3 weeks CSAT 90% Products Used Omnichannel Update Delivering true omnichannel capabilities to our small and midsized customers is a priority in 2018. Our expanded omnichannel approach delivers additional value to our customers, promotes higher engagement across our product