Transcription
Measuringchild labour, forcedlabour and humantrafficking inglobal supply chains:A global Input-OutputapproachTechnical Paperwww.Alliance87.orgAlliance8 7#Achieve87Ali ALSAMAWITihana BULEClaudia CAPPAHarry COOKClaire GALEZ-DAVISGady SAIOVICI
Copyright 2019 International Labour Organization, Organisation for Economic Co-operation and Development, International Organization for Migration, and United Nations Children’s FundThis is an open access work distributed under the Creative Commons Attribution-Non Commercial 3.0 IGO /3.0/igo/). Users can reuse, share, adapt and build upon the original worknon-commercially, as detailed in the License. The ILO, the OECD, IOM and UNICEF must be clearly credited as theowners of the original work. The use of the emblems of the ILO, the OECD, IOM and UNICEF are not permitted inconnection with users’ work.Attribution – The work must be cited as follows: Alsamawi et al (2019), Measuring child labour, forced labour and humantrafficking in global supply chains: A global Input-Output approach. International Labour Organization, Organisation forEconomic Co-operation and Development, International Organization for Migration and United Nations Children’s Fund.Translations – In case of a translation of this work, the following disclaimer must be added, in the language of thetranslation, along with the attribution: This translation was not created by the ILO, the OECD, IOM or UNICEF and shouldnot be considered an official translation of those Organizations. The ILO, the OECD, IOM and UNICEF are not responsiblefor the content or accuracy of this translation.Adaptations – In case of an adaptation of this work, the following disclaimer must be added along with the attribution:This is an adaptation of an original work by the ILO, the OECD, IOM and UNICEF. Responsibility for the views and opinionsexpressed in the adaptation rests solely with the author or authors of the adaptation and are not endorsed by the ILO, theOECD, IOM or UNICEF.ILO ISBN: 978-92-2031-429-6 (Print); 978-92-2031-430-2 (web PDF)IOM ISBN: 978-92-9068-814-3 (Print); 978-92-9068-815-0 (web PDF)This document is published under the responsibility of the Secretary-General of the OECD. The opinions expressed andarguments employed herein do not necessarily reflect the official views of OECD member countries. This document, aswell as any data and map included herein, are without prejudice to the status of or sovereignty over any territory, to thedelimitation of international frontiers and boundaries and to the name of any territory, city or area.The designations employed in this publication, which are in conformity with United Nations practice, and thepresentation of material therein do not imply the expression of any opinion whatsoever on the part of the ILO, IOM orUNICEF concerning the legal status of any country, area or territory or of its authorities, or concerning the delimitationof its frontiers.The responsibility for opinions expressed and arguments employed herein do not necessarily reflect the official views ofILO, IOM or UNICEF member countries, and publication does not constitute an endorsement by their respective Boardof Governors or the governments they represent.Reference to names of firms and commercial products and processes does not imply their endorsement by the ILO,the OECD, IOM or UNICEF, and any failure to mention a particular firm, commercial product or process is not a sign ofdisapproval.Neither the ILO, the OECD, IOM nor UNICEF guarantee the accuracy of the data included in this publication and acceptsno responsibility for any consequence of their use.Funding for this report is partly provided to the ILO by the United States Department of Labor under cooperativeagreement number IL‐30147‐16‐75‐K‐11 (MAP16 Project) (GLO/18/29/USA). Forty per cent of the total costs of thisreport is funded by the MAP16 project and financed with Federal funds, for a total of USD 61,000. One hundred percent of the total costs of the MAP16 project is financed with Federal funds, for a total of USD 22,400,000.This material does not necessarily reflect the views or policies of the United States Department of Labor nor doesmention of trade names, commercial products, or organizations imply endorsement by the United States Government.
IIITABLE OF CONTENTSFOREWORD. . . . . . . . . . . . . . . . . . . . . . . . . . . . . . . . . . . . . . . . . . . . . . . . . . . . . . . . . . . . . . . . . . . . . . . . . . . . VINTRODUCTION . . . . . . . . . . . . . . . . . . . . . . . . . . . . . . . . . . . . . . . . . . . . . . . . . . . . . . . . . . . . . . . . . . . . . . . 1RATIONALE BEHIND USING THE GLOBAL INPUT-OUTPUT APPROACH . . . . . . . . . . . . . . . . . . . . . . 2PART 1: DEFINITIONS AND DATA SOURCES. . . . . . . . . . . . . . . . . . . . . . . . . . . . . . . . . . . . . . . . . . . . . . . 41.11.21.3OECD Inter-Country Input-Output Tables. . . . . . . . . . . . . . . . . . . . . . . . . . . . . . . . . . . . . . . . . . . 4Child labour. . . . . . . . . . . . . . . . . . . . . . . . . . . . . . . . . . . . . . . . . . . . . . . . . . . . . . . . . . . . . . . . . . . 8Trafficking for forced labour. . . . . . . . . . . . . . . . . . . . . . . . . . . . . . . . . . . . . . . . . . . . . . . . . . . . . 10PART 2: COMBINING THE DATASETS. . . . . . . . . . . . . . . . . . . . . . . . . . . . . . . . . . . . . . . . . . . . . . . . . . . . 122.1From data sources to estimates. . . . . . . . . . . . . . . . . . . . . . . . . . . . . . . . . . . . . . . . . . . . . . . . . 122.2Assumptions and limitations. . . . . . . . . . . . . . . . . . . . . . . . . . . . . . . . . . . . . . . . . . . . . . . . . . . . 152.3Additional robustness tests. . . . . . . . . . . . . . . . . . . . . . . . . . . . . . . . . . . . . . . . . . . . . . . . . . . . . 17PART 3: RESULTS. . . . . . . . . . . . . . . . . . . . . . . . . . . . . . . . . . . . . . . . . . . . . . . . . . . . . . . . . . . . . . . . . . . . . . . 193.1Child labour . . . . . . . . . . . . . . . . . . . . . . . . . . . . . . . . . . . . . . . . . . . . . . . . . . . . . . . . . . . . . . . . . 193.2Trafficking for forced labour. . . . . . . . . . . . . . . . . . . . . . . . . . . . . . . . . . . . . . . . . . . . . . . . . . . . . 22CONCLUSIONS. . . . . . . . . . . . . . . . . . . . . . . . . . . . . . . . . . . . . . . . . . . . . . . . . . . . . . . . . . . . . . . . . . . . . . . 24BIBLIOGRAPHY. . . . . . . . . . . . . . . . . . . . . . . . . . . . . . . . . . . . . . . . . . . . . . . . . . . . . . . . . . . . . . . . . . . . . . . . 25ANNEXES. . . . . . . . . . . . . . . . . . . . . . . . . . . . . . . . . . . . . . . . . . . . . . . . . . . . . . . . . . . . . . . . . . . . . . . . . . . . . 27Annex 1. OECD – ICIO 2018 geographical coverage and industry list. . . . . . . . . . . . . . . . . . . . . . . . 27Annex 2. List of regions, country coverage, and target population coverage. . . . . . . . . . . . . . . . . . 29A. Regional groupings, following the United Nations Statistical Division’s StandardCountry or Area Codes for Statistical Use (M49). . . . . . . . . . . . . . . . . . . . . . . . . . . . . . . . . 29B. List of countries used as underlying data for regional estimates. . . . . . . . . . . . . . . . . . . . 32C. Sources of survey data for child labour . . . . . . . . . . . . . . . . . . . . . . . . . . . . . . . . . . . . . . . . 33D. Coverage in terms of target population. . . . . . . . . . . . . . . . . . . . . . . . . . . . . . . . . . . . . . . . . 34
IVTABLE OF FIGURESFigure 1: Symmetric Input-Output table framework. . . . . . . . . . . . . . . . . . . . . . . . . . . . . . . . . . . . . . . . . . . 4Figure 2: Inter-Country Input-Output Framework. . . . . . . . . . . . . . . . . . . . . . . . . . . . . . . . . . . . . . . . . . . . . 6Figure 3: Schematic representation of the concepts of direct and indirect. . . . . . . . . . . . . . . . . . . . . . . . 7Figure 4: From data sources to model estimates. . . . . . . . . . . . . . . . . . . . . . . . . . . . . . . . . . . . . . . . . . . . . 13Figure 5: Estimates of child labour for exported goods and services and domestic demand,by region, by different industry aggregates (2015). . . . . . . . . . . . . . . . . . . . . . . . . . . . . . . . . . . . . . . . . . . 16Figure 6: Comparison of CL linked for exports between ICIO, more detailed national IO,and regional national IO datasets – Brazil (2011). . . . . . . . . . . . . . . . . . . . . . . . . . . . . . . . . . . . . . . . . . . . 18Figure 7: Estimates of child labour and value added for exported goods and services,and domestic demand, by region (2015). . . . . . . . . . . . . . . . . . . . . . . . . . . . . . . . . . . . . . . . . . . . . . . . . . . 20Figure 8: Estimates of child labour for exported goods and services, direct and indirect,by region (2015). . . . . . . . . . . . . . . . . . . . . . . . . . . . . . . . . . . . . . . . . . . . . . . . . . . . . . . . . . . . . . . . . . . . . . . 21Figure 9: Estimates of trafficking for forced labour and value added for exported goodsand services, by region (2015). . . . . . . . . . . . . . . . . . . . . . . . . . . . . . . . . . . . . . . . . . . . . . . . . . . . . . . . . . . 22Figure 10: Estimated trafficking for forced labour and value added for exported goodsand services, direct and indirect, by region (2015). . . . . . . . . . . . . . . . . . . . . . . . . . . . . . . . . . . . . . . . . . . 23
VFOREWORDThis technical paper accompanies the report on Ending child labour, forced labour and humantrafficking in global supply chains jointly prepared by the ILO, OECD, IOM and UNICEF as a productof the Alliance 8.7 Action Group on Supply Chains (hereafter the Alliance 8.7 Report). The Alliance 8.7Report responds to the Ministerial Declaration of the July 2017 meeting of the Group of Twenty (G20)Labour and Employment Ministers, asking “the International Organisations in cooperation with theAlliance 8.7 for a joint report containing proposals on how to accelerate action to eliminate the worstforms of child labour, forced labour and modern slavery in global supply chains including identifyinghigh risk sectors, and how to support capacity building in the countries most affected”. It alsoresponds to the Buenos Aires Declaration on Child Labour, Forced Labour and Youth Employment,November 2017, which called for “research on child labour and forced labour and their root causes( ) pay[ing] particular attention to supply chains”.According to the 2016 ILO global estimates, there are a total of 152 million children in child labourand 25 million children and adults in forced labour in the world today. Governments, business, thefinancial sector and civil society must take strong action to address the root causes and determinantsof these human rights violations. The Alliance 8.7 Report and this technical working paper are acontribution to these efforts.The authors would like to thank Colin Webb (OECD), Antoine Bonnet and Manpreet Singh (ILO), andEileen Capilit (Independent Consultant) for their contributions and data support.
VIMeasuring child labour, forced labour and human trafficking in global supply chains: A global Input-Output approach
1INTRODUCTIONThis technical paper explains in detail the methodology and datasets used to produce the resultspublished in Chapter 1 of the Alliance 8.7 Report on Ending Child Labour, Forced Labour andHuman Trafficking in Global Supply Chains on how child labour, forced labour and human traffickingare linked with global supply chains. It is a result of a collaboration between OECD, ILO, IOM andUNICEF. This technical paper is also the first output of joint research and collaboration between theOECD Directorate for Financial and Enterprise Affairs (DAF) and the OECD Directorate for Science,Technology and Innovation (STI) on impacts of responsible business conduct (RBC) in global valuechains, which falls under the DAF work stream on RBC and the STI work stream on the applicationthe 2018 Inter-Country Input-Output (ICIO) infrastructure beyond Trade in Value Added database.The social and environmental impact of firm participation in global supply chains is an area ofincreasing policy interest. On the one hand, global supply chains (GSCs) have the potential to generategrowth, employment, skill development and technological transfer. On the other hand, decent workdeficits (including child labour, forced labour and human trafficking) have been linked to economicactivity supported by GSCs. The complexity and interconnectedness in the global markets presents achallenge for conventional statistics and accounting methods. For example, tracing back the originsof a final product or even its components requires capturing statistics not only in the market wherethe product is “consumed”, but also along its supply chain. Many times, such statistics – if they existat all – are full of gaps.While developing a consistent quantitative means of tracing social and environmental impacts inGSCs is very challenging, certain aspects can and have been measured. For example, analysis ofCO2 emissions in the context of GSCs has already been integrated in the OECD Trade in Value-Added(TiVA) database.1 Similar methodology has also been applied to understand the role of skills incountries’ comparative advantage and industry performance in global value chains (see Grundke etal., 2017). When it comes to labour, ILO and the OECD have estimated labour content in trade (OECD,2019a; Kizu et al, 2016) and share of jobs associated with global production. The basis for all thisresearch are the Input-Output (IO) tables.1For example, CO2 embodied in foreign demand. See: http://oe.cd/io-co2.
2Measuring child labour, forced labour and human trafficking in global supply chains: A global Input-Output approachRATIONALE BEHIND USING THE GLOBALINPUT-OUTPUT APPROACHThe basis for the research in this technical paper are the OECD Inter-Country Input Output (ICIO)tables, the datasets from ILO, UNICEF and IOM on employment, child labour and human trafficking,and the results from the 2016 Global Estimates on Modern Slavery. IO tables are commonly used bynational statistical offices to describe the relationship between producers and consumers within aneconomy at an industry level. They account for final and intermediate goods and services, allowingstatisticians to identify and isolate the direct and indirect impact of, for instance, a specific industryinto the whole economy. Several initiatives at the international level, including the OECD ICIO tables,2have aimed to expand these tables to also analyse interdependencies between countries. Theseexpanded datasets have provided researchers with tools to analyse several aspects of internationaltrade and its impacts. Of particular relevance to this technical paper are attempts in literature to useglobal IO models to estimate the impact of international trade on social indicators, including countryspecific analysis on child labour (see for example Alsamawi et al., 2017; Gomez-Paredes et al.,2016). This paper is a contribution to those and the aforementioned efforts on environmental andeconomic analyses.Child labour standards, definitions and tools related to collection of child labour data are nowadayswell-established statistical areas. In 1998, the Statistical Information and Monitoring Programme onChild labour (SIMPOC) was created at the ILO to improve gathering of statistical data on child labour.In 2008, the International Conference of Labour Statisticians (ICLS) adopted a resolution formalisingthe international criteria to measure child labour (ILO, 2008), in line with the ILO Conventions.3Many countries include child labour data collection in their national statistical systems’ activities,for example through expanded age groups in labour force surveys (covering not only adults, but alsochildren aged 5 years and older) or by including child labour modules in generic household or labourforce surveys; others conduct ad-hoc national child labour surveys, many of which have been fundedthrough technical co-operation projects. Every 4 years, the ILO publishes global estimates of childlabour. The most recent estimates indicate that 152 million children were in this situation in 2016.Data on child labour are also collected at regular intervals as part of the Multiple Indicator ClusterSurvey (MICS) programme, which was developed by UNICEF in mid-nineties to assist countries incollecting data on a numbers of wellbeing indicators for children and their families. Data on childlabour have been collected in MICS since 2000 in close to 150 surveys through a standard modulequestionnaire. The MICS module covers children 5 to 17 years old and includes questions on thetype of work a child does and the number of hours he or she is engaged in it. Every year, UNICEFpublishes global, regional and country-level estimates of child labour in its flagship publication, TheState of the World’s Children.When it comes to forced labour, measurement of forced labour is a relatively new statistical area.After about 15 years of pilot studies to measure the prevalence and characteristics of forced labour indifferent contexts or using different techniques, in 2018, the ICLS endorsed Guidelines to measureforced labour (ILO, 2018a). They reflect a framework to statistically measure the legal concept of ILOConvention 29. Forced labour is a rare statistical event, which often requires special (over)samplingtechniques to reach a representative sample size to obtain robust statistical figures. Every 4 years theILO publishes global estimates of forced labour. In 2017, jointly with the Walk Free Foundation and2More information about the OECD-ICIO, the full dataset, and methodology notes is available at http://oe.cd/icio.3 The Resolution concerning measurement of child labour has been amended in 2018 to take into account the new statisticaldefinitions on work and employment.
RATIONALE BEHIND USING THE GLOBAL IO APPROACHIOM, estimates of modern slavery (including forced marriage) were published – this extended conceptof modern slavery is out of the scope of this paper. According to the Global Estimates of ModernSlavery, on any given day in 2016, 25 million people were in forced labour in the world (ILO and WalkFree Foundation, 2017). Similarly, the measurement of human trafficking for forced labour is an areaof ongoing efforts. In particular, the ILO, UNODC and IOM are working together on the development ofjoint survey tools to study and estimate the prevalence of trafficking for forced labour at both nationaland sectoral levels. This will lead to better statistical data allowing for deeper analysis of forced labourand trafficking in global supply chains.There are currently no global or regional estimates of the prevalence of human trafficking. Relativelyfew examples of estimates related to human trafficking exist (IOM, 2018). Having said that, the 2017Global Estimates of Modern Slavery estimated that out of the 40 million people that were victimsof modern slavery in 2016, approximately 25 million people were in forced labour, including 16million in forced labour in the private economy. Some national, but still experimental estimations,exist. For example, Multiple Systems Estimation (MSE) can be used to estimate the total numberof (unidentified and identified) victims of trafficking at country level. MSE is a method based onthe analysis of multiple lists of human trafficking cases provided by different actors in the countertrafficking field, such as NGOs, law enforcement, international organizations and other authorities.Currently, this method cannot be applied globally. However, researchers are developing the methodestimate that could potentially be used to cover approximately 50 countries around the world. Initialestimates are already available in several countries, including the UK and the Netherlands (UNODC,2016). Finally, some sectoral estimates of human trafficking also exist using Respondent-DrivenSampling (RDS).4 While these are still limited, there is increasing evidence that using RDS in multiplewaves could bring more insight and come closer to more representative-like study results.Relating child labour, forced labour and human trafficking figures to global supply chains is a separateand significant challenge. A growing number of mixed methods (using both qualitative and quantitativeapproaches) and sectoral surveys are providing valuable insights into how these phenomena areinvolved in the global economy. Some businesses are also contributing to such insights, as they mapthe labour violation risks they are exposed to in the context of their human rights or social impactassessments and transparency efforts. Nevertheless, the scope of these efforts has mostly beenrestricted to identifying child labour, forced labour or human trafficking in the production of goodsand services of particular industries or in their main suppliers. These methods may miss collectinginformation on workers that are not in the immediate supply chain - for example, upstream suppliersof intermediate goods. Additionally, due to the complexity of global production networks, quantitativeaccounting of these relationships is not straightforward.This technical paper describes the joint effort undertaken by the OECD, ILO, IOM and UNICEF tocontribute to the body of work that can help fill this gap. It is the first application of the IO approachby international organisations as related to implementation of responsible business conduct principlesand standards and decent work deficits. This is the first time that datasets from the OECD, ILO, IOMand UNICEF have been combined in this way, and the first time that this methodology has beenapplied in such a wide range of countries by international organisations. The paper is structured asfollows: PART 1 describes the definitions and data sources used; PART 2 describes how the datasetswere combined and the additional tests that were undertaken to probe the impacts assumptions andlimitations; and PART 3 gives an overview of the results.4See for instance illegal gold mining in South America (Verité, 2016) and fishing in South-Eastern Asia (IOM, 2016).3
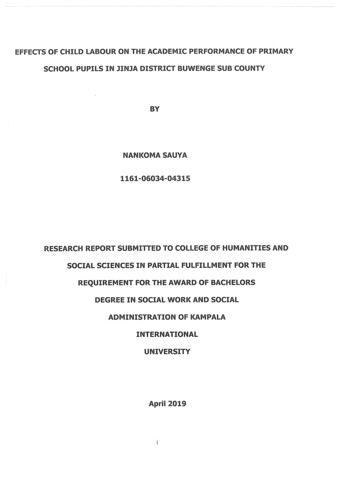
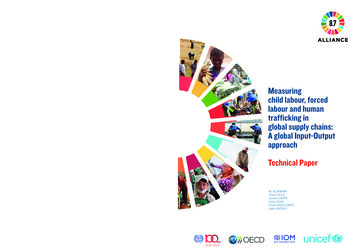
4Measuring child labour, forced labour and human trafficking in global supply chains: A global Input-Output approachPART 1: DEFINITIONS AND DATA SOURCES1.1 OECD INTER-COUNTRY INPUT-OUTPUT TABLESWassily Leontief developed the first Input-Output (IO) table for the US economy in the 1930s andinvestigated the extension of the IO work to interregional analysis in 1953. He won the Nobel Prizefor Economics in 1973 for his work on IOs. IO techniques have been used in literature in variousapplications since then, particularly in recent years (e.g. water, see Feng et al. 2011; materials, seeWiedmann et al. 2013; CO2, see Hertwich and Peters 2009; net primary production, see Haberl etal, 2007; employment, see Alsamawi, Murray and Lenzen, 2014).The most significant feature of the IO model lies in the fact that it allows statisticians to identifyand isolate the direct and indirect impact of a specific industry into the whole economy. IO tables ingeneral consist of three main parts:1. intermediate demand (Z) which describes, in monetary terms, the intermediate flows of goodsand services within an economy;52. final demand (F) which shows the purchases of final goods and services by households andgovernment as well as information about gross fixed capital formation, changes in inventories,and exports; and63. value added (V) which includes information about value-added by each industry and itscomponents, e.g. compensation of employees, gross operating surplus, and other taxes onproduction (See FIGURE 1).FIGURE 1: SYMMETRIC INPUT-OUTPUT TABLE FRAMEWORKINTERMEDIATE DEMANDIndustry 1 Industry 36FINAL EXPENDITUREFinalconsumptionand capitalformationExportscross-borderIndustry 1Intermediate matrix Industry 36Taxes less subsidies onintermediate and finalproductsTotal intermediate / finalexpenditureValue-addedof which, compensation ofemployeesof which, other net taxes onproductionof which, gross operationsurplusValue added matrixOutput (total production)5See: https://stats.oecd.org/glossary/detail.asp?ID 1431.6See: https://stats.oecd.org/glossary/detail.asp?ID 5526.Final demand matrixDirectpurchasesby non- residentsOUTPUT
DEFINITIONS AND DATA SOURCESHowever, national IO tables give an incomplete picture of the global economy. Questions relatedto who is boosting exports or who is the final consumer of domestic production are not possible toanswer by looking only at the IO tables, which are country specific.The OECD-ICIO tables attempt at resolving this issue. In simple terms, the OECD-ICIO tables canbe considered “a global IO table”. They harmonize a number of national IO tables, reinforced andcomplemented with additional data sources7. They are built based on statistics compiled according tothe 2008 System of National Accounts (SNA 2008) from national, regional and international sourcesand use an industry list based on the International Standard Industrial Classification (ISIC) Revision 4.The latest edition of the tables (2018) is used for the purposes of this report. The published tablesprovide detailed data for 64 economies,8 including all OECD, EU28 and G20 countries, most East andSouth-east Asian economies and a selection of South American countries. The edition also includes acategory called Rest of the World. ANNEX 1 indicates the full list. Additionally, the authors have usedadditional unpublished data that cover a total of 198 economies in order to expand the analysis in thistechnical paper and the Alliance 8.7 Report. Thirty-six unique9 and harmonised industrial sectors arerepresented within the hierarchy, including aggregates for total manufactures and total services, asshown in ANNEX 1. The 2018 edition covers the period 2005 to 2015, with preliminary projectionsto 2016 for some indicators. For this paper, ICIO tables for the year 2015 have been used.Other examples of currently available ICIO databases include: EORA, EXIOBASE, IDE-JETRO, andWIOD. Each of these tables has a different time series, industry details and country coverage. Thechoice of OECD-ICIO tables for this analysis is based on their acceptance and validation by OECDmember countries, expectation to maintain the datasets and methodologies in the long-term, andstrong institutional links with national statistics offices; and finally the availability of cross-borderexports and direct purchases by non-residents shown separately.The ICIO structure is similar to that of the national IO tables. The Z matrix or intermediate demandmatrix of an ICIO (N x N dimensions, where N is the number of industries/products) hold themonetary flows of intermediate goods and services with an element Z i,j,c from supplying sectori, i 1 N, into a using sector j, j 1 N, and for country c. The F matrix (N x M dimensions, whereM is the number of final demand categories) holds information on private (Households and Non-ProfitInstitutions Serving Households, NPISH) and public consumption (government consumption), grossfixed capital formation (GFCF), changes in inventory, and exports of final goods and services, fordomestic and foreign final demands with an element F i,c,l,k from supplying sector i, i 1 N incountry c into final demand categories k, k 1 M and a foreign final demand country l , where c l. Finally, the V matrix or primary input matrix (S x N dimensions, S being the number of primaryinput categories) holds information on value added and output (total production) with elements Vj,cand X j,c respectively (see FIGURE 2).7 Complementary data sources include international bilateral trade statistics, tourism satellite accounts and other nationalaccounts constraints.8See: ons.pdf.9See: http://stats.oecd.org/wbos/fileview2.aspx?IDFile c0787cf5-ec31-4130-8ddf-8667773e66ed.5
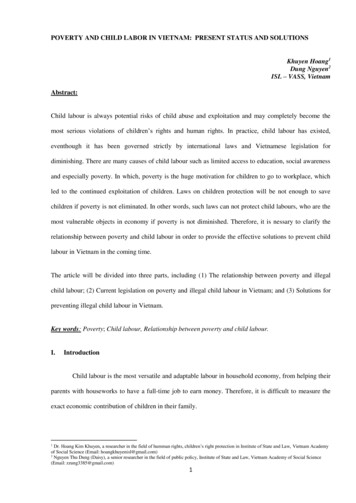
6Measuring child labour, forced labour and human trafficking in global supply chains: A global Input-Output approachFIGURE 2: INTER-COUNTRY INPUT-OUTPUT FRAMEWORKFINAL CONSUMPTIONAND CAPITALFORMATIONINTERMEDIATE DEMANDCou AInd1Cou ACou BCou CInd2Cou BInd1Ind2DIRECT PURCHASESBY NON-RESIDENTSOUTPUTCou CInd1Ind2Cou ACou BCou CCou ACou BCou CInd 1Ind 2Ind 1Ind 2Ind 1Ind 2Taxes less subsidies . on intermediate products. on final productsValue-addedOutputKey:Cross-border flows of intermediate goods and servicesDomestic flows of intermediate goods and servicesCross-border flows of final goods and servicesDomestic flows of final goods and servicesNote: Taxes less subsidies on products are not part of the value added. Value added covers labour compensations, capital andother taxes less subsides on productions. White areas in the direct purchases block refer to zero elements.In other words, the ICIO tables describe flows of intermediate and final goods and services amongcountries in monetary terms, hence allowing inter-industry and inter-country transactions to berecorded and analysed. This global interconnectedness captured by the ICIO tables means that thedownstream use of an industry’s output by other industries, be they domestic or foreign, can beidentified. Equally, ICIO tables can identify the inputs required for a particular industry from homeor abroad. In other words, the ICIO tables allow for estimating how much input is required by eachindustry per unit of total output which is consumed either domestically or exported. For example, anincrease in food processing supply may lead to an increase in demand for agricultural products, whichin turn requires inputs from other upstream industries (e.g. electricity, fuel and chemical products).Through ICIO, all the total requirements needed to produce a product (both direct and indirect) canbe de
specific analysis on child labour (see for example Alsamawi , 2017; Gomez-Paredes , et al.et al. 2016). This paper is a contribution to those and the aforementioned efforts on environmental and economic analyses. Child labour standards, definitions and tools related to collection of child labour data are nowadays