Transcription
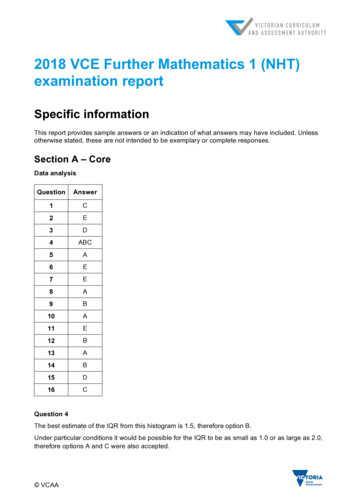
2018 VCE Further Mathematics 1 (NHT)examination reportSpecific informationThis report provides sample answers or an indication of what answers may have included. Unlessotherwise stated, these are not intended to be exemplary or complete responses.Section A – CoreData B13A14B15D16CQuestion 4The best estimate of the IQR from this histogram is 1.5, therefore option B.Under particular conditions it would be possible for the IQR to be as small as 1.0 or as large as 2.0,therefore options A and C were also accepted. VCAA
2018 VCE Further Mathematics Exam 1 (NHT) examination reportQuestion 11Irregular fluctuations are a feature of all time series plots.Question 16The monthly average needs to be calculated firstly asThe seasonal index for May will then be1113 92.751254 0.5892.75Recursion and financial stion 23Writing as a recurrence relation,V0 85000, Vn 1 601960193.8Vn 1500 (where 1 )600060001200From a table of values V6 95 699.39Question 24Total paid by Indira over the two years 12 425 12 500 11100The future value of the loan after two years using a finance solver 24 715 , to the nearest dollar.The reduction in the amount owed by Indira 29 000 24 715 4285The interest paid by Indira 11 100 4285 6815 VCAAPage 2
2018 VCE Further Mathematics Exam 1 (NHT) examination reportModule 1 – MatricesQuestionAnswer1C2B3D4A5C6C7A8AQuestion 7The number of customers not expected to change their rating is0.2 40 0.3 110 0.3 50 56The percentage of customers not expected to change their rating is56 100 28%200Question 8! 49.15 #&The steady state matrix is # 91.52 & , with values rounded to two decimal places.# 59.32 &"%The proportion of the excellent group changing to good each month is 0.50.5 59.32 29.66Module 2 – Networks and decision mathematicsQuestionAnswer1E2B3B4D5E6C7B8D VCAAPage 3
2018 VCE Further Mathematics Exam 1 (NHT) examination reportModule 3 – Geometry and measurementQuestionAnswer1A2C3E4B5D6D7C8EModule 4 – Graphs and relationsQuestionAnswer1B2A3D4B5C6E7B8EQuestion 2From the step graph, the price of a roasted chicken five hours after cooking is 9.The reduction from the full price is 12 9 3 .Question 7Consider firstly a ratio of three pears to five apples:x:y3:5As an equalityy 55x y x 33As an inequality ‘at least’ is represented by Therefore y VCAA5x3Page 4
2018 VCE Further Mathematics Exam 1 (NHT) examination reportQuestion 8Using the sliding-line method, the slope of the objective function Z is 5.2As shown in the diagram of the correct option E, a dotted line is drawn with this slope.As the coefficients of x and y in the objective function are both positive, the first point reached bythe sliding line is the minimum.In both options A and B, the minimum can occur at point P but can also occur at all points alongthe line segment that connects P to the y-intercept. In each case, this line segment is parallel to theobjective function and so options A and B are both incorrect. VCAAPage 5
2018 VCE Further Mathematics Exam 1 (NHT) examination report VCAA Page 2 Question 11 Irregular fluctuations are a feature of all time series plots.
