Transcription
Annual Report –Baird FundsDecember 31, 2017Baird MidCap FundBaird Small/Mid Cap Value FundBaird SmallCap Value FundChautauqua International Growth FundChautauqua Global Growth FundGo Green.Go Paperless.Sign up to receive your Baird Funds’ prospectuses and reports online.
Table of ContentsLetter to Shareholders . . . . . . . . . . . . . . . . . . . . . . . . . . . . . . . . . . . . . . . . . . . . . . . . . . . . .Baird MidCap Fund . . . . . . . . . . . . . . . . . . . . . . . . . . . . . . . . . . . . . . . . . . . . . . . . . . . . . . . .Baird Small/Mid Cap Value Fund . . . . . . . . . . . . . . . . . . . . . . . . . . . . . . . . . . . . . . . . . . .Baird SmallCap Value Fund . . . . . . . . . . . . . . . . . . . . . . . . . . . . . . . . . . . . . . . . . . . . . . . .Chautauqua International Growth Fund . . . . . . . . . . . . . . . . . . . . . . . . . . . . . . . . . . . .Chautauqua Global Growth Fund . . . . . . . . . . . . . . . . . . . . . . . . . . . . . . . . . . . . . . . . . .Additional Information on Fund Expenses . . . . . . . . . . . . . . . . . . . . . . . . . . . . . . . . . .Statements of Assets and Liabilities . . . . . . . . . . . . . . . . . . . . . . . . . . . . . . . . . . . . . . . .Statements of Operations . . . . . . . . . . . . . . . . . . . . . . . . . . . . . . . . . . . . . . . . . . . . . . . . .Statements of Changes in Net Assets . . . . . . . . . . . . . . . . . . . . . . . . . . . . . . . . . . . . . .Financial Highlights . . . . . . . . . . . . . . . . . . . . . . . . . . . . . . . . . . . . . . . . . . . . . . . . . . . . . . .Notes to the Financial Statements . . . . . . . . . . . . . . . . . . . . . . . . . . . . . . . . . . . . . . . . .Report of Independent Registered Public Accounting Firm . . . . . . . . . . . . . . . . .Directors and Officers . . . . . . . . . . . . . . . . . . . . . . . . . . . . . . . . . . . . . . . . . . . . . . . . . . . . .Disclosure Regarding the Board of Directors’ Approval of the InvestmentAdvisory Agreement for Baird Equity Funds . . . . . . . . . . . . . . . . . . . . . . . . . . . . . . .Additional Information . . . . . . . . . . . . . . . . . . . . . . . . . . . . . . . . . . . . . . . . . . . . . . . . . . . .Privacy Notice . . . . . . . . . . . . . . . . . . . . . . . . . . . . . . . . . . . . . . . . . . . . . . . . . . . . . . . . . . . . .121120293746485052576778798285A-1This report has been prepared for shareholders and may be distributed to others only if preceded oraccompanied by a current prospectus.Cautionary Note on Analyses, Opinions and Outlooks: In this report we offer analyses and opinions on theperformance of individual securities, companies, industries, sectors, markets, interest rates and governmentalpolicies, including predictions, forecasts and outlooks regarding possible future events. These can generally beidentified as such because the context of the statements may include such words as “believe,” “should,” “will,”“expects,” “anticipates,” “hopes” and words of similar effect. These statements reflect the portfolio managers’good faith beliefs and judgments and involve risks and uncertainties, including the risk that the portfoliomanagers’ analyses, opinions and outlooks are or will prove to be inaccurate. It is inherently difficult tocorrectly assess and explain the performance of particular securities, sectors, markets, interest rate movements,governmental actions or general economic trends and conditions, and many unforeseen factors contribute tothe performance of Baird Funds. Investors are, therefore, cautioned not to place undue reliance on subjectivejudgments contained in this report.
Baird Funds1-866-442-2473www.bairdfunds.comMarch 1, 2018Dear Shareholder,2017 was a strong year for the equity markets with full-year stock market gains thestrongest since 2013. The consistency of returns was also something to note as thebroad equity market, measured by the S&P 500 Index, advanced each month of theyear – the first time in history. The Baird Equity Funds kept pace with the risingmarket with each of our funds outperforming their respective benchmarks for thecalendar year while continuing to focus on risk-adjusted returns for our clients overthe long-term.In this current environment, we are optimistic but ever vigilant. There are positiveindications with respect to the economy on a number of fronts; however, we also seechanges stirring that may increase stock volatility. Each of our independent teamshas a time-tested, risk-managed approach that has been honed over decades ofmanaging portfolios in various market environments. We focus on fundamentalresearch that favors quality and seeks to deliver long-term value added returns.We are mindful that we continue to operate in an elevated risk environment and arecommitted to judicious management of your assets. We never lose sight of the factthat our success rests on the trust you have placed in us to be effective stewards ofyour assets and we want to thank you for your continued investment in the BairdEquity Funds.Sincerely,Mary Ellen Stanek, CFAPresidentBaird FundsPage 1
Baird MidCap FundDecember 31, 2017 (Unaudited)Portfolio Managers’ CommentaryFor the year ended December 31, 2017, the Baird MidCap Fund Institutional Class posted a total return of26.88% as compared to a gain of 25.27% for the Russell Midcap Growth Index, the Fund’s benchmark index.Full-year stock market gains were the strongest since 2013, and the consistency of returns was something tonote as the broad equity market, measured by the S&P 500 Index, advanced each month of the year – the firsttime in history. Steady improvement in global economic growth emerged as a key theme during 2017. Thisstep up in activity provided a boost not only to corporate earnings, but also to valuation levels, supportinghigher stock prices. Meaningful legislative change in the form of a tax bill came very late in the year, liftingexpectations for corporate earnings growth and economic activity in 2018.Much like recent years, the Fund’s 2017 positioning rested on modest, but consistent growth in the economyand corporate earnings, the likelihood of Federal Reserve tightening and balanced sector weights. We werepleased with the overall performance of the portfolio and most notably the fundamental strength exhibited bymany of the businesses.The consumer discretionary sector played an important role in driving relative performance results all year. Keystrength came from holdings touching several industries, including off-price retail, auto-related electronicsproviders, restaurants, and toys and entertainment. While the backdrop for consumer spending has remainedpositive due to continued job growth and appreciating asset prices, that has not necessarily translated to acrossthe-board health in discretionary sector stocks. As a result, the Fund’s underweight position in specialty retailproved helpful to performance. Merger activity accrued to the benefit of the Fund with holdings acquired in theauto-related electronics and restaurant industries. We held relative sector exposure fairly constant throughout2017, which meant selling or trimming several holdings that experienced significant price strengthening.As a counter to strength in the consumer discretionary sector, the Fund’s financial services holdings fell shortof benchmark returns and were the largest source of sector underperformance. The Fund’s mix of companiesin the financial and data systems industry lagged very strong performance in that segment. Of note, a largeconsumer data breach experienced by one of the Fund’s data processing holdings led to a sharp price decline.In addition, bank holdings advanced less than the overall sector as the benefits of short term rate increases bythe Federal Reserve were offset by concern over a flattening yield curve during the year. Market exposurewithin the asset management industry proved helpful in offsetting a portion of the underperformance in theaforementioned industry groups.The Fund’s technology holdings trailed benchmark returns. An underweight portfolio position relative to thecombined semiconductor and semi equipment industries proved a fairly large headwind given the strength inthose industries. Our stock picking across the software and services industry, which continued to represent thelargest component of the Fund’s technology holdings, was favorable but not enough to offset the headwind inour underweight in semiconductors.In the producer durables sector, Fund holdings added modest value, running slightly ahead of correspondingbenchmark sector returns. An improving global growth outlook provided a favorable investment backdrop formany industries in this sector. Companies within economically sensitive industries, such as manufacturing,machinery, and transportation, performed well.Fund holdings in the basic materials sector were a drag on relative performance for the year. A long-termFund holding delivered weaker fundamentals than we would have expected given the uptick in economicactivity. As a result, any absolute price decline created a meaningful headwind in an advancing sector. TheFund carried higher exposure in the basic materials sector at year end compared to the beginning in responseto a lift in benchmark weight and new investment opportunities in the diversified chemicals industry.Page 2
Baird MidCap FundDecember 31, 2017 (Unaudited)In healthcare, Fund holdings essentially matched strong corresponding sector benchmark returns, which weresecond only to technology’s lofty advance. Positive first half relative performance on the back of solidfundamentals, exhibited by the Fund’s holdings throughout the sector, was neutralized in the second half asseveral holdings digested large price moves. In addition, competitive concerns impacted a dental distributionbusiness held by the Fund, and hurt the sector’s relative performance.In the consumer staples sector, performance of the Fund’s holdings outpaced benchmark sector returns. Thecombination of reasonably good company performance and the benefit of carrying an underweight position ina sector that lagged the strong overall benchmark return helped. It is not surprising that the overall sectorreturn was more muted than that of the overall benchmark given that consumer staples companies tend to actmore defensively and offer more modest revenue growth prospects.The energy sector contributed favorably to relative returns as the Fund’s exposure to a well-positioned oil andgas production company outpaced other companies in the sector. We continue to believe this particularholding is advantaged by a strong geographic position resulting in a favorable cost of oil production. Wewould not be surprised to see additional weight added in this benchmark sector during the course of 2018,which we would welcome, given the improvement in industry fundamentals.The long-standing investment process underlying the Fund remains focused on identifying high-qualitycompanies that deliver attractive returns and above average growth relative to peers. Seeking to control risk atthe sector and position level is also a priority of our process, with the goal of providing lower volatility ofreturns for the Fund compared to its benchmark index.Portfolio Managers:Charles F. SeversonKenneth M. HemauerPage 3
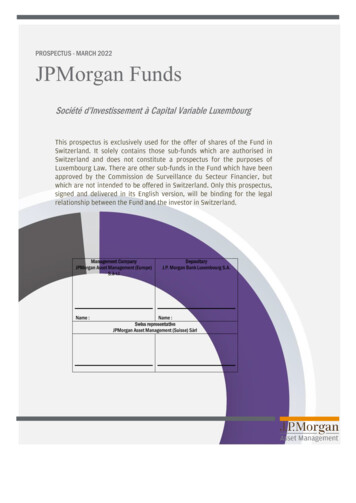
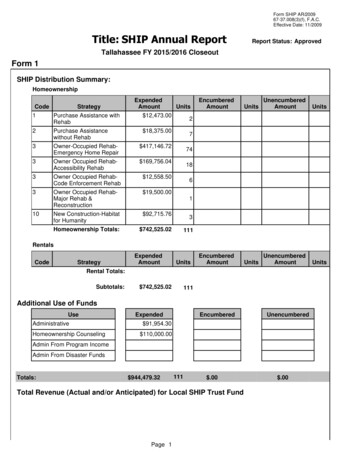
Baird MidCap FundDecember 31, 2017 (Unaudited)Portfolio CharacteristicsA December 31, 2017 summary of the Fund’s top 10 holdings and equity sector analysis compared to theRussell MidCap Growth Index is shown below.Top 10 Holdings*Equity Sector Analysis**Burlington StoresAO Smith Corp.Broadridge Financial Solutions, Inc.Verisk Analytics, Inc.Broadridge Financial Solutions, Inc.EPAM Systems, Inc.Edwards Lifesciences Corp.J.B. Hunt Transport Services, Inc.LKQ Corp.Pool Corp.Net Assets:Portfolio Turnover Rate:Number of Equity onsumer Discretionary(19.0%)Consumer Staples(3.6%)Energy(2.1%)Financial Services(13.8%)Health Care(11.7%)Materials & Processing(8.5%)Producer rt-Term Investment(2.4%) 1,390,981,79344.5%57Annualized Portfolio Expense Ratio:***GrossInstitutional Class:Investor Class:0.83%1.08%****NetInstitutional Class:Investor Class:0.83%1.08%****0%MidCap Fund5% 10% 15% 20% 25% 30%Russell Midcap Growth Index* The Fund’s portfolio composition is subject to change and there is no assurance that the Fund willcontinue to hold any particular security. Percentages shown relate to the Fund’s total net assets as ofDecember 31, 2017.** Percentages shown in parentheses relate to the Fund’s total value of investments as of December 31, 2017,and may not add up to 100% due to rounding.*** Reflects expense ratios as stated in the Fund’s current prospectus. The Advisor has contractually agreed tolimit the Fund’s total annual fund operating expenses to 0.85% of average daily net assets for theInstitutional Class shares and 1.10% of average daily net assets for the Investor Class shares, at leastthrough April 30, 2019.**** Includes 0.25% 12b-1 fee.Page 4
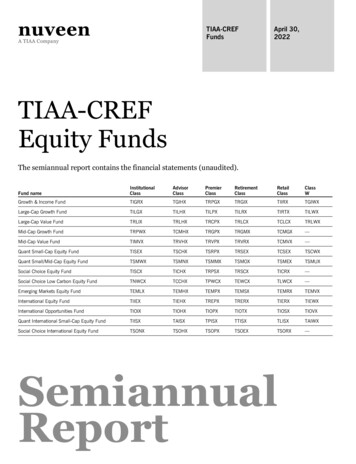
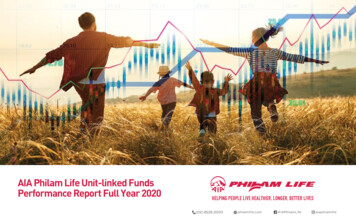
Baird MidCap FundDecember 31, 2017 (Unaudited)Institutional ClassValue of a 25,000 Investment 65,000 59,739 IndexF 55,000 45,000FF 35,000FF 57,630 Baird FundF 25,000 FFFDec10Dec11F 15,000F 5,000Dec07Dec08FDec09Dec12Dec13Baird MidCap Fund –Institutional Class SharesDec14Dec15Dec16Dec17Russell Midcap Growth IndexGrowth of a hypothetical investment of 25,000 made on 12/31/07, assuming reinvestment of alldistributions.Investor ClassValue of a 10,000 Investment 23,895 Index 25,000F 20,000FF 15,000FF 22,503 Baird FundF 10,000 FFFDec10Dec11FF 5,000Dec07Dec08FDec09Dec12Baird MidCap Fund –Investor Class SharesDec13Dec14Dec15Dec16Dec17Russell Midcap Growth IndexGrowth of a hypothetical investment of 10,000 made on 12/31/07, assuming reinvestment of alldistributions.Page 5
Baird MidCap FundDecember 31, 2017 (Unaudited)Total ReturnsFor the Periods Ended December 31, 2017One YearInstitutional Class SharesInvestor Class SharesRussell MidCap Growth Index(2)26.88%26.61%25.27%Average AnnualSinceFive YearTen .35%7.10%6.99%(1) For the period from December 29, 2000 (inception date) through December 31, 2017.(2) The Russell Midcap Growth Index measures the performance of the mid-cap growth segment of the U.S.equity universe. It includes those Russell Midcap Index companies with higher price-to-book ratios andhigher forecasted growth values. This index does not reflect any deduction for fees, expenses or taxes. Adirect investment in the index is not possible.The returns shown in the table above and the line graphs on the previous page reflect reinvestment of dividendsand/or capital gains distributions in additional shares. The returns do not reflect the deduction of taxes that ashareholder would pay on Fund distributions or the redemption of Fund shares. The returns reflect the actualperformance for each period and do not include the impact of trades executed on the last business day of theperiod that were recorded on the first business day of the next period.The gross expense ratio for each Class, as reflected in the Fund’s current prospectus, is set forth under “PortfolioCharacteristics”.The Fund focuses on growth-style stocks and therefore the performance of the Fund will typically be morevolatile than the performance of funds that focus on types of stocks that have a broader investment style. TheFund may invest up to 15% of its total assets in U.S. dollar denominated foreign securities and ADRs. Foreigninvestments involve additional risks such as currency rate fluctuations, political and economic instability, anddifferent and sometimes less strict financial reporting standards and regulation. The Fund invests asubstantial portion of its assets in the stocks of mid-capitalization companies. Mid-capitalization companiesoften are more volatile and face greater risks than larger, more established companies.Past performance does not guarantee future results. Investment return and principal value will fluctuate sothat an investor’s shares, when redeemed, may be worth more or less than their original cost.For information about the performance of the Fund as of the most recent month-end, please call1-866-44BAIRD or visit www.bairdfunds.com. Mutual fund performance changes over time and currentperformance may be lower or higher than that stated.Page 6
Baird MidCap FundSchedule of Investments, December 31, 2017Common StocksSharesValue% ofNetAssetsAerospace & DefenseMercury Systems, Inc.(1)278,051 14,277,9191.0%BanksEast West Bancorp, Inc.First Republic 9%1.1%3.0%BeveragesDr. Pepper Snapple Group, Inc.287,86027,939,6922.0%Building ProductsAO Smith Corp.540,85333,143,4722.4%Capital MarketsAffiliated Managers Group, Inc.MarketAxess Holdings, %1.0%3.2%ChemicalsAlbemarle Corp.182,43823,331,9961.7%DistributorsLKQ Corp.(1)Pool .1%2.1%4.2%67,09413,173,9071.0%Electronic Equipment, Instruments & ComponentsCDW Corp.Trimble Navigation 61.8%2.0%3.8%Food & Staples RetailingCasey’s General Stores, Inc.196,10821,952,3301.6%Health Care Equipment & SuppliesThe Cooper Cos., Inc.Edwards Lifesciences Corp.(1)IDEXX Laboratories, 05,21954,639,9220.9%2.1%0.9%3.9%Health Care Providers & ServicesAcadia Healthcare Co., Inc.(1)Henry Schein, 50.9%2.0%2.9%Health Care TechnologyVeeva Systems, Inc.(1)297,67616,455,5291.2%Electrical EquipmentRockwell Automation, Inc.The accompanying notes are an integral part of these financial statements.Page 7
Baird MidCap FundSchedule of Investments, December 31, 2017Common Stocks (cont.)SharesValue% ofNetAssetsHotels, Restaurants & LeisureDominos Pizza, Inc.Vail Resorts, Inc.103,238100,978 19,507,85221,454,79640,962,6481.4%1.6%3.0%Internet Software & ServicesGrubHub, Inc.(1)353,64025,391,3521.8%IT ServicesAlliance Data Systems Corp.Broadridge Financial Solutions, Inc.EPAM Systems, Inc.(1)Euronet Worldwide, Inc.(1)Fiserv, Inc.(1)Gartner, fe Sciences Tools & ServicesICON PLC(1)(2)Illumina, 1.9%1.0%2.9%MachineryFortive Corp.Graco, Inc.The Middleby Corp.(1)Oshkosh Truck CorporationWABCO Holdings, 9632.0%1.8%1.8%1.5%2.0%9.1%MediaCable One, Inc.41,40029,118,6902.1%Multiline RetailBurlington Stores, Inc.(1)Dollar General Corp.Ollie’s Bargain Outlet Holdings, ,418,97782,584,6433.0%1.2%1.7%5.9%Oil, Gas & Consumable FuelsDiamondback Energy, Inc.(1)225,74728,500,5592.1%PharmaceuticalsJazz Pharmaceuticals PLC(1)(2)84,01611,312,7540.8%Professional ServicesVerisk Analytics, Inc.(1)320,26330,745,2482.2%Road & RailJ.B. Hunt Transport Services, Inc.258,40229,711,0622.1%The accompanying notes are an integral part of these financial statements.Page 8
Baird MidCap FundSchedule of Investments, December 31, 2017Common Stocks (cont.)SharesValue% ofNetAssetsSemiconductors & Semiconductor EquipmentMicrochip Technology, Inc.Monolithic Power Systems, Inc.300,650216,012 Blackbaud, Inc.Red Hat, Inc.(1)ServiceNow, Inc.(1)Synopsys, Inc.(1)Tyler Technologies, Inc.(1)The Ultimate Software Group, extiles, Apparel & Luxury GoodsLululemon Athletica, Inc.(1)320,74025,206,9571.8%Trading Companies & DistributorsBeacon Roofing Supply, Inc.(1)Fastenal Co.Univar, Inc.(1)Watsco, 385,889,0755,092,718 1,390,981,79399.6%0.4%100.0%Total Common Stocks(Cost 980,294,410)Short-Term InvestmentMoney Market Mutual FundFidelity Institutional Money Market Fund –Government Portfolio, Institutional Class, 1.19%(3)Total Short-Term Investment(Cost 29,790,350)Total Investments(Cost 1,010,084,760)Other Assets in Excess of LiabilitiesTOTAL NET ASSETS29,790,350Notes to Schedule of Investments(1) Non-Income Producing(2) Foreign Security(3) 7-Day YieldIndustry classifications shown in the Schedule of Investments are based off of the Global Industry ClassificationStandard (GICS ). GICS was developed by and/or is the exclusive property of MSCI, Inc. (“MSCI”) and Standard& Poor Financial Services LLC (“S&P”). GICS is a service mark of MSCI and S&P and has been licensed for useby U.S. Bancorp Fund Services, LLC.The accompanying notes are an integral part of these financial statements.Page 9
Baird MidCap FundSchedule of Investments, December 31, 2017Summary of Fair Value Exposure at December 31, 2017The Fund has adopted authoritative fair valuation accounting standards which establish a definition of fairvalue and set out a hierarchy for measuring fair value. These standards require additional disclosures about thevarious inputs and valuation techniques used to develop the measurements of fair value and a discussion onchanges in valuation techniques and related inputs during the period. These standards define fair value as theprice that would be received to sell an asset or paid to transfer a liability in an orderly transaction betweenmarket participants at the measurement date. Management has determined that these standards have nomaterial impact on the Fund’s financial statements. The fair value hierarchy is organized into three levelsbased upon the assumptions (referred to as “inputs”) used in pricing the asset or liability. These standards statethat “observable inputs” reflect the assumptions market participants would use in pricing the asset or liabilitybased on market data obtained from independent sources and “unobservable inputs” reflect an entity’s ownassumptions about the assumptions market participants would use in pricing the asset or liability. These inputsare summarized into three broad levels and described below:Level 1 – Unadjusted quoted prices in active markets for identical unrestricted securities.Level 2 – Other significant observable inputs (including quoted prices for similar securities, quoted prices ininactive markets, dealer indications, interest rates, yield curves, prepayment speeds, credit risk,default rates, inputs corroborated by observable market data, etc.).Level 3 – Significant unobservable inputs (including the Fund’s own assumptions about the factors thatmarket participants would use in valuing the security) based on the best information available.The inputs or methodology used for valuing securities are not necessarily an indication of the risk associatedwith investing in those securities.The following is a summary of the inputs used to value the Fund’s investments as of December 31, 2017:EquityCommon StocksTotal EquityShort-Term InvestmentMoney Market Mutual FundTotal Short-Term InvestmentTotal Investments*Level 1Level 2Level 3Total 1,356,098,7251,356,098,725 —— —— 1,356,098,7251,356,098,72529,790,35029,790,350 1,385,889,075—— ——— —29,790,35029,790,350 1,385,889,075* Additional information regarding the industry classifications of these investments is disclosed in theSchedule of Investments.Changes in valuation techniques may result in transfers into or out of assigned levels within the fair valuehierarchy. There were no transfers between Level 1, Level 2 and Level 3 fair value measurements during thereporting period, as compared to their classification from the prior year’s annual report. See the Fund’svaluation policy in Note 2a to the financial statements.The accompanying notes are an integral part of these financial statements.Page 10
Baird Small/Mid Cap Value FundDecember 31, 2017 (Unaudited)Portfolio Manager CommentaryFortunately, defining moments in portfolio management only seem to come around about once every marketcycle. They test our grit and conviction in our investment process and philosophy. Just such a trial waspresented in 2016 to small- and mid-cap value managers with a high quality bias like ourselves. We watchedpainstakingly as deep value stocks levitated post the election on pure speculation. We were puzzled as ourcompanies with superior profitability, better growth and lower valuations underperformed. However, the priceof discipline is always less than the price of regret. We resisted chasing then-popular trades, such asinfrastructure-related and bank stocks that commanded unjustified valuations. We held on to dividend payingstocks on the premise long-term rates would moderate. In short, we stayed disciplined.As predicted, 2016’s laggards were 2017’s winners and our research efforts were rewarded with strong securityperformance across most economic sectors. Importantly, most of the Baird Small/Mid Cap Value Fund’sreturn for 2017 came from earnings growth, with less than 5% of the return attributed to price-to-earningsmultiple expansion. In a market with lofty current valuations, the Fund continues to trade at a compelling P/Eratio of under 16 times the next 12 months’ earnings. In addition, the majority of our domestically-focusedholdings pays an average effective tax rate greater than 30% and stands to benefit disproportionately from U.S.tax reform. Finally, we expect M&A activity to accelerate in 2018, also providing support for small- and midcap valuations.What we know from the past is that the outperformance of high quality stocks is typically protracted, unlikethe short sprints for deep value and that, over the full market cycle, high quality outperforms low quality. Ifhistory repeats itself, this trend should provide a nice tailwind in 2018 to complement the alpha we seek toprovide through security selection.In 2017, the Fund’s Institutional Class generated a total return of 21.48% compared to a 10.36% return forthe Russell 2500 Value Index, the Fund’s benchmark. During a year of great dispersion of returns amongeconomic sectors, allocation played an important role for portfolio managers in 2017. Following is adiscussion of key contributors and detractors for the Fund’s performance relative to its benchmark.Key Contributors to Relative Returns: The Fund enjoyed very strong security selection, posting positive returns in all economic sectors andoutperforming the corresponding benchmark sector return in nine out of ten economic sectors. The Fund’s security selection was led by ZAGG, Inc. ( 160%), Boingo Wireless ( 85%), Stamps.com( 64%) and Verisign ( 50%). Other notable gainers include aerospace and defense holdings, OrbitalATK and Rockwell Collins, which were bought out during the year. The Fund had no holdings in Energy (the worst performing sector in the benchmark (-15%)) for themajority of the year. We purchased Solaris Oilfield Infrastructure in the fourth quarter, which grew by50% by year-end.Page 11
Baird Small/Mid Cap Value FundDecember 31, 2017 (Unaudited)Key Detractors from Relative Returns: The Fund’s Consumer Staples holdings underperformed the benchmark due to a decline in the Fund’sholdings of Orchids Paper Products Company (-50%). We anticipate the execution issues of bringingtheir new paper plant up and running are behind the company, allowing for a debt refinancing andearnings rebound in 2018. Other notable individual stocks that contributed to the Fund’s underperformance include MetaFinancial Group (-9%), Hilltop Holdings (-14%) and J2 Global (-6%).Portfolio Manager:Michelle StevensPage 12
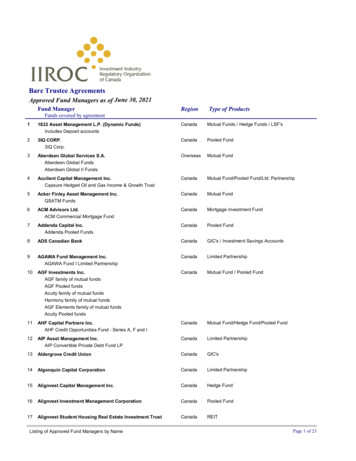
Baird Small/Mid Cap Value FundDecember 31, 2017 (Unaudited)Portfolio CharacteristicsA December 31, 2017 summary of the Fund’s top 10 holdings and equity sector analysis compared to theRussell 2500 Value Index is shown below.Top 10 Holdings*Equity Sector Analysis**Boingo Wireless, Inc.Meta Financial Group, Inc.ICU Medical, Inc.ZAGG, Inc.American Financial Group, Inc.Stamps.com, Inc.Healthcare Trust of America, Inc.Silicon Motion Technology Corp.Cypress Semiconductor Corp.Quanta Services, Inc.Net Assets:Portfolio Turnover Rate:Number of Equity onsumer Discretionary(5.5%)Consumer Staples(3.4%)Energy(2.6%)Financial Services(20.6%)Health Care(8.5%)Industrials(11.4%)Information Technology(23.2%)Materials(0.0%)Real )Short-Term Investment(3.3%) 16,945,24460.4%40Annualized Portfolio Expense Ratio:***GrossInstitutional Class:Investor Class:2.87%3.12%****NetInstitutional Class:Investor Class:0.95%1.20%****0%5%Small/Mid Cap Value Fund10%15%20%25%Russell 2500 Value Index* The Fund’s portfolio composition is subject to change and there is no assurance that the Fund willcontinue to hold any particular security. Percentages shown relate to the Fund’s total net assets as ofDecember 31, 2017.** Percentages shown in parentheses relate to the Fund’s total value of investments as of December 31, 2017,and may not add up to 100% due to rounding.*** Reflects expense ratios as stated in the Fund’s current prospectus. The Advisor has contractually agreed tolimit the Fund’s total annual fund operating expenses to 0.95% of average daily net assets for theInstitutional Class shares and 1.20% of average daily net assets for the Investor Class shares, at leastthrough April 30, 2019.**** Includes 0.25% 12b-1 fee.Page 13
Baird Small/Mid Cap Value FundDecember 31, 2017 (Unaudited)Institutional ClassValue of a 25,000 Investment 35,000 32,961 Index 33,000F 31,000F 29,000 27,000F 25,000 F 23,000Nov15FFFDec15Mar16FFJun16Sep16Dec1
In addition, competitive concerns impacted a dental distribution business held by the Fund, and hurt the sector's relative performance. In the consumer staples sector, performance of the Fund's holdings outpaced benchmark sector returns. The combination of reasonably good company performance and the benefit of carrying an underweight position in a sector that lagged the strong overall .