Transcription
IEEE TRANSACTIONS ON DEPENDABLE AND SECURE COMPUTING,VOL. 4,NO. 2,APRIL-JUNE 2007137Analysis of Computer Intrusions UsingSequences of Function CallsSean Peisert, Student Member, IEEE, Matt Bishop, Member, IEEE,Sidney Karin, Member, IEEE, and Keith MarzulloAbstract—This paper demonstrates the value of analyzing sequences of function calls for forensic analysis. Although this approachhas been used for intrusion detection (that is, determining that a system has been attacked), its value in isolating the cause and effectsof the attack has not previously been shown. We also look for not only the presence of unexpected events but also the absence ofexpected events. We tested these techniques using reconstructed exploits in su, ssh, and lpr, as well as proof-of-concept code, and,in all cases, were able to detect the anomaly and the nature of the vulnerability.Index Terms—Security, forensic analysis, logging, auditing, intrusion detection, anomaly detection, management, design,unauthorized access (for example, hacking).Ç1INTRODUCTIONANDMOTIVATION“It is, of course, a trifle, but there is nothing so important astrifles.”—Sir Arthur Conan Doyle, “The Man with the Twisted Lip”The Strand Magazine (1891)Fanalysis is the process of understanding,recreating, and analyzing events that have previouslyoccurred [1]. The problem of computer forensics is notsimply finding a needle in a haystack: It is finding a needlein a stack of needles. Given a suspicion that a break-in orsome other “bad” thing has occurred, a forensic analystneeds to localize the damage and determine how the systemwas compromised. With a needle in a haystack, the needleis a distinct object. In forensics, the point at which theattacker entered the system can be very hard to ascertain,because in audit logs, “bad” events rarely stand out from“good” ones.In this paper, we demonstrate the value of recordingfunction calls to forensic analysis. In particular, we showthat function calls are a level of abstraction that can oftenmake sense to an analyst. Through experiments, we showthat the technique of analyzing sequences of function callsthat deviate from previous behaviors gives valuable cluesabout what went wrong.Forensic data logged during an intrusion should bedetailed enough for an automated system to flag apotentially anomalous behavior and descriptive enoughfor a forensic analyst to understand. Although collecting asORENSIC. S. Peisert, S. Karin, and K. Marzullo are with the Department of ComputerScience and Engineering, University of California, San Diego, 9500Gilman Drive #0404, La Jolla, CA 92093-0404.E-mail: {peisert, karin, marzullo}@cs.ucsd.edu. M. Bishop is with the Department of Computer Science, University ofCalifornia, Davis, One Shields Ave., Davis, CA 95616-8592.E-mail: bishop@cs.ucdavis.eduManuscript received 5 Sept. 2006; revised 17 Jan. 2007; accepted 13 Mar.2007; published online 28 Mar. 2007.For information on obtaining reprints of this article, please send e-mail to:tdsc@computer.org, and reference IEEECS Log Number TDSC-0126-0906.Digital Object Identifier no. 10.1109/TDSC.2007.1003.1545-5971/07/ 25.00 ß 2007 IEEEmuch data as possible is an important goal [2], a trace ofmachine-level instructions, for example, may be detailedenough for automated computer analysis, but is notdescriptive enough for a human analyst to interpret easily.There has been considerable success in capturing thesystem behavior at the system call (sometimes called kernelcall) level of abstraction. This has been applied to severalcomputer security problems, including intrusion detection[3], [4], [5], [6], [7], forensics [8], [9], confinement [10], [11],and illicit information flow [12]. Even the popular BasicSecurity Module (BSM) [13] and its cross-platform derivatives are largely based on a subset of a given system’s kernelcalls. All users, whether authorized or not, must interactwith the kernel and, therefore, use system calls to performprivileged tasks on the system. In addition, kernel calls aretrivial to capture and are low-cost, high-value events to log,as opposed to the extremes of logging everything (such asall machine instructions) or logging too little detail foreffective forensic analysis (such as syslog). Capturingbehaviors represented at the system call abstraction makesintuitive sense: Most malicious things an intruder will douse system calls. Nonetheless, extending the analysis ofbehaviors to include more data than system calls bycollecting function calls can produce information useful toa human [14] without generating impractical volumes ofdata. Though function call tracing is not new,1 we analyzesequences of function calls in a way that results in animproved forensic analysis, which we believe is new.Logging all function calls can generate a huge amountof data. Function calls capture forensically significantevents that occur in both user space and kernel space(system calls are essentially protected function calls). Inour experiments, between 0.5 percent and 5 percent offunction calls recorded in behaviors are system calls.Thus, the amount of audit data increases from 20 to200 times as compared to recording only system calls. Thisadditional data makes it much easier to determine whensomething wrong took place, what it was exactly, and1. For example, it was used for profiling in 1987 [15] and, more recently,in intrusion detection [16], [17], [18].Published by the IEEE Computer Society
138IEEE TRANSACTIONS ON DEPENDABLE AND SECURE COMPUTING,how it happened. Additionally, as we will describe, theincrease in the amount of data recorded does notnecessarily translate into a proportional increase in theamount of data necessary for a human to audit.Our approach comes partially from intrusion detection.The techniques need to be modified to be useful for forensicanalysis, but as we will show here, they have good utility.In Section 7, we discuss some of the specific similarities anddifferences between the goals, needs, and techniques usedin forensic analysis and intrusion detection.We demonstrate the utility of our approach by giving amethodology for examining sequences of function calls andshowing experiments that result in manageable amounts ofunderstandable data about program executions. In manyinstances, our techniques offer an improvement overexisting techniques. We also make recommendations aboutpractical implementations and use of this process at the endof the paper.Our methods follow four principles [2]: They collectfunction calls within the user space, they collect data atruntime, they look at the impact of the user’s actions on thesystem, and they process and present the data in ameaningful way.2BACKGROUND2.1 Anomaly DetectionThere are two common techniques used for intrusiondetection [19]. Anomaly detection involves looking for astatistical deviation from a safe corpus of data. Misusedetection involves analyzing whether events or scenarios fita predefined model. Similarly, the analysis phase can beperformed either in real time or after the fact.Previous work [3], [20], [21] used sequences of systemcalls to understand anomalous system activity. Thisapproach allowed the experimenters to delay calls inresponse to suspected intrusions to perform analyses inreal time [21], [22]. To simplify the analysis and reduce theamount of data collected, the early implementations loggedonly those system calls made by privileged programs(setuid to root or setgid to wheel). However, all of theimplementations analyzed only the patterns of system callsand not the parameters or return values.The original analysis techniques were examples ofinstance-based machine learning, which generally involvescomparing new instances of data whose class is unknownwith existing instances whose class is known [23]. In thiscase, the experimenters compared windows of system callsof a specific size between the test data and data known to benonanomalous using Hamming distances. The originalresearch was done over a number of years, and thedefinition of anomaly changed over time. At some points,an anomaly was flagged when a Hamming distance greaterthan zero appeared. At other times, an anomaly was flaggedwhen Hamming distances were large or when manymismatches occurred. In 1999, the experimenters revisitedtheir original data with new analysis methods [24]. Some ofthe new methods included looking at rare sequences inaddition to unknown sequences using data mining techniques and using Hidden Markov Models (HMMs).The new analyses provided few new results and, in fact,none stood out as superior. This suggests that thosemethods requiring large amounts of computational powerVOL. 4,NO. 2,APRIL-JUNE 2007(such as HMMs) may not be worthwhile. Further, anoptimal window size was not determined. The window sizeof six used in the experiments was shown to be an artifact ofthe data used and not a generally recommended one [25].The experimenters later used Java methods rather thansystem calls, but the work used only individual methods,not sequences of methods, and was applied to dynamicsandboxing, not forensics [26].Data mining has been used for anomaly detection [27],[28], but has used only coarsely grained data. Approachesusing system calls and expanded techniques have subsequently been explored, with good success [5], [29].2.2 Forensic AnalysisLogging, one of two primary components of forensicanalysis, is the recording of data that can be useful inthe future for understanding past events. Auditing, theother primary component, involves gathering, examining,and analyzing the logged data to understand the eventsthat occurred during the incident in question [1]. Inpractice, forensic analysis generally involves locatingsuspicious objects or events and then examining them inenough detail to form a hypothesis as to their cause andeffect. Data for forensic analysis can be collected from avirtual machine during a deterministic replay [30], as longas the overhead for the nondeterministic event logging isacceptable. A highly specialized hardware [31], [32] mightmake nondeterministic event logging practical.A practical issue in forensics is the trade-off betweenaccuracy and the amount of data recorded. A forensicsolution at one extreme [2] is to record everything reflectingan intruder’s intentions. This would include all memoryaccesses explicitly made in an intruder’s program, ratherthan those added as intermediate storage by the compiler.The other end of the spectrum is to record very high-level(and unstructured [33]) data, such as syslog messages ordata that is focused in one particular area. Examples of thisinclude file system data from Tripwire and The Coroner’sToolkit or connection data from TCP Wrappers.Gross [34] exhaustively researched the usable data andanalysis techniques from unaugmented systems. It is likelythat to do better, systems in the future will need to beenhanced to capture additional forensic data.System call traces can also be used for forensic analysis.BackTracker [9] is a forensic tool that captures and usessystem call data for analyzing problems on the process andfile system level. An analyst provides a filename, inode, orprocess ID as input to BackTracker. Then, based onpreviously recorded system calls and some assumptionsabout system call dependencies, BackTracker generatesgraphical traces of system events that have affected or havebeen affected by the file or process given as input. However,an analyst using Backtracker may not know what input toprovide, since suspicious files and process IDs are not easyto discover when the analysis takes place long after theintrusion. Unfortunately, Backtracker does not help identifythe starting point; it was not a stated goal of Backtracker.There have been useful improvements to the “pruning”function of the BackTracker’s event-dependency graph [35],which makes the event graphs easier to analyze, but sincethe process of invoking BackTracker is unchanged, the samelimitations on its usefulness still apply.
PEISERT ET AL.: ANALYSIS OF COMPUTER INTRUSIONS USING SEQUENCES OF FUNCTION CALLS139BackTracker has also been extended [36] to use alertsfrom network intrusion detection systems to provideadditional clues to investigate “multihop attacks” and toenable the creation of event graphs that include eventsacross multiple hosts. This added information is useful, butsince the alerts are from network intrusion detectionsystems instead of host-based intrusion detection systems,BackTracker is still limited in its ability to provide clues toan analyst about what to give as input to generate the eventgraphs.Forensix [8] is a tool that collects system calls similar tothe way BackTracker does, but rather than generating anevent graph, it uses a database query system to answerspecific requets that an analyst might have, such as, “Showme all processes that have written to this file.” It alsocontained a feature that streamed audit data off of the hostmachine in real time to append-only storage on a separatemachine in a different security domain. Forensix hadsimilar constraints as BackTracker, however. A forensicanalyst, for example, has to independently determine whichfiles might have been written to by an intruder’s code.Data from intrusion detection systems has been proposed for use as forensic evidence, but the papers containing those proposals focus on legal admissibility [37] and onusing intrusion detection systems simply because that thedata is already collected in real time [38] and not on theutility of the data collected.Previous research has also been performed to understand the limits of auditing in general [39] and auditing forpolicy enforcement [40], [41]. However, neither of theseprevious research efforts were aimed at presenting usefulinformation to a human analyst. They were not specificallyaimed at forensic analysis but had different goals such asprocess automation. Other work [42] evaluated the effect ofusing different audit methods for different areas of focus(attacks, intrusions, misuse, and forensics) with differenttemporal divisions (real time, near real time, periodic, orarchival), but again, the results focused primarily onperformance rather than the forensic value to a human.Our anomaly detection techniques use the instancebased learning method mentioned previously [3], [20],because it is simple to implement and comparable ineffectiveness to the other methods. However, rather thansystem calls, as were previously used, we do so usingfunction calls and sometimes also indications of the pointsat which functions return (hereafter, “returns”). The reasonfor also including function returns is that we determinedthat they are also useful and sometimes necessary to findinganomalies in the sequences. Currently, our instance-basedlearning uses a script to separate the calls into sequences oflength k, with k being from the set 1; . . . ; 20. We calculatethe Hamming distance between all “safe” sequences andthe new sequences for several different values of k.The sequence length is important for anomaly detection[6], [7], [25], [43]. However, the length to consider dependson a number of factors. If k is small, the sequences may notbe long enough for an analyst to separate normal andanomalous sequences. Also, short sequences can be socommon that they may be in the “safe” corpus even if theyare part of an anomalous sequence at another time. On theother hand, with instance-based learning techniques, thenumber of distinct sequences of length k increasesexponentially as k increases linearly. Also, the number ofanomalous sequences that a human analyst has to look atgrows as well, though not exponentially. Through experimentation, we discovered that values of k larger than 10generally should be avoided.Generally, since our analysis is postmortem, we are moreconcerned about the human analyst’s efficiency andeffectiveness than with computing efficiency. By usingautomated parallel preprocessing that presents options forseveral values of k, a forensic analyst can decide whichsequence lengths to use. We show the effects of choosingdifferent values of k in this paper, but do not claim that aparticular value of k is ideal. Ultimately, given that forensicanalysis will remain a lengthy iterative process, thesequence length parameter is one that a human analystwill choose and vary according to the situation beinganalyzed.33.2 Forensic MethodsAnomaly detection is the foundation for our forensicanalysis. The anomaly detection process flags anomalousexecutions and presents the relevant data for further study.Whereas the anomaly detection process is automated, theforensic process involves a human. Though forensicanalysis will undoubtedly be more easily automated inthe future, automation is currently hard.To begin the forensic analysis, a human analyst firstdecides which sequence length to choose to investigatefurther. Given that we calculate the number of differingsequences for several values of k, the analyst should chooseone that is manageable to look at but in which anomalies arepresent.3.1METHODSAnomaly Detection Using Sequences ofFunction CallsWith postmortem analysis, a system can record more data,and analysts can examine the data more thoroughly than inreal-time intrusion detection. Ideally, the analysts haveavailable a complete record of execution, which enablesthem to classify sequences as “rare” or “absent.” A real-timeintrusion detection system, on the other hand, must classifysequences without a complete record because not allexecutions have terminated. Hence, if a sequence generallyoccurs near the end of an execution, classifying them as“absent” in the beginning would produce a false positive.Were we to capture events for forensic analysis onreplay, the state of the replayer would need to match that ofthe system when the events occurred in order for thecapture to provide the same information—and this is verydifficult to guarantee. We are capturing events at runtime inaccordance with the principle stating that we are morelikely to obtain genuine data not distorted by an intruder ora change of state in the hardware or software when wecapture the data as the event is occurring [2].4EXPERIMENTSANDRESULTSWe compared sequences of function calls from an original(nonanomalous) program with several versions of that sameprogram modified to violate some security policy. Our goalwas to determine how readily the differences could bedetected and what we could learn about them. We chose the
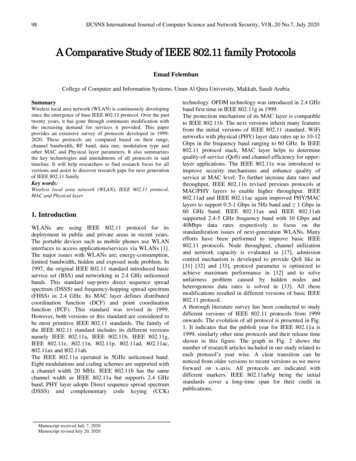
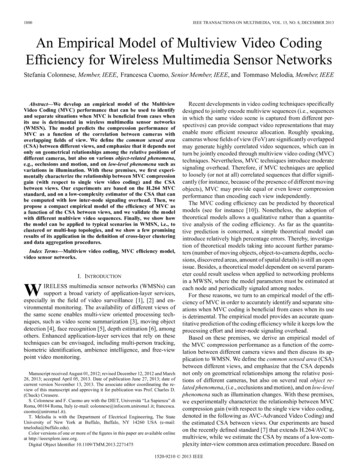
140IEEE TRANSACTIONS ON DEPENDABLE AND SECURE COMPUTING,experiments as examples of important and common classesof exploits. They recreated common critical hacks andexploits that have occurred on computer systems, includingspyware,2 buffer overflows [44], race conditions [45], andTrojan horses [46]. Indeed, Somayaji [21] considered someof these in his dissertation. They cover all classes of flawdomains as enumerated in the Research In SecuredOperating Systems (RISOS) [47] and Protection Analysis(PA) [48] reports, except for the “inconsistent parametervalidation” class from RISOS. The latter requires lookingexclusively at call parameters and not at sequences of callsthemselves, and this requires analysis techniques outside ofthe scope of our work. It is possible that a large enoughcollection of examples with enough overlapping coverageof the flow domains might be sufficient to analyze not justthe attacks specified but any other attack in the same flawdomain(s) as the specified attacks. At this time, we do notassert this, but instead use the fact that these examplescover all flaw domains in the two reports as a means ofdemonstrating the effectiveness of our approach.The following is a list of each experiment and the flawdomain3 that it covers:1.Omitting or ignoring authentication (Section 4.1):2.RISOS: inadequate identification/authorization/authentication. PA #2: improper validation (of operands, queuemgmt. depend). PA #4: improper choice of operand or operationSpyware (Section 4.2):3.RISOS: implicit sharing of privileged/confidential data. PA #1a: improper choice of initial protectiondomainIgnoring permissions (Section 4.3):.4.RISOS: inadequate identification/authorization/authentication. RISOS: asynchronous-validation/inadequate-serialization. PA #1e: improper de-allocation or deletion. PA #3a/b: improper synchronization (indivisibility þ sequencing)Buffer overflow (Section 4.4):5.RISOS: violable prohibition/limitRISOS: incomplete parameter validationPA #1b: improper isolation of implementationdetail. PA #1c: improper change. PA #2: improper validation (of operands, queuemgmt. depend.)Trojan horse (Section 4.5):.VOL. 4,NO. 2,APRIL-JUNE 2007We ran the first four experiments on an Intel-baseduniprocessor machine running FreeBSD 5.4. In thoseexperiments, we began by using Intel’s dynamic instrumentation tool Pin [50] to instrument the original andmodified versions of the programs to record all functioncalls made. In the last experiment, we used the ltrace toolon an Intel-based uniprocessor machine running FedoraCore 4. The ltrace tool captures only dynamic librarycalls, rather than user function calls, but unlike the Pin tool,is type aware and therefore enables analysis of parametersand return values. System calls are captured by bothinstrumentation methods.4To create a database of calls to test against, we ranunmodified versions of the binaries one or more times. Forexample, for our experiments with su below, one of thevariations that we tested included successful and unsuccessful login attempts.In the experiments, some sequences appeared multipletimes in a program’s execution. We refer to the number ofdistinct sequences in an execution, counting multiple occurrences only once. (The total number of sequences is simplythe total number of calls minus the length of the sequence kplus 1.) When we compare the safe program’s execution tothe modified program’s execution, we refer to thesequences appearing only in one execution and not theother as the different sequences. The relevant numbers are thenumber of total different sequences in each version and thenumber of distinct different sequences in each version, where,again, multiple occurrences are counted only once.4.1Omitting and Ignoring Authentication4.1.1 su Experiment 1Our first experiment illustrates a simple manually constructed anomaly. We compared the execution of a normalunaltered version of the UNIX su utility with one in whichthe call to pam authenticate was removed, thusremoving the need for a user to authenticate when using su.Fig. 1a shows the number of distinct sequences offunction calls for the executions of the two su programs.Fig. 1b shows the number of sequences of function callsappearing only in one version of the execution but not theother. The su-mod curve in Fig. 1b quickly jumps from 7when k ¼ 2 to 46 when k ¼ 4 and 93 when k ¼ 6. Thispattern is typical and emphasizes why larger values of k canbe a hindrance to understanding the data. Ninety-threesequences of length 6 is a lot of data to analyze visually.Although shorter sequences may fail to highlight intrusions,longer sequences can present overwhelming amounts ofdata to a forensic analyst.Choosing k ¼ 4 somewhat arbitrarily, here is the sequenceinformation for the original and modified versions of su:RISOS: Exploitable logic errorPA #1d: Improper naming.2. We define spyware to be a program or a modification to an existingprogram that quietly gathers information and covertly shares it with anattacker either locally or via the network.3. The organization that we use for the PA flaws corresponds to therevised hierarchy outlined by Neumann [49], not the organization in theoriginal PA paper.The discrepancy between the numbers of sequences ineach version is sufficient to determine that something is4. We capture both the system call and libc interface to the system call,so we can determine when a function call to libc just calls a system calland when it does not.
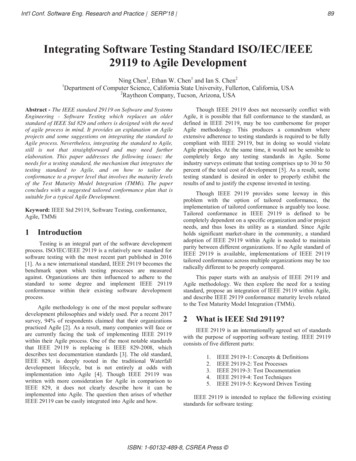
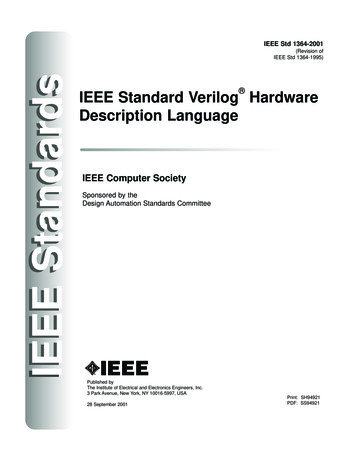
PEISERT ET AL.: ANALYSIS OF COMPUTER INTRUSIONS USING SEQUENCES OF FUNCTION CALLS141Fig. 1. Unique and different numbers of function call sequences in the original version of su and the version with pam authenticate removed.(a) Number of distinct call sequences in the original and modified versions. (b) Function call sequences present only in a single version.different between the two executions, but little more can belearned. Therefore, we compared the data between the twomore directly. Fig. 1b shows plots of the number of callsappearing only in one version of su and not in the other(using a logarithmic scale). Again, as k grows, the numberof sequences appearing in the original version and not inthe modified one quickly becomes too large for a human toanalyze easily (unless obvious patterns are present), but thenumber of sequences appearing in the modified version andnot the original stays easily viewable until a sequencelength of about 6 is used. We chose a length of 4. Using theinstance-based method described earlier, a comparisonbetween sequences in the original and modified versionsof su showsMight there be an even easier way of finding theanomalous function call sequences? When k ¼ 2, the resultschange significantly:The reduced number of anomalous sequences makes thedata much easier to look through. Using k ¼ 1,In fact, we can summarize the relevant calls for k ¼ 1 infour lines:Of the 370 distinct sequences appearing only in theoriginal version, we also learned that 14 sequences oflength 4 were called with unusually high frequency (seeTable 1).These 14 sequences in Table 1 represent nearly half theentire program execution. Looking more closely at the14 sequences (which is easy to do, since they stand out sovoluminously from the others), all but one are clearlyrelated to MD5, which does checksumming and encryption.This is an obvious clue to a forensic analyst that authentication is involved in the anomaly.By comparison, it would not have been obvious whatfunctionality was removed had we looked only at kernelcalls, because they tend to be more utilitarian and lessdescriptive. For example, setting k ¼ 1 (note that a sequenceof length k ¼ 1 is the same thing as a single call) and lookingonly at kernel calls, the calls absent in the modified versionof su but present in the original were setitimer andwrite. Given k ¼ 2, the number of sequences present in oneand not the other jumps considerably. Among the sequenceswere the calls fstat, ioctl, nosys, sigaction, getuid,and stat. These are clearly useful pieces of information butnot as descriptive as function calls.In this experiment, k ¼ 1 provides a list of differingfunction calls that provided large clues about what wasanomalous in the program. This is not always the case. Inexperiments with other programs, we discovered that k ¼ 1showed no differences at all, and a minimum value of k ¼ 2or even k ¼ 4 was needed. Likewise, we discovered thatk ¼ 4 provided manageable results similar to those in thisexperiment, but k 4 provided too many. In describingfuture experiments, we will choose a value of k that shows adiffering number of sequences for at least one of the codeversions to be greater than 1 and less than 20. In most cases,that means either k ¼ 2 or k ¼ 4.The experiment also showed that function calls providean additional value beyond that provided by system calls.
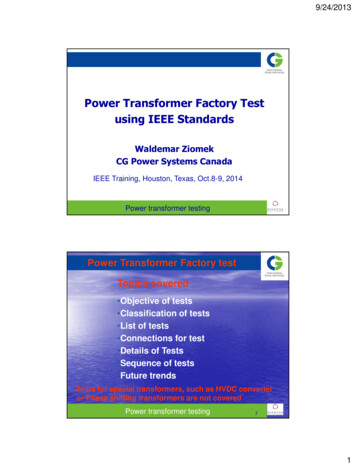
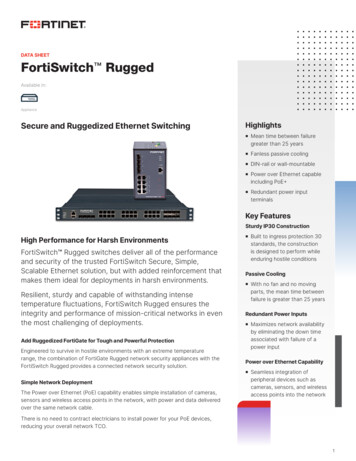
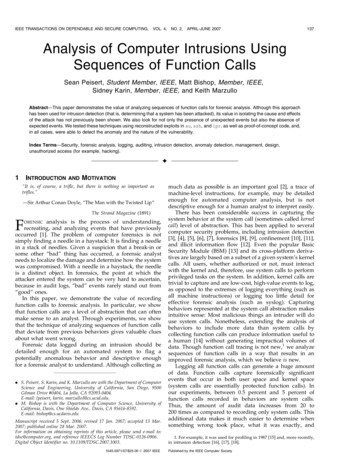
142IEEE TRANSACTIONS ON DEPENDABLE AND SECURE COMPUTING,VOL. 4,NO. 2,APRIL-JUNE 2007TABLE 1Sequences of Length 4 Appearing Only in the Original Version of su and Not the Versionwith the Call to pam authenticate RemovedUsing k ¼ 2 and looking only at system calls, there are23 sequences of system calls (19 distinct) occurring in theoriginal version of su and not the modified. The mostsignificant differences are as follows:These sequences suggest that an anomaly is occurringbut do not describe what the anomaly is. Indeed, none ofthe sequences would provide any indication to mostforensic analysts as to where to look in the source for theanomalous behavior. Contrast this to the much more usefulperspective that the sequences of function calls provided.Also, we can see that though the amount of data capturedby recording function calls rather than system calls alone is20-200 times higher, the amount of data necessary for ananalyst to examine is not nearly as high. In this case, thenumber of distinct different function call sequences is onlyseven times higher than the number of distinct differentsystem call sequences, with some sequences appearing sofrequently that they immediately stand out. The functioncall data is more useful and does not require much morework to examine.4.1.2 su Experiment 2We performed a second experiment with su, where wemodified su to run pam authenticate but ignore theresults rather than just removing the function entirely. InFig. 2, we show a number of sequences appearing in oneversion but not the other. Again, we see that a sequence oflength 4 gives a manageable amount of results forsequences appearing only in the original version of su,with four of the 13 sequences beingThat said, k ¼ 2 still gives us all we need to investigatethe anomaly. For a sequence of length 2, there are13 distinct sequences occurring in su-original andnot in su-modified. One is “strcmp, pam set item,”which is sufficient to raise concerns in any forensicanalyst’s mind because it indicates that the result of theauthentication is not being set (pam set item) after thecheck (strcmp).Fig. 2. Number of function call sequences appearing only in the originalversion of su and the version modified to ignore the results ofpam authenticate.
PEISERT ET AL.: ANALYSIS OF COMPUTER INTRUSIONS USING SEQUENCES OF FUNCTION CALLS143sequences appearing in one execution but not the other isrelatively short. In this case, sequence lengths of k largerthan 2 or 4 can cause the resulting sequences to becomeunmanageable. To the degree that an anomaly can becaught by sequences of length 2 or 4, an analyst should usethose smaller values
Logging all function calls can generate a huge amount of data. Function calls capture forensically significant events that occur in both user space and kernel space (system calls are essentially protected function calls). In our experiments, between 0.5 percent and 5 percent of function calls recorded in behaviors are system calls.