Transcription
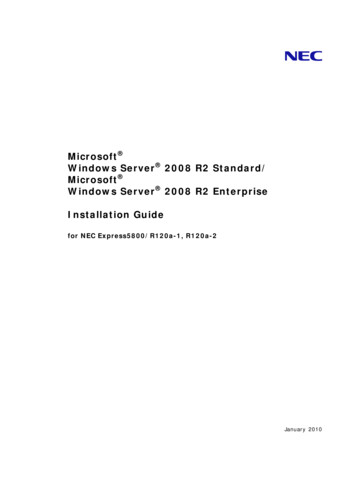
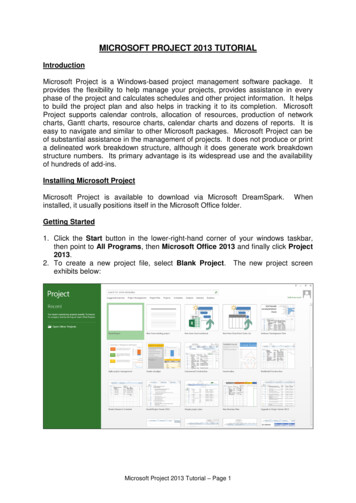
presented byMarco Russomarco.russo@sqlbi.comsqlbi.comsqlbi.comWho am I? Agendamarco.russo@sqlbi.comIndependent consultant15 years on SQL Server10 years on BI & OLAPBook authorFounder of SQLBI.COM OLAP Modeling (aka BISM Multidimensional)Vertipaq Modeling (aka BISM Tabular)ScenariosThoughtsBook SigningFriday, October 14th, 12:30pm-1:00pmSouth Lobby, beside the Summit Bookstore3Traditional OLAP with UDMOLAP vs VertipaqNOW CALLED BISM MULTIDIMENSIONALsqlbi.comOLAPBISM MultidimensionalVertipaqBISM Tabular Dimensional Modeling Facts, Dimensions ComplexRelationships MDX Script Powerful, complex Relational Modeling Tables Basic Relationships(1:N) DAX Calculated Columns Measures1
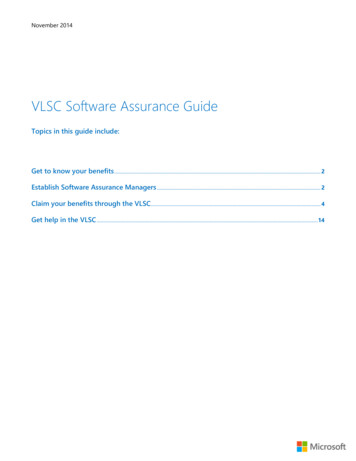
VertipaqDimensional ModelingNOW CALLED BISM TABULAR Simpler data modelLess dimensional toolsNeeds more memoryAmazingly fastWhy do we use dimensional modeling? Easiness of use? Speed!But Excel! Is speed the only advantage? BI Solutions with Vertipaq Any DWH can turn into dimensional through viewsNo DWH model will ever beat a good DMOLAP cubes need to be built on DMExcel query OLAP cubesIn 2011, Dimensional Modeling is the onlysolutionBI Solutions with Vertipaq Warehouse Stock AnalysisCALCULATE WAREHOUSE AVAILABILITY FROM TRANSACTIONSRELATIONAL MODEL FOR TRANSACTIONSDim DatePKFact MovementsID DatePKID MovemenDateYearMonthDayFK 2FK 1ID DateID ProductQuantityDim ProductPKID ProductProductsqlbi.comsqlbi.com2
Warehouse Stock AnalysisWarehouse Stock AnalysisRELATIONAL MODEL FOR TRANSACTIONSDim DatePKFact MovementsID DatePKID MovemenDateYearMonthDayFK2FK1ID DateID ProductQuantityDim ProductPK Product ID SnapshotFK 1FK 2ID DateID ProductQuantitySnapshot table with quantity on hold for eachproduct/warehouse/dayETL calculation made by summing all transactions up toa given dayBISM Tabular SnapshotPKCommon solution: ID Product Can avoid snapshot by making up-to-date calculation atquery timeReduces memory, leverages on Vertipaq engineWarehouse Stock AnalysisWarehouse Stock AnalysisSQL QUERY TO GENERATE MONTHLY SNAPSHOTSQL QUERY PLAN TO GENERATE MONTHLY *FROMdbo.DimTime tCROSS APPLY ( SELECTs.ProductKey,SUM(s.Quantity) AS StockFROMdbo.FactMovements sWHEREs.OrderDateKey t.TimeKeyGROUP BYs.ProductKey ) s1WHEREDayNumberOfMonth 1 For each date, a Full Scan of the fact table isrequired in order to generate the snapshotWarehouse Stock AnalysisWarehouse Stock AnalysisMDX QUERY WITHOUT A SNAPSHOTDAX QUERY DOES NOT REQUIRE SNAPSHOT The MDX query can be slow:WITH MEMBER MEASURES.Stock ASSUM( NULL : [Date ty] )SELECTStock ON 0,NON EMPTY [Product].[Product].[Product].members* [Date Order].[Calendar].[Month].MEMBERS ON 1FROM [Movements]sqlbi.com The DAX query is faster:Stock : CALCULATE(SUM( FactMovements[OrderQuantity] ),FILTER(ALL( DimTime ),DimTime[TimeKey] MAX( DimTime[TimeKey] )))3
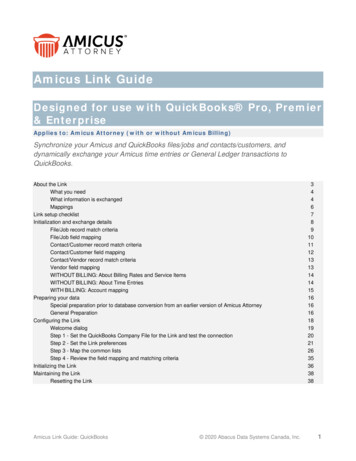
Customer AnalysisCOUNT NEW AND LOST CUSTOMERS The question: Dimensional model How many new distinct customers we had this month?Complex and slow query (either SQL or MDX) Slowness is caused by looking for the lack of an event in adimensional modelOptimization: monthly snapshot of new customers Possible shortcut: saving date of first and last sale for eachcustomerExtraction logic embedded in ETL – not flexiblesqlbi.comCustomer AnalysisCustomer AnalysisINITIAL DATA MODEL IS A CLASSICAL STAR SCHEMASOLUTION BASED ON A SNAPSHOT – ETL REQUIREDDim DatePKDim DatePKFact SalesID DatePKID SaleDateYearMonthDayFK2FK1ID DateID CustomerSalesDim CustomerPKID CustomerCustomerFact SalesID DatePKID SaleDateYearMonthDayFK2FK1ID DateID CustomerSalesDim CustomerPKID CustomerCustomerSnapshotPKID SnapshotFK1FK2ID DateID CustomerCustomer AnalysisCustomer AnalysisSOLUTION WITH FIRST/LAST TRANSACTION DATE – UPDATE ON DIMENSION REQUIREDMDX QUERY RELIES ON DISTINCT COUNT MEASUREFact SalesPKID SaleFK2FK1ID DateID CustomerSalesDim DatePKsqlbi.comDim CustomerID DatePKID CustomerDateYearMonthDayFK1FK2CustomerID FirstSaleDateID LastSaleDateWITHMEMBER MEASURES.TotalCustomers ASAGGREGATE( NULL : er Count])MEMBER MEASURES.NewCustomers ASMEASURES.TotalCustomers- AGGREGATE( NULL : [Date].[Calendar].PREVMEMBER,[Measures].[Customer Count])MEMBER MEASURES.ReturningCustomers ASMEASURES.[Customer Count] - MEASURES.NewCustomersSELECT{ [Measures].[NewCustomers],[Measures].[Customer Count],[Measures].[ReturningCustomers] } ON COLUMNS,[Date].[Calendar].[Month].MEMBERS ON ROWSFROM [Adventure Works]4
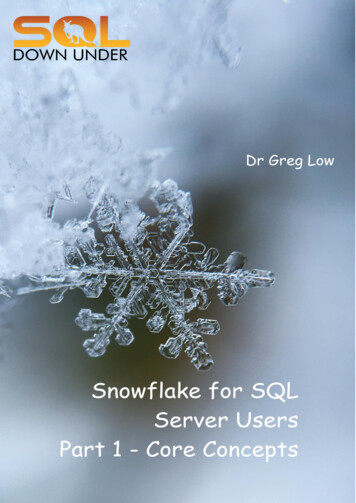
Customer AnalysisCustomer AnalysisWHY DISTINCT COUNT MEASURES ARE EXPENSIVE IN OLAP Distinct Count calculation in OLAP is expensive BISM TabularSeparate measure group Adding a distinct count measure requires modifications inOLAP schema Query in DAX is fast enough Extraction logic in DAX, not in ETL No special ETL and data modeling required Expensive processing (ORDER BY required)Different partitioning for query optimization Good to get number and also to extract customers listEasy to changeJust because distinct count is fastCustomer AnalysisDAX QUERY HEAVILY USE DISTINCTCOUNT WITHOUT PERFORMANCE ISSUESTRANSITION OF AN ATTRIBUTE OVER TIME IN SCD2NewCustomers : CALCULATE(DISTINCTCOUNT( FactInternetSales[CustomerKey] ),FILTER( ALL( DimTime ),DimTime[TimeKey] MAX( DimTime[TimeKey] )))- CALCULATE(DISTINCTCOUNT( FactInternetSales[CustomerKey] ),FILTER( ALL( DimTime ),DimTime[TimeKey] MIN( DimTime[TimeKey] )))sqlbi.comScenario: Transition MatrixTransition Matrix - OLAPRELATIONAL MODEL SCD2 Examine transition of an attribute over time in aSCD2 Customer DimensionThe real question: How many customers moved from rating AAA to ratingAAB in the last month? Kimball SCD2 Dimension tracks changes in Ratingfor a customerDim DatePKDateYearMonthDayComplex SQL queryComplex OLAP model Duplicate facts table in the model (as bridge table)sqlbi.comID DateDim CustomerFact SalesPKID SaleFK1FK2ID DateID CustomerAmountPKID CustomerCustomerScdStartDateScdEndDateRating5
Transition Matrix - OLAPTransition Matrix - OLAPRELATIONAL MODEL FOR MULTIDIMENSIONALDATA SOURCE VIEW FOR ANALYSIS SERVICES Relational model needs translation Dim Rating is a SCD Type II on customer ratingsDim Customer is a SCD Type IFact RatingValues is a snapshot of ratings measuredmonthlyMore entities required to support many-to-manydimension relationships In addition to the rating, it contains measures on used and authorizedcredit amount on the corresponding periodDim DatePKFact RatingValuesDim RatingID DatePKID RatingValuesPKID RatingDateYearMonthDayFK1FK2ID RatingID DateAmountUsedAmountAuthorizedFK1ID CustomerRatingClassificationSegmentationDim CustomerPKID CustomerCODE CustomerTransition Matrix - OLAPTransition Matrix - OLAPDIMENSION USAGE IN ANALYSIS SERVICES Two measure groups and two dimensions for Rating A andRating BComplete relationships between all dimensions andmeasure groups to get maximum navigation flexibilityScenario: Transition Matrix Rating changes E.g.: starting from January rating (see filter) on columns,see resulting rating in following months on rowsTransition Matrix – TabularRELATIONAL MODEL FOR MULTIDIMENSIONAL BISM Tabular Simpler data model (facts table are not duplicated)Complexity in DAX measuresEasier to adapt to existing relational models No translation required Dim Customer is still a SCD Type IIRating Snapshot is a snapshot of ratings measuredmonthlyCalculated columns to avoid snapshot tablesMany To Many StructureDim DatePKID DateDateYearMonthDayRatingSnapshotPK,FK1PK,FK2PKID DateCustomerRatingDim DateSnapshotPKID DateDateYearMonthDayDim CustomerFact Salessqlbi.comPKID SaleFK2FK1ID DateID CustomerAmountPKID CustomerCustomerscdStartDatescdEndDateRating6
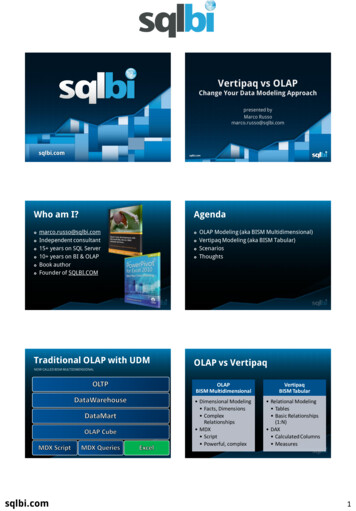
Transition Matrix - TabularNO SPECIAL DATA MODELING, JUST A DAX MEASURE FROM TWO LOOPS TO SINGLE CALCULATIONNumOfCustomers : CALCULATE (COUNTROWS (DISTINCT (Dim Customers[Customer])),FILTER (Dim Customers,CALCULATE (COUNTROWS (RatingSnapshot),RatingSnapshot[CustomerSnapshot] EARLIER (Dim Customers[Customer])) 0&& (Dim Customers[scdStartDate] MAX (Dim Date[ID Date]) )&& (Dim Customers[scdEndDate] MIN (Dim Date[ID Date]) ISBLANK (Dim Customers[scdEndDate]))))sqlbi.comABC and Pareto Analysis Pareto principle ABC and Pareto Analysis 80% of effects come from 20% of the causesABC Analysis Class A contains items for 70% of total valueClass B contains items for 20% of total valueClass C contains items for 10% of total value100%50%0%0 10 20 30 40 50 60 70 80 90100ABC Analysis Usage The ABC class can be used to slice datasqlbi.comABC Analysis with ExcelThe formula is straightforward: IF(H6 0,7;"A";IF(H6 0,9;"B";"C"))7
Scenario: ABC Classification ABC in SQLClassical implementation: SUM( Amount)GROUP BY ProductINTO #tempHeavy Calculation in ETLCould be very long in SQLFaster in MDX SQLBut requires double cube processing in order to store ABCclassification result in a dimension attributeUPDATE #tempSET Percentage RunningTotal onProduct Amount / SUM( Amount )SQLUPDATE productSET Class A/B/C (from #temp)SQLABC in MDXScenario: ABC Classification MDX queryon Sales cubeto extract ABC ClassProcess Sales cubeBISM Tabular Based on calculated columnsCalculation done at processing time No need for double processing OLAPOLAPProcess ProductDimensionUPDATE productSET Class A/B/C Update Sales aggregations(ABC flexible attribute) from MDX query Requires ETL or LinkedServerOLAPABC Analysis Tables: Product, SalesOrderDetailSalesAmountProduct CALCULATE( SUM( SalesOrderDetail[LineTotal] ) )CumulatedProduct SUMX(FILTER( Product,Product[SalesAmountProduct] EARLIER( Product[SalesAmountProduct] ) ),Product[SalesAmountProduct] )sqlbi.comGood performance, leverages on VertipaqSQLABC Analysis Calculate the classSortedWeightProduct Product[CumulatedProduct]/ SUM( Product[SalesAmountProduct] )[ABC Class Product] IF( Product[SortedWeightProduct] 0.7, "A",IF( Product[SortedWeightProduct] 0.9, "B", "C" ) )8
Data Modeling Considerations We are used to put everything in a dimensionalmodelEven when we haven’t one (like snapshot)Vertipaq is a game changer for problems thatdon’t fit into a dimensional modelCall to action Consider alternative models for Data Martsconsumed by VertipaqLearn DAXConsider BISM Tabular working side-by-side withBISM MultidimensionalSpecific models can be better solved by BISMTabularWhen possible, adapt the technology to the DataModel, not the data model to the technologyA BOOK TO LEARN DAX NOW!sqlbi.comsqlbi.comLinks SQLBI Websitewww.sqlbi.comPowerPivot Workshopwww.powerpivotworkshop.comMarco Russo blogwww.sqlblog.com/blogs/marco russoAlberto Ferrari blogwww.sqlblog.com/blogs/alberto ferrariFor any question contact us atinfo@sqlbi.comsqlbi.comsqlbi.com9
Coming up SpeakerTitleRoomKlaus Aschenbrenner Understanding SQL Server Execution PlansAintreeThomas KejserFinding the LimitsLancasterAlberto FerrariMany-to-Many Relationships in DAXPearceMark WhitehornMDX and DAX-compare and contrastBoardroomBob DuffySQL tuning from the dot.net perspectiveEmpireFrancesco QuaratinoThe forgotten DBA daily essential checklistDerby#SQLBITSsqlbi.com10
ABC and Pareto Analysis ABC Analysis Class A contains items for 70% of total value B contains items for 20% of total value Class C contains items for 10% of total value 0% 50% 100% 0 10 20 30 40 50 60 70 80 90100 ABC Analysis Usage The ABC class can be used to slice data ABC Analysis with Excel The formula is straightforward: