Transcription
Research Track PaperKDD ’21, August 14–18, 2021, Virtual Event, SingaporeMULTIVERSE: Mining Collective Data Science Knowledge fromCode on the Web to Suggest Alternative Analysis ApproachesMike A. MerrillGe ZhangTim Althoffmikeam@cs.washington.eduUniversity of WashingtonSeattle, Washington, USAzhangge9194@pku.edu.cnPeking UniversityBeijing, Chinaalthoff@cs.washington.eduUniversity of WashingtonSeattle, Washington, USAABSTRACTCCS CONCEPTSData analyses are based on a series of “decision points” including data filtering, feature operationalization and selection, modelspecification, and parametric assumptions. “Multiverse Analysis”research has shown that a lack of exploration of these decisions canlead to non-robust conclusions based on highly sensitive decisionpoints. Importantly, even if myopic analyses are technically correct,analysts’ focus on one set of decision points precludes them fromexploring alternate formulations that may produce very different results. Prior work has also shown that analysts’ exploration is oftenlimited based on their training, domain, and personal experience.However, supporting analysts in exploring alternative approachesis challenging and typically requires expert feedback that is costlyand hard to scale.Here, we formulate the tasks of identifying decision points and suggesting alternative analysis approaches as a classification task anda sequence-to-sequence prediction task, respectively. We leveragepublic collective data analysis knowledge in the form of code submissions to the popular data science platform Kaggle to build thefirst predictive model which supports Multiverse Analysis. Specifically, we mine this code repository for 70k small differences between 40k submissions, and demonstrate that these differencesoften highlight key decision points and alternative approaches intheir respective analyses. We leverage information on relationshipswithin libraries through neural graph representation learning ina multitask learning framework. We demonstrate that our model,MULTIVERSE, is able to correctly predict decision points with upto 0.81 ROC AUC, and alternative code snippets with up to 50.3%GLEU, and that it performs favorably compared to a suite of baselines and ablations. We show that when our model has perfectinformation about the location of decision points, say provided bythe analyst, its performance increases significantly from 50.3% to73.4% GLEU. Finally, we show through a human evaluation thatreal data analysts find alternatives provided by MULTIVERSE to bemore reasonable, acceptable, and syntactically correct than alternatives from comparable baselines, including other transformer-basedseq2seq models. Applied computing; Information systems Web mining; Computing methodologies Neural networks;KEYWORDSRobust Data Science, Metascience, Multiverse analysis, Garden ofForking Paths, seq2seq, Code Representation LearningACM Reference Format:Mike A. Merrill, Ge Zhang, and Tim Althoff. 2021. MULTIVERSE: MiningCollective Data Science Knowledge from Code on the Web to SuggestAlternative Analysis Approaches. In Proceedings of the 27th ACM SIGKDDConference on Knowledge Discovery and Data Mining (KDD ’21), August14–18, 2021, Virtual Event, Singapore. ACM, New York, NY, USA, 11 ODUCTIONA recent study asked twenty-nine teams of well-trained data analysts a narrowly phrased question: do referees give penalties todark-skinned soccer players at a higher rate than light-skinnedplayers [8]? Surprisingly, while individual teams arrived at highlyconfident conclusions, there was no overall consensus among theseteams. Crucially, despite access to identical datasets and no appreciable technical errors, teams arrived at their conclusions throughunique analyses which varied in their independent and dependentvariables, model selection, statistical assumptions, and more.Multiverse Analysis is an emerging concept in statistics and metascience which attempts to describe this phenomenon by demonstrating that analysts must navigate a series of “decision points” inorder to draw conclusions from data [10, 36]. While each of thechoices made at a decision point (such as setting a threshold orspecifying a model) may be entirely reasonable and defensible, somay many of its alternatives. The resulting set of options producesa “garden of forking paths” from which analysts traditionally selectonly a single path from raw data to results [10].A growing body of work has identified the large multiverse of possible analyses as a significant contributor to the reproducibility crisis,since even minor changes to the analytical path can often materially alter subsequent results [8, 35]. Accordingly, in recent yearsthere has been an increased interest in building tools to help dataanalysts explore alternative analyses through Multiverse Analysis,in order to better understand the robustness of reported outcomesalong each path [22, 29].However, it is very challenging to come up with potential alternative analysis approaches. Previous studies show that analysts’decisions are limited by their methodological experience, education, or domain [28], and that computational tools could help theseanalysts explore the multiverse more effectively [29]. Critically,Permission to make digital or hard copies of all or part of this work for personal orclassroom use is granted without fee provided that copies are not made or distributedfor profit or commercial advantage and that copies bear this notice and the full citationon the first page. Copyrights for components of this work owned by others than theauthor(s) must be honored. Abstracting with credit is permitted. To copy otherwise, orrepublish, to post on servers or to redistribute to lists, requires prior specific permissionand/or a fee. Request permissions from permissions@acm.org.KDD ’21, August 14–18, 2021, Virtual Event, Singapore 2021 Copyright held by the owner/author(s). Publication rights licensed to ACM.ACM ISBN 978-1-4503-8332-5/21/08. . . 15.00https://doi.org/10.1145/3447548.34674551212
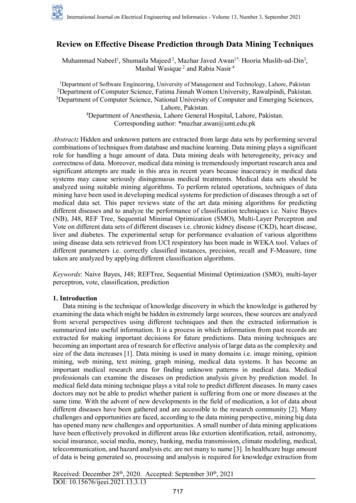
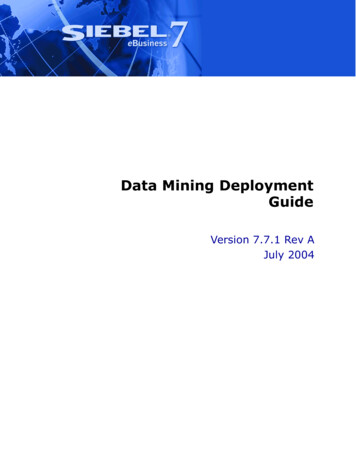
Research Track Paper KDD ’21, August 14–18, 2021, Virtual Event, SingaporeCode SnippetOriginal Codemodel create my model(optimizer 'rmsprop')PredictedAlternativemodel create my model(optimizer 'adam')Original Codemodel DecisionTreeRegressor()y hat model.fit(X train,y train).predict(X train)PredictedAlternativemodel RandomForestRegressor()y hat model.fit(X train,y train).predict(X T)(a)(b)Original Code(c)PredictedAlternativethreshold 90 #Per definitionsreviews['inspection result'] reviews['inspection score’]\.apply(lambda x: 1 if x threshold else 0)threshold 60reviews['inspection result'] reviews['inspection score’]\.apply(lambda x: 1 if x threshold else 0)NotesOur model identifies andaugments keyword argumentsthat could belong to decisionpoints, (such as optimizer),but preserves user-defined nondecision point subsequences likecreate my model.Our model correctly identifiesmodels that are suitablealternatives for eachother, ur model finds and providesalternatives for sensitivethresholds whose manipulationcould potentially alterdownstream analysisFigure 1: Examples of original code snippets from Kaggle and MULTIVERSE’s generated alternative, with decision points inthe original (𝑥 𝐷𝑃 ) in green and corresponding inserted alternatives (𝑦ˆ𝐷𝑃 ) in red. MULTIVERSE correctly identifies decisionpoints in input snippets, and copies non-decision point tokens to the output. The model can also provide alternative models,alternative hyperparameters, and identifies and augments thresholds that may impact downstream tasks.these tools currently expect analysts to identify decision points andgenerate alternative analyses themselves, which requires expertiseor expert feedback that is prohibitively expensive to scale [42].In this paper, we formalize Multiverse Analysis a composition oftwo tasks, Decision Point Classification (identifying key decisionpoints in code) and Alternative Generation (given a decision point,formulating code snippets which provide an alternate analysis)(Section 3). While this formalization permits us to programmaticallysupport Multiverse Analysis, as of yet no large dataset of MultiverseAnalyses exists with which to train such a model.Here we turn to the collective expertise of analysts on the web inthe form of popular data science competitions, where thousands ofanalysts work on the same task. A central idea of this paper is thatsmall differences between submissions to each of these competitions contain potential analysis alternatives, allowing us to create acorpus of 70k alternatives from 40k submissions without additionalcostly expert supervision (Section 4.1). For example, an analystmight change model definitions or hyperparameters between submissions to explore their impact on the analysis outcome.A second idea is that code libraries tend to be intentionally designed to represent semantic relationships between objects andfunctions commonly used in data analysis. For example, sklearn.clustering.KMeans and sklearn.clustering.DBSCAN are defined in the same submodule (clustering) and could be reasonablealternatives to one another. We build on this idea by extracting alarge graph (called a “library graph”) of these relationships to learnsuitable code representations (Section 4.2).Leveraging this dataset representing collective data analysis expertise, we propose a novel neural architecture that is able to (1) detectdecision points in analysis code (Section 5.3.1), and (2) generatepotential alternatives for the analyst to consider (Section 5.3.2).We additionally (3) integrate structural library information usinga graph neural network approach that informs the learned coderepresentations (Section 5.3.3). Further, we propose a formulationof beam search, called “Span-Aware Beam Search”, that limits thegeneration of new code to decision points, and leaves surroundingcode unchanged, improving performance in Alternative Generation.Figure 1 shows examples of MULTIVERSE’s predictions, whichcorrectly suggest alternative models, parameters, and thresholds.We evaluate MULTIVERSE’s performance on the tasks defined inSection 3. We show that MULTIVERSE achieves up to 0.81 ROCAUC on locating decision points in the “Decision Point Classification”task, and 88.7% ROUGE-L-F1 on the “Alternative Generation” task(Section 6). We conduct an ablation study to show that MULTIVERSE’s library graph , Span-Aware Beam Search, and multitaskformulation all strictly improve performance on Decision PointClassification ROC AUC and Alternative Generation ROUGE-L. Wealso evaluate our model against comparable seq2seq models forcode, showing that it performs two to three times better than thosemodels on Alternative Generation (e.g. from 29.2% ROUGE-L Precision to 93.3%). To simulate the setting where an analyst has alreadyidentified their decision points, we pass information about the location of decision points to MULTIVERSE and show that under thiscondition performance improves from 50.3% to 73.4% GLEU. Finally,we show through a human evaluation that real data analysts findMULTIVERSE’s alternatives to be more reasonable, acceptable, andsyntactically correct than alternatives from comparable baselines,including other transformer-based seq2seq models.Our work shows the feasibility of learning to recommend alternative analyses by mining collective data science knowledge fromthe web and has implications for improving reproducability by supporting Multiverse Analysis. We make all code and data used inthis paper available at github.com/behavioral-data/multiverse toencourage future research and tool development for MultiverseAnalysis.2RELATED WORKReproducability & The Data Analysis Multiverse is similarbut distinct from metalearning in that it attempts to describe allreasonable alternatives, instead of trying to discover the single “best”one. Prior work on the Data Analysis Multiverse has shown that1213
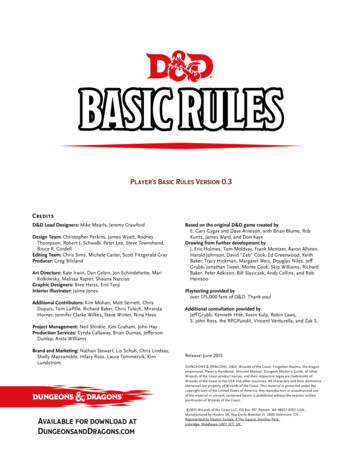
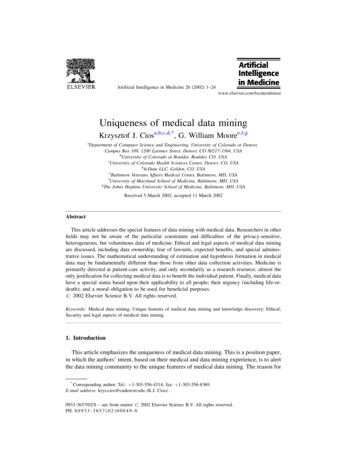
Research Track PaperKDD ’21, August 14–18, 2021, Virtual Event, Singapore1 Mine versions from Kaggleanalysts’ decisions can limit reproducability in individual studies[10], are frequently limited by experience and social pressure (e.g.pressure from a field to perform a "standard" analysis plan ratherthan another) [28], and can produce drastically different results onthe same task [8]. Researchers have developed tools to help analystsvisualize alternative pathways [29, 35], log versions of their ownwork [20, 21], and detect false positives [24]. Prior interviews haveindicated that even seasoned data analysts struggle to developmultiverse alternatives [28]. Therefore, we build on this work andpropose a potential solution that supports analysts by developingthe first model which can automatically suggest multiverse decisionpoints and alternatives.Seq2seq for Code. Sequence to sequence (seq2seq) models take asequence (such as natural language or code) as input, and generatea corresponding sequence as output. These models have achievedsignificant results on complex tasks like machine translation [1,39], speech recognition [33] and search [16]. One area focuseson learning to represent edits, often involving common fixes forgrammar, clarity and style [5, 9, 26].Deep learning has recently become a powerful tool to apply seq2seqtasks to code. Typical seq2seq tasks for code include bug fixes [4],code transformation [38], bug localization [23], API usage generation [12], etc. SequenceR [4] uses an LSTM encoder-decoder modelwith attention and copy mechanisms to generate simple one linefixes for bugs. Neural Code Translator [38] uses an encoder-decoderrecurrent nerual network (RNN) to learn code changes before andafter pull requests on Github. Lam et al. [23] use a revised VectorSpace Model for bug localization, creating a representation to relateterms in a bug report to source code tokens. In contrast to thesemethods that separate the tasks of token classification and codegeneration, we propose a joint learning method for both DecisionPoint Classification and Alternative Generation and demonstratethat this multitask framework leads to improved performance (Section 6). Furthermore, by using a BPE Tokenizer and a transformerarchitecture, we model an open vocabulary and support longersequences than these alternatives.Graph Representation Learning. Graph representation learningis a field that aims to embed nodes, edges [11], sub-graphs [7], andfull graphs [30, 41] in a high dimensional vector space that capturesdesirable properties of the original graph, such as node distance,hyperbolicity, or local neighborhoods. In this paper, we incorporate information from external code libraries by jointly learningrepresentations of library structure and tokens from code in orderto improve performance (Section 5.3.3). Of particular interest tothis paper is distortion, which describes the degree to which thepairwise distance between node embeddings reflects their distancein the original graph [2, 3].( , ) diff3 Filter diffs KNN-SVM .fit().fit() 10 n e 231- n 1 123 a b-32 Apply Myers’ diff algorithm4 KNN.fit()-SVM.fit()Apply word-wise Myers’ diff to labeldecision points. Finally, tokenize.SVM . fit ( ) n epochs 10- n epochs 1 KNN.fit()-SVM.fit() a 123- b 123KNN . fit ( )Originalsnippet andalternativeDecision PointFigure 2: Our process for mining decision points from Kaggle notebooks (Section 4.1)points, or they could require substantial guidance to detect them(e.g., due to a lack of experience with alternative approaches).In this paper we propose to formulate the goal of providing alternative analyses as two distinct prediction tasks: Decision PointClassification and Alternative Generation. In doing so, we are able toexplore not only our model’s ability to provide useful alternatives,but also unlock two other avenues for analysis. First, in Section 6we show that models that solve these tasks independently or treatour goal as a pure seq2seq task perform worse than a multitaskmodel which jointly takes both objectives into account. Second, ourmultitask framework allows us to bound the model’s performanceunder the condition that it has additional information about the location of the decision points (Section 6.3). This experimental settingmirrors the common paradigm where an analyst has some a prioriintuition about which parts of their code they want to “multiverse”,that is, for which parts they would like to see alternatives.3.1Decision Point ClassificationCreating an alternative analysis frequently entails making smalledits to existing code, such as changing a hyper-parameter or substituting one statistical model for another. This identification processis often non-trivial, even for human analysts, as knowing whichedits to code are likely to materially alter results requires a deepunderstanding of the underlying methods [28]. We are thereforeinterested in classifying spans of code which are likely to belongto decision points, and whose modification therefore alters the final result. More formally, given a token vocabulary 𝑉 , an inputcode sequence 𝑥 {𝑥𝑡 𝑉 }, 𝑡 0.𝑁 , and a code alternative𝑦 {𝑦𝑡 𝑉 }, 𝑡 0.𝑁 , we would like to classify the set of subsequences in 𝑥 that do not appear in 𝑦: 𝑥 𝐷𝑃 (these are the subsequences that changed and may constitute a decision point andcorresponding alternative). We also define 𝑦 𝐷𝑃 as the analogousset of subsequences that do not appear in 𝑥.MULTIVERSE ANALYSIS TASKSWhen a data analyst explores alternative formulations of theiranalysis they must identify likely decision points in their code andthen construct a set of reasonable alternatives for each decisionpoint. These distinct functions could be performed jointly (as ina multitask framework), or sequentially (first identifying decisionpoints and only then providing alternatives). Furthermore, a usermay have some strong prior belief about the location of decision3.2Alternative GenerationWhen a data analyst creates an alternative analysis, they must notonly locate decision points, but also write code to formulate theiralternative approach. Like decision point classification, alternativegeneration is difficult even for seasoned analysts because it requires1214
Research Track PaperKDD ’21, August 14–18, 2021, Virtual Event, Singaporea broad knowledge of related statistical methods and creativity toimagine different formulations of the same strategy. We modelthis process as a sequence to sequence (seq2seq) prediction task,whereby an alternative code snippet can be thought of as a machinetranslation of a corresponding snippet from the original analysis.More formally, we train our model to produce a code alternative 𝑦 {𝑦𝑡 𝑉 }, 𝑡 0.𝑁 . Our goal in this machine translation task is findΈ 𝑡𝑡 𝑁some 𝑦ˆ that maximizes 𝑃 (𝑦 𝑥) 0 𝑃 (𝑦ˆ𝑡 𝑥 0 .𝑥 𝑁 , 𝑦ˆ0 .𝑦ˆ𝑡 1 ).4dataset showed that a portion of these diffs were trivial edits suchas changing a model’s checkpoint directory or reformatting codefor readability. To focus our method on the types of edits that mostreasonably constitute a multiverse analysis, we filtered out diffswhose edits were changes to whitespace, changes to I/O operations(e.g. pd.read csv("v1.csv") pd.read json("v2.json")),diffs that simply rearranged code without changing its semantics(e.g. a b b a), diffs that appeared to handle plotting (e.g.fig.set size(10,5) fig.set size(10,10)), and diffs thatsimply renamed variables (e.g. clf KNN() model KNN()).Initial explorations showed that most decision points and alternatives lead to changes of individual functions, function arguments,and typically involve very few lines of code. Therefore, we removeall diffs whose total size (including context) is more than five lines,leaving us with a final dataset of 70k pairs of original snippets andtheir alternatives from 40k submissions. For the Decision PointClassification task (Section 3.1), we again apply Myers’ algorithmat the word level between the input 𝑥 and its alternative 𝑦 to findits 𝑥 𝐷𝑃 and 𝑦 𝐷𝑃 . We make these datasets and all code available . Data analyses include many different types of decisions. While we expect that decision type classifications will continue to evolve, possibly beyond the scope of our dataset, Wichertset. al [40] contribute a useful taxonomy of nine different decisionpoint types. We find that our dataset includes examples for all nineof these decision point types. Table A.1 in the Appendix showsthis taxonomy of decision points with accompanying examplesfrom our dataset, which demonstrates that our method of miningexamples from Kaggle covers a diversity of decision points andalternatives. Furthermore, a human evaluation demonstrates thatexperienced data analysts are likely to accept machine-generatedalternatives derived from this corpus (Section 6.4).KEY IDEASNext we describe two key ideas of this paper. First, we motivateand support our hypothesis that a carefully filtered set of Kagglesubmissions represent alternative analyses. Second, we outline howthe graphical structure of code libraries can be mined and incorporated into a model to help it learn relationships between relevantsemantic entities in code.4.1Some Small Differences between KaggleSubmissions Constitute AlternativeAnalysis ApproachesOn the popular data science competition website kaggle.com userscompete against each other to answer questions with data, oftenfor cash prizes. While Kaggle is best known for its machine learning competitions, users also clean, visualize, explore, and test datathrough hosted Jupyter Notebooks. Critically, Kaggle employs aversion control system to publicly host all prior versions of publicscripts. A key insight of this paper is that when a user submits multiple versions of their analysis using this feature, non-trivial editsbetween submissions can be considered as attempts to “multiverse”their approach. We do not claim that these edits represent “better”or more “correct” analyses, rather we argue that they represent codesnippets with a common goal set by a user’s intention. As a userupdates their submissions with new data cleaning methods, models,and evaluation metrics they are in effect expressing an alternateformulation of their own analysis. These updates are very commonas analysts compete with each other to complete these tasks. Furthermore, since the site contains multiple users’ submissions to thesame problems, these submissions may share a common context.Taken as a whole, these scripts represent the efforts of tens of thousands of users to solve our tasks of Decision Point Classificationand Alternative Generation (Section 3). We detail our process in formining alternatives in Figure 2.Method. We crawled all versions of all public submissions to allcompetitions on Kaggle, yielding 48k submissions with an averageof 9.3 versions of each script, or 450k scripts in total. Since Jupyterhas more than 8 million users and is the most popular IDE amongdata analysts, we focus on Python notebook cells as our unit ofanalysis [17, 19]. However, the entirety the method presented inthis paper could be applied to any unit of analysis (e.g. functiondeclarations, individual lines), and any other language that allowsimports from external libraries (e.g. Julia, R, Go).Processing and Data Filtering. We then used the Myers’ diffalgorithm (which is commonly used to compute git merges) tofind edits between sequential versions of submissions [31]. In order to help our model interpret context, we include a line of unchanged code above and below each diff. A manual inspection of the4.2Code Libraries Represent SemanticRelationshipsWhen developers build code libraries, they often organize theirprojects so that semantically related function and class definitionsare contained within the same package or module. For example,in the popular Python scientific computing library scipy, the ttest (scipy.stats.ttest ind) is defined in the same module asMann-Whitney U (scipy.stats.mannwhitneyu), one of its nonparametric alternatives. To train our model to learn this information,we capture a graph of these relationships by mining libraries fortheir structure. We note that while we describe a method for miningthis structure from Python, a similar process can be followed forany other object-oriented language like R or Julia.Method. First, we mine import statements from our dataset (Section 4.1) to find the top ten most frequently used libraries. For each library, we start with the file invoked by the highest level import statement (e.g. import scipy) and then recursively create a node in ourgraph for each file, and then neighbor nodes for each sub-moduleit imports and each function or class defined in the file. For eachclass definition, we create neighbor nodes for each of its methods.For example, the class scipy.stats is the neighbor of scipy, andhas a set of neighbors including scipy.stats.mannwhitneyu andscipy.stats.ttest. We note that this method is not guaranteed to1215
Research Track PaperKDD ’21, August 14–18, 2021, Virtual Event, Singaporecreate a tree, since some sub-modules might be imported from multiple files. Since functions are rarely referenced by their full importpath, at each node 𝑢 we store 𝑛𝑎𝑚𝑒𝑢 , the name of the class, function,or method. For example, the name of scipy.stats.mannwhitneyuis mannwhitneyu. Later, we will use these names to relate nodes ofthe library graph to tokens in code snippets (Section 5.3).Processing and Data Filtering. Many nodes in the unprocessedgraph (e.g. numpy.testing.decorate methods) are unlikely to beof interest to analysts, and so we remove nodes if they have a parentcalled testing or test and all private methods. This results in agraph with over 60k nodes representing submodules, functions,and classes in popular data analysis libraries. We make these dataavailable at github.com/behavioral-data/multiverse.5in the input code sequence:ℎ 0 𝑊𝑒 · 𝑥 𝑊𝑝ℎ𝑖 TransformerBlock(ℎ𝑖 1 ), 𝑖 1.𝑛ℎ𝑛𝑜𝑟𝑚 LayerNorm(ℎ𝑖 )𝑖𝐸Here, we describe the core components of MULTIVERSE (FigureA.1). We model code as a sequence of tokens, allowing for increasedflexibility with respect to partial or syntactically incorrect snippets(Section 5.1). Our model combines a bidirectional transformer encoder with a left to right decoder to incorporate context from thewhole input sequence (Section 5.2). Furthermore, we present a series of objectives, which we ultimately combine into one multitaskobjective (Section 5.3). Finally, we motivate and develop a novelseq2seq decoding strategy that can decide to simply copy inputsequences into the output (Section 5.4).Notation. Formally, given a token vocabulary 𝑉 , and and inputcode sequence 𝑥 {𝑥𝑡 𝑉 }, 𝑡 0.𝑁 , we train our model toproduce a code alternative 𝑦 {𝑦𝑡 𝑉 }, 𝑡 0.𝑁 . Our goal inconditional generation is to estimate:𝑡Ö 𝑁(6)(7) LayerNorm(𝑔𝑖 )(8)(9)Finally, we calculate:𝑃 (𝑦𝑡 𝑥 0 .𝑥 𝑁 , 𝑦0 .𝑦𝑡 1 ) softmax(𝐷𝑡 )(1)(10)Objectives5.3.1 Decision Point Classification Loss. To address our decisionpoint classification task (Section 3.1) we use a token-level classification head composed of a single linear layer with cross entropyloss over the encoder’s final hidden states 𝐸:Model InputsMULTIVERSE represents code as a series of tokens, allowing it tohandle messy, potentially incomplete code that might otherwisebe unparseable to an AST-based method. Furthermore, by usinga bytewise pair encoding (BPE) tokenizer (which splits rare andunknown words into more commonly occurring subtokens) weare able to model the large vocabularies that code corpora areknown for [34, 37]. We also insert special tokens INSERTED and /INSERTED at the beginning and end of subsequences in 𝑦 𝐷𝑃(Section 3.1), which we use in Span-Aware Beam Search (Section 5.4).Crucially, we only use these special tokens in training labels, and notin inputs, to simulate our use case where the user has no knowledgeabout the location of decision points in their code.5.2(5)𝑔𝑖 TransformerBlock(𝑔𝑖 1, 𝐸), 𝑖 1.𝑛𝐷 𝑔𝑛𝑛𝑜𝑟𝑚𝑡 05.1(4)𝑔0 𝑊𝑒 · 𝑦𝑠ℎ𝑖 𝑓 𝑡 𝑊𝑝𝑔𝑖𝑛𝑜𝑟𝑚5.3𝑃 (𝑦𝑡 𝑥 0 .𝑥 𝑁 , 𝑦0 .𝑦𝑡 1 )(3)Where 𝑊𝑒 R 𝑉 𝑑𝑒 is an initial embedding matrix and 𝑊𝑝 R𝑁 𝑑𝑒 is a learned positional embedding matrix. We experimentedwith embedding sizes, and found 𝑑𝑒 128 to perform as well aslarger embedding dimensions. The final input sequence embedding𝐸 is passed forward to the decoder.Decoder. The left-to-right auto-regressive decoder generates adistribution over possible new tokens given the input context 𝑥and previously decoded tokens. During training, the decoder takesthe alternative 𝑦 shifted to the left (𝑦𝑠ℎ𝑖 𝑓 𝑡 ) as input, such that𝑠ℎ𝑖 𝑓 𝑡𝑠ℎ𝑖 𝑓 𝑡𝑦𝑖 𝑦𝑖 1 𝑖 1.𝑁 , 𝑦0 START OF SEQUENCE . The decoder incorporates information from the input context by attendingto the encoder output embedding 𝐸 in each layer.METHODS𝑃 (𝑦 𝑥) ℎ𝑛𝑜𝑟𝑚𝑛(2)𝑝𝑟𝑒𝑑 SoftMax(LinearLayer(𝐸𝑡 ))(1 if 𝑡 𝑥 𝐷𝑃𝑥𝑡𝑙𝑎𝑏𝑒𝑙 0 otherwise𝑥𝑡L𝑐𝑙𝑠 (𝑥 𝑝𝑟𝑒𝑑 , 𝑥 𝑙𝑎𝑏𝑒𝑙 ) CrossEntropy(𝑥 𝑝𝑟𝑒𝑑 , 𝑥 𝑙𝑎𝑏𝑒𝑙 , 𝛾)(11)(12)(13)Where 𝛾 is a positive class weight we adopt to combat class imbalance, and 𝐸𝑡 is the output embedding of the 𝑡 𝑡ℎ input token. Inpractice, since decision point tokens represent approximately onetenth of the total tokens in our corpus, we set 𝛾 10.5.3.2 Alternative Generation Loss. To train our model to generatealternative analyses (Section 3.2) we adopt a standard seq2seq crossentropy objective over the output of the model’s decoder:Bidirectional Encoder and Left-To-RightDecoderL𝑎𝑙𝑡 (𝐷, 𝑦) CrossEntropy(SoftMax(𝐷), 𝑦)MULTIVERSE combines a bidirectional transformer encoder witha left-to-right autoregressive decoder, similar to BART [25]. InMULTIVERSE and associated ablation studies (Section 6.2) we usefour layers in both the encoder and the decoder, and four attentionheads in each.Encoder. MULTIVERSE uses a bidirectional transformer encoderwith multi-head attenti
Mike A. Merrill, Ge Zhang, and Tim Althoff. 2021. MULTIVERSE: Mining Collective Data Science Knowledge from Code on the Web to Suggest Alternative Analysis Approaches. In Proceedings of the 27th ACM SIGKDD Conference on Knowledge Discovery and Data Mining (KDD '21), August 14-18, 2021, Virtual Event, Singapore. ACM, New York, NY, USA, 11 pages.