Transcription
Freshwater catfish (Tandanus tandanus)habitat requirementsMeaghan Duncan, Dean Gilligan and Wayne Robinson
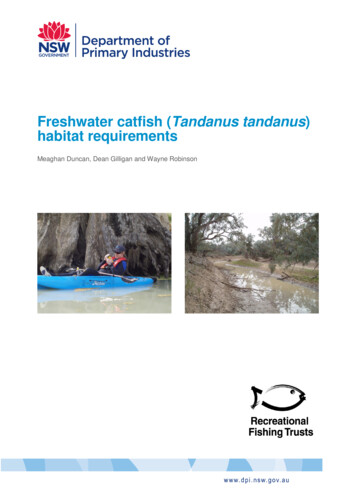
Freshwater catfish (Tandanus tandanus) habitat requirementsOctober 2017Authors:Meaghan Duncan, Dean Gilligan and Wayne RobinsonPublished By:NSW Department of Primary IndustriesPostal Address:Narrandera Fisheries Centre, PO Box 182, Narrandera, NSW, 2700Internet:www.dpi.nsw.gov.au/fisheries State of New South Wales through the Department of Trade and Investment, Regional Infrastructure andServices, 2017. You may copy, distribute and otherwise freely deal with this publication for any purpose,provided that you attribute the NSW Department of Primary Industries as the owner.Disclaimer: The information contained in this publication is based on knowledge and understanding at thetime of writing (November 2017). However, because of advances in knowledge, users are reminded of theneed to ensure that information upon which they rely is up to date and to check currency of the informationwith the appropriate officer of the Department of Primary Industries or the user’s independent adviser.Cover image: Habitat mapping on the Murray River, 11/09/09 and the Warrego River 12/08/2009 (Jonathon Doyle)
Duncan, Gilligan and RobinsonCatfish habitat mapping reportContentsContents . iList of tables . iiList of figures . iiAcknowledgments . iiiNon-technical summary. ivObjectives . ivKey words . ivSummary . ivIntroduction . 5Methods . 7Results . 15Discussion . 25Recommendations . 25References. 26iNSW Department of Primary Industries, November 2017
Duncan, Gilligan and RobinsonCatfish habitat mapping reportList of tablesTABLE 1. SITES WHERE HABITAT MAPPING WAS CONDUCTED FOR THREE CATEGORIES OFCATFISH POPULATIONS; BREEDING (IF INDIVIDUALS 83MM IN TOTAL LENGTH PRESENT(DAVIS 1977), PRESENT (NOT BREEDING) AND DISAPPEARED.8TABLE 2. AQUATIC HABITAT VARIABLES MAPPED OR OTHERWISE DERIVED AT THE 1KM REACHSCALE. 11TABLE 3. HABITAT VARIABLES INCLUDED IN ANALYSES TO DISCRIMINATE BETWEEN CATFISHABSENCE/PRESENCE/BREEDING, (1,0) INDICATES CONVERSION TO PRESENCE/ABSENCE. 13TABLE 4. THE FIVE MOST CHOSEN BEST SUBSETS LOGISTIC MODELS FOR PREDICTINGPRESENCE OR DISAPPEARANCE OF CATFISH IN MDB, ETC. 16TABLE 5. NUMBER OF UNIQUE MODELS DETERMINING CATFISH PRESENCE ORDISAPPEARANCE EACH PREDICTOR VARIABLE WAS CHOSEN IN (N 102). BOLDEDPREDICTOR VARIABLES ARE USED IN SUBSEQUENT BEST SINGLE MODEL CALCULATIONS. 17TABLE 6. ODDS RATIOS OF COMMONLY CHOSEN PREDICTOR VARIABLES FOR MODELLINGPROBABILITY OF OCCURRENCE OR DISAPPEARANCE OF CATFISH IN MDB, ETC. 19TABLE 7. THE FOUR MOST CHOSEN BEST SUBSETS LOGISTIC MODELS FOR PREDICTION OFEVIDENCE OF BREEDING OF CATFISH WHEN PRESENT IN MDB, ETC. . 21TABLE 8. NUMBER OF UNIQUE MODELS FOR DIFFERENTIATING BETWEEN CATFISH BREEDINGAND NON-BREEDING SITES EACH PREDICTOR VARIABLE WAS CHOSEN IN (N 278).ITALICISED PREDICTOR VARIABLES ARE USED IN SUBSEQUENT BEST SINGLE MODELCALCULATIONS. . 22TABLE 9. ODDS RATIOS OF COMMONLY CHOSEN PREDICTOR VARIABLES FOR MODELLINGPROBABILITY OF DETECTION OF BREEDING OF CATFISH WHEN PRESENT IN MDB, ETC. . 24List of figuresFIGURE 1. LOCATION OF EACH MAPPED SITE WITHIN THE BREEDING (GREEN DOTS),DISAPPEARED (RED DOTS) AND PRESENT CATEGORIES (YELLOW DOTS). .7FIGURE 2. RELATIONSHIP BETWEEN THE BEST ENVIRONMENTAL PREDICTORS (A) DAILY FLOWAND (B) AREA OF SUBMERGED MACROPHYTES AND THE PRESENCE (N 25) AND ABSENCE(N 11) OF CATFISH IN 36 MDB SITES. DOTTED LINES INDICATE THE PREDICTEDRELATIONSHIP WITH THE PREDICTION VARIABLE AND THE VERTICAL CROSS HAIR LINEINDICATES THE VALUE ON THE X AXES WHERE CATFISH ARE PREDICTED AS MORE LIKELYTO OCCURR THAN NOT (PROB OCCUR 0.50), I.E. VALUES ABOVE 0.5 MEANS CATFISH AREMORE LIKELY TO BE PRESENT THAN NOT. IN FIGURE 2A), THE PREDICTION CURVES AREMADE AT THE MEAN VALUE FORMACROPHYTE AREA, AND FOR MEAN DAILY FLOW INFIGURE 2B. 18iiNSW Department of Primary Industries, November 2017
Duncan, Gilligan and RobinsonCatfish habitat mapping reportAcknowledgmentsThis project was funded by the Recreational Freshwater Fishing Trust, who specifically invited aproject proposal on catfish genetic structure and habitat preferences in November 2006.Fieldwork was undertaken by Tim McGarry and Jonathon Doyle. We thank Martin de Graaf forcomments on an earlier draft. This work was conducted under the NSW Fisheries ACEC permitNo: 05/06.iiiNSW Department of Primary Industries, November 2017
Duncan, Gilligan and RobinsonCatfish habitat mapping reportNon-technical summaryFreshwater catfish (Tandanus tandanus) habitat requirementsPrincipal investigators:Meaghan Duncan Dean GilliganAddress:NSW Department of Primary IndustriesNarrandera Fisheries CentreBuckingbong RdNarrandera, NSW 2700Tel: 02 6958 8200. Fax: 02 6959 2935Objectives To determine the critical habitat variables required to sustain a reintroduced T. tandanuspopulationTo identify the critical habitat variables that promote breedingKey wordsT. tandanus, Murray-Darling Basin, Habitat MappingSummaryFreshwater catfish (Tandanus tandanus) were once widespread throughout the Murray-DarlingBasin (MDB). While this species is still abundant in some coastal drainages of NSW and QLD, ithas suffered a marked decline in the MDB. The factors behind the decline of this species are notwell understood given there is little information on its specific habitat requirements. Here wesurveyed 36 sites within the MDB that represented areas where catfish were present, presentwith evidence of breeding or disappeared (population known to be present 10 years ago). Ateach site, 35 habitat variables were mapped along 1km reaches. Results showed that catfishpopulations were most likely to be present if there is a high cover of Cobble/Gravel, SubmergedMacrophytes and low Daily Flow. Breeding is more likely to occur at sites with a high abundanceof Bedrock/Boulders, Riffle/Rapids, Emergent Macrophytes and low Daily Flow. Results of thisstudy will lead to recommendations on locations that may be suitable reintroduction sites forstocking hatchery-bred fish and will also inform future habitat rehabilitation programs targetingfreshwater catfish.ivNSW Department of Primary Industries, November 2017
Duncan, Gilligan and RobinsonCatfish habitat mapping reportIntroductionSuccessful re-introduction programs for threatened species rely on a detailedunderstanding of the key habitat variables required to sustain viable populations.Without such information, considerable resources may be expended in introducing aspecies into an environment where it may not survive, may not remain in the vicinityof the reintroduction locations, or may survive but not reproduce. Thus its persistenceis dependent upon repeated releases of captive-bred individuals and this clearlycannot be considered a successful introduction.The freshwater catfish (Tandanus tandanus) was formerly widespread in inland andcoastal eastern Australia. It is still reasonably abundant in coastal drainages but hasdeclined markedly across much of the Murray-Darling Basin (MDB). As a result ofthis decline, the species is listed as an endangered population in the MDB (NSWGovernment Gazette no. 103), is protected under the Fisheries Management Act2007 in South Australia and is listed as threatened in Victoria under the Flora andFauna Guarantee Act 1988 in Victoria. The only inland waterways that still supportsubstantial freshwater catfish populations are limited parts of the slopes, upland orhighland reaches of the Macquarie, Namoi, Gwydir and Border Rivers in north eastern region of the Murray-Darling Basin. Importantly, they are believed to belocally extinct over a large proportion of their range.A range of habitat rehabilitation actions have occurred in many areas of the MDB inrecent years, including the construction of numerous fishways, re-snagging of riverreaches and provision of environmental flows. Despite these measures, naturalrecovery of freshwater catfish is unlikely in many areas given that the species islocally extinct over broad areas. Because they are not highly migratory, naturalrecolonisation is unlikely. In these regions, a conservation stocking program isconsidered a key approach for recovering populations of freshwater catfish.However, to maximise the success of the stocking program, it is necessary to identifyappropriate release locations to ensure that released fish not only survive, but alsoreproduce and become a self-sustaining population. Catfish are thought to preferslow-moving or still waters and are found in greater abundance in lakes andbackwaters (Lake 1971). In Victoria, several self-sustaining freshwater catfishpopulations are found in shallow lakes with high coverage of macrophyte beds(Clunie and Koehn 2001). In south-east Queensland, freshwater catfish populationstend to occur in streams with a sand, gravel or cobble substrate, a low to moderateriparian cover and low macrophyte cover (Pusey et al. 2004). Catfish have arelatively high minimum spawning temperature threshold relative to other nativefishes in the MDB. Thermal pollution may partly explain their disappearance fromsome rivers in the MDB subject to cold-water releases from large impoundments(Pollard et al. 1996; Pusey et al. 2004 and references therin). Peak releases fromimpoundments typically occur during the spring months, coinciding with the peakcatfish spawning season where water temperatures of around 24oC are required totrigger nest building.From these qualitative descriptions, it can be deduced that ideal release sites forfreshwater catfish would be a lake or backwater not exposed to cold-water pollutionand with moderate to extensive cover of macrophytes. However, quantitative habitatassessment would enable identification of the driving habitat variables that may havebeen overlooked in previous studies, but are critical to promote a self-sustainingpopulation. Furthermore, quantitative methods may also identify multiple habitatfeatures that act synergistically to have a beneficial effect. Therefore, a quantitative5NSW Department of Primary Industries, November 2017
Duncan, Gilligan and RobinsonCatfish habitat mapping reportapproach is preferred for identifying the best possible sites for reintroduction offreshwater catfish, and specific habitat enhancements can be made where necessaryto maximise the successful establishment of the reintroduced population.Anthropogenic disturbances may force threatened species into suboptimal habitat,which could potentially affect the results of any projects that seek to determine thekey habitat requirements (Wang & Li 2008). Fortunately, there are still healthyremnant populations encompassing a portion of the species’ former range.Therefore, quantitative methods that examine multiple habitat features to determinethe species’ habitat preferences are well suited for catfish. Habitat use has previouslybeen quantified for freshwater catfish in the Wet Tropics (north-east Queensland)and south-eastern Queensland (Pusey, Kennard et al. 2004). These tropical and sub tropical coastal rivers have vastly different geomorphology and flow regimes to riverswithin the Murray-Darling Basin. The catfish in north-east Queensland have recentlybeen recognised as a new species, T. tropicanus (Welsh et al. 2017) and thereforethey may have acquired unique habitat requirements. Previous studies that havequantified T. tandanus habitat use in the MDB are confined to one river system(Balcombe et al. 2006; Boys et al.) or a single lagoon (Koster et al. 2015). Therefore,these studies provide limited data to inform potential stocking programs for T.tandanus.We investigated the critical habitat variables required to a) sustain a reintroducedT. tandanus population and b) promote breeding. Thirty-six sites were selected fromthroughout the MDB that fell into one of three categories; i) T. tandanus populationcurrently present but with no evidence of recent recruitment (present - P), ii)T. tandanus population currently present with evidence of recent recruitment(breeding – B), and iii) T. tandanus known to be formerly present but not reported forover 10 years (disappeared – D). Thirty-five habitat variables were mapped in eachsite and the data were analysed using logistic regression models. We assessed theresults based on; computational efficiency, success of discrimination betweencategories, and; consistency of predictions by the habitat variables. We present arange of the best models and interpret the habitat variables most likely to be relatedto catfish presence/absence or breeding/non-breeding. Results of this study will allowthe most suitable re-introduction sites to be identified and may also be used to guiderehabilitation of sub-optimal habitat where adult catfish populations persist, but whererecruitment no longer occurs.6NSW Department of Primary Industries, November 2017
Duncan, Gilligan and RobinsonCatfish habitat mapping reportMethodsSite selectionThe majority of the fish assemblage data collected by the NSW state governmentfisheries agency since 1994 has been collated in the NSW Aquatic EcosystemsResearch Database (AERD). The AERD contains data collected from over 4,000sites across NSW using a wide variety of fish sampling methods, but primarilyelectrofishing (NSW Department of Primary Industries – Fisheries, unpublished). Wequeried the AERD for data collected between 1 January 2000 and 30 June 2010 toidentify sites where T. tandanus had been collected. These sites were categorised aseither ‘breeding’ (B) or ‘present but not breeding’ (P). Breeding sites were those thatshowed evidence of recruitment based on the presence of young-of-year fish (YOY),identified as individuals less than 83 mm in total length (Davis 1977). We usedmuseum records and pre - 2000 data to identified sites that formerly supported T.tandanus but where none had been collected since 2000. These sites werecategorised as ‘disappeared (D). Twelve sites from each category (B, P and D) wereselected for analysis and then mapped for 35 habitat variables (Fig. 1 Table 1, Table2). However, following completion of the habitat mapping, larval T. tandanus werecollected in one of the sites that was designated as “disappeared”. Consequently,instead of having 12 reaches in each of the three categories, we had 13 reacheswhere they were “breeding” 11 reaches where they had “disappeared” and 12reaches where they are “present” but not breeding (Table 1).Figure 1. Location of each mapped site within the breeding (green dots), disappeared (red dots)and present categories (yellow dots).7NSW Department of Primary Industries, November 2017
Duncan, Gilligan and RobinsonCatfish habitat mapping reportTable 1. Sites where habitat mapping was conducted for three categories of catfish populations; Breeding (ifindividuals 83mm in total length present (Davis 1977), Present (not breeding) and Disappeared.CategoryWaterbody nameLatitudeLongitudeBreedingGwydir River-29.8434416150.524238BreedingCockburn River-31.0606299151.138695BreedingTenterfield Creek-29.0311789151.724585BreedingImperial Lake-31.9463019141.495296BreedingSevern River-28.7517881151.835698BreedingLachlan River-33.3424145.83774BreedingCastlereagh River-31.44841149.31784BreedingQuart Pot Creek-28.66726151.94753BreedingSwan Brook-29.74331151.18874BreedingWashpen Creek-34.576142.874BreedingMacintyre River-29.761151.12BreedingWidgiewar Lagoon-35.073146.283PresentLittle River-32.6118589148.687274PresentHorton River-29.8976395150.342767PresentNamoi River-30.9761866150.424288PresentNamoi River-30.2330136149.622804PresentMurray River-34.1244119142.03566PresentIsland Creek-33.22642147.3326PresentMacquarie River-32.24511148.29984PresentEwenmar Creek-31.78962148.13155PresentGeorges Creek-30.21713151.2429PresentTycannah Creek-29.70192150.09497PresentTenterfield Creek-28.9417151.59901PresentSevern River-29.38995151.17115Breeding*Bogan River-31.6243722147.18046DisappearedDarling River-31.8425357143.145273DisappearedEdward River-35.6015976144.9931978NSW Department of Primary Industries, November 2017
Duncan, Gilligan and RobinsonCatfish habitat mapping reportDisappearedBogan River-30.2617278146.7413DisappearedMurray River-34.0516787141.044424DisappearedDarling River-30.0873145.93537DisappearedMurrumbidgee River-34.7699558146.573957DisappearedBarwon River-30.0146298148.059377DisappearedWarrego River-29.0891099145.770986DisappearedDumaresq River-28.867556151.163149DisappearedMacintyre River-28.7003165150.530502DisappearedLachlan River-33.40318148.0167*This site was originally classified as “Disappeared” but 3 larval T. tandanus were subsequentlyreported in January 2008 after the habitat mapping was complete (NSW DPI, unpublished data).This site was therefore included in the “Breeding” group for data analysis.Quantification of habitat variablesAquatic and riparian habitat features were mapped for 1 km reaches for each of the 36 sitesbetween August and September 2009 (Table 2). Substratum, mesohabitat, physical cover,macrophyte species, macrophyte beds, willows (Salix spp.), eroded and undercut banks and depthwere mapped in the field using hand-held PDA units (Dell Axim X51U and MIO Digi-walker pocketPC) with ESRI Arcpad 6.0.3 data acquisition software. Each PDA was linked to a Garmin 72 GPSunit via a bluetooth device (i.Trek Bluetooth Battery Adapter) to record positional data. Each PDAsloaded with the 1: 50,000 topographical map (GDA 94 MGA Zone 55) for that region as abackground layer at a screen resolution of 1:2,000. Two technicians were each equipped with themapping unit, and working in pairs, mapped all the habitat features within the bank-full riverchannel. Shallow and narrow reaches were mapped on foot. Deeper reaches were mapped from acanoe or kayak. Spatial data were recorded in either of two formats, position dependent or positionindependent, depending on the habitat feature being recorded. All data were uploaded into a GISfor processing (ArcGIS 9.3.1, ESRI Inc.).Substratum was mapped as the position of a transition from one type to another and defined as aposition-dependent feature. Substratum transitions were mapped at the point considered to be thebase-flow waterline, regardless of ambient flows on the day of mapping. Substratum categorieswere based on the classification of Platts et al. presented in Hamilton and Bergersen (1984):bedrock, boulders ( 512 mm), cobble (64 – 512 mm), gravel (2 – 64 mm), sand (62 µm – 3 mm),mud ( 62 µm and dispersible), clay ( 62 µm and pliable) or detritus (organic material). Ininstances where a mid-stream bed of a particular substratum occurred within a matrix of anothersubstratum type, but did not reach the bank (i.e. a cobble bed in the centre of an otherwise sandystream bed), the substratum that occupied the greatest proportion of that half of the stream bedwas mapped. Meso-habitat transitions were also mapped as position-dependent features as forsubstratum, but at the current waterline. Meso-habitat categories were: pool (still or very slowlyflowing water), run (flowing water with little or no surface turbulence), riffle (flowing water with aturbulent surface), rapid (very turbulent with the presence of one or more abrupt drops in surfacewater level) and dry (no surface water). Each time a pool was recorded, its maximum depth wasrecorded as a position dependent feature to 0.1 m accuracy. To calculate the area of eachsubstratum or meso-habitat type, the river channel boundary was manually digitised within adesktop GIS using Spot 5 imagery as a template at a resolution of 1:3,000 to create a polygon9NSW Department of Primary Industries, November 2017
Duncan, Gilligan and RobinsonCatfish habitat mapping reportrepresenting the total area of the river channel. In cases where overhanging riparian vegetationobscured the underlying stream bank, the stream bank was recorded as the centre line of the rowof riparian trees and/or the substratum transition points or locations of willows that had beenrecorded in the field. The resulting polygon was then manually split along its centreline in GIS.These half-channel polygons were then cut (from bank to centre-line) at each substratum or meso habitat transition point and the resulting polygon fragments coded by substratum and meso-habitattype.The start and end points of undercut and eroded banks were recorded as position-dependentfeatures. Undercut banks were classed as those that overhang the water by at least 30 cm at apoint where the water is at least 30 cm deep. The bottom of the overhang must be no more than 10cm above the water surface. Actively eroding banks were defined as areas of stream bank whereremoval of material by surface wash, undercutting or slope failure was evident and unchecked byplant growth or showing signs of stabilising. These features were digitised by drawing a polylineconnecting the start and end point of each feature along the outline of the channel polygon.The position of individual woody habitats (snags), rocky habitats, macrophyte beds and willowswere mapped as position-independent features. Woody and rocky habitats were furthercharacterised as large or small, and simple or complex. The size of woody habitats wasdistinguished by having a maximum length of 2 m for small, or 2 m for large. Simple structureswere those with a single branch or trunk, whereas those with multiple branches, trunks withbranches, trunks with hollows or root masses were classified as complex. An additional category ofwoody habitats; snag piles, was identified as dense accumulations of snags where the number ofindividual items contained within the pile could not be determined. The location of each woodyhabitat item was recorded as the position of the middle of the snag. Any individual item of simplewoody habitat with a maximum dimension of 1 m in length was not recorded.Rocky habitat was considered to be any rocks classified as a boulder (or number of boulders 512mm diameter) that existed within an area of another substratum type (i.e. a single bouldersurrounded by sandy or muddy substratum). Small rocks were those 1,000 mm diameter andlarge were 1,000 mm diameter. Simple rocky habitat consisted of isolated single rocks or rocksspaced widely amongst the dominant substratum. Complex rocky habitat consisted of closelyspaced aggregations or piles of rocks.The size, shape and area of macrophyte beds were mapped by drawing the outline of themacrophyte bed as a polygon onto the screen of the PDA in the field. The identity of macrophyteswas recorded to genus level using Sainty and Jacobs (2003).The position of each willow trunk ( 10 cm diameter at breast height) was marked as a positionindependent feature.Four additional aquatic habitat metrics were derived from existing spatial data layers; area ofriparian canopy within a 100 m and a 10 m riparian buffer, altitude and mean daily flow. Ten metreand 100 m buffers was generated for the stream from the digitised stream area polygon in ArcGIS.All riparian canopy cover within the buffers was manually digitised as polygons from a Spot 5satellite image (dated late 2004 – early 2005) at 1:3,000 scale resolution. Altitude data for each1 km reach were extrapolated from a 100 m grid-cell DEM of NSW as the altitude ASL at thedownstream limit of each segment. Average daily flow for each 1 km reach was derived from astream network model developed by Stein et al. (2009).10NSW Department of Primary Industries, November 2017
Duncan, Gilligan and RobinsonCatfish habitat mapping reportTable 2. Aquatic habitat variables mapped or otherwise derived at the 1km reach scale.Habitat variableUnit of measureMean and range ofhabitat variables (allreaches) (per km)AltitudeMetres ASL293 (110-910)Large complex snagsCount19 (2-98)Large simple snagsCount63 (0-381)Small complex snagsCount27 (1-103)Small simple snagsCount39 (2-93)Snag PileCount4 (0-15)Large complex rocksCount1 (0-11)Large simple rocksCount1 (0-8)Small complex rocksCount2 (0-14)Small simple rocksCount2 (0-33)Willow (Salix spp.)Count22 (0-19)Erosion (length m)Total length in m222 (0-887)Undercut (length)Total length in m17 (0-272)Free floating macrophytesArea (m2)829 (0-13,177)Narrow-leaved emergentmacrophytesArea (m )Non-feathery submergedmacrophytesArea (m )Broad-leaved emergentmacrophytesArea (m )Floating attached macrophytesArea (m )Submerged & emergentfeathery macrophytes22,060 (0-14,608)21,462 (0-7,625)232 (0-582)2275 (0-9,648)Area (m )2193 (0-1,620)Riparian canopy within 100m ofthe stream bankArea (ha)8 (1-15)Riparian canopy within 10m ofthe stream bankArea (ha)1 (0-2)Maximum depthMetres2 (0-6)Average Daily flowML per day2,611 (1-24,451)11NSW Department of Primary Industries, November 2017
Duncan, Gilligan and RobinsonCatfish habitat mapping reportPool (still or very slowly flowingwater)Area (ha)1 (0-5)Rapid (very turbulent with thepresence of one or more abruptdrops in water level)Area (ha)0 (0-0)Riffle (flowing water with aturbulent surface)Area (ha)0 (0-1)Run (flowing water with little orno turbulence)Area (ha)2 (0-15)BedrockArea (ha)0 (0-2)Boulder ( 512 mm)Area (ha)0 (0-0)Clay ( 62 µm and pliable)Area (ha)0 (0-1)Cobble (64 – 512mm)Area (ha)0 (0-1)Detritus (organic material)Area (ha)0 (0-1)Gravel (2 – 64mm)Area (ha)1 (0-4)Mud ( 62 µm and dispersable)Area (ha)2 (0-10)Sand (62 µm – 3mm)Area (ha)0 (0-7)Data analysisReducing the number of variables and variable transformationGiven that 35 variables were recorded, it was important to identify redundancy and reduce thenumber of variables used in the analysis. This included (1) combining or omission of correlatedvariables which reduced collinearity, reduced the number of zeroes or increased the range orsensitivity of the response; (2) pre-processing elimination of invariant or over-dispersed data(filtering), and; (3) identification of ineffective variables during processing (wrapping). Area of nonfeathery submerged and submerged & emergent feathery macrophytes were merged as a‘Submerged Macrophytes’ variable. Area of broad-leaved emergent and narrow-leaved emergentwere merged as an ‘Emergent Macrophytes’ variable. Area of rapid and riffle mesohabitats weremerged as a ‘riffle-rapid’ variable. Area of bedrock and boulder substratum were merged as a‘bedrock-boulder’variable and cobble and gravel were merged as a ‘cobble-gravel’ variable. Smallsimple and small complex snags were combined as “Small snags”. Large simple snags, largecomplex snags and snag piles were combined as “Large snags”. Complex and simple rocks werecombined as “Rocks”.The distribution of each variable was initially investigated by looking at the normalised scoreswithin each catfish category. Variables with more than 50% zero values in all three categories(T. tandanus absent/present/or breeding) were removed from the data set because they lackeddiscriminatory ability. Variables that were apparently normally distributed within each categorywere entered to the models in their raw format. Variables that occurred enough times to beincluded but still had 50% or more
been quantified for freshwater catfish in the Wet Tropics (north-east Queensland) and south-eastern Queensland (Pusey, Kennard et al. 2004). These tropical and sub tropical coastal rivers have vastly different geomorphology and flow regimes to rivers within the Murray-Darling Basin. The catfish in north-east Queensland have recently

