Transcription
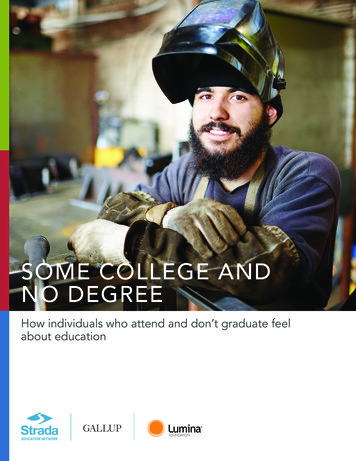
SOME COLLEGE ANDNO DEGREEHow individuals who attend and don’t graduate feelabout educationEDUCATION NETWORK
INTRODUCTIONOver the past 20 years, more than 31 million studentshave enrolled in college and left without receiving adegree or certificate.1 Re-enrolling this “some college,no degree” population is at the center of many states’plans for boosting the educational attainment of theirpopulation.Among many resources highlighting the importance of these efforts, the National StudentClearinghouse recently came out with a report providing a descriptive overview of the somecollege, no degree population nationally and for each of the 50 states on key objectivevariables.2 The report highlights the need for a nuanced understanding of this populationto make re-enrollment efforts more effective. Adding to this descriptive understanding, ourreport provides the firsthand subjective perspectives of more than 40,000 individuals whostopped out of college before completing a degree.The data and insights shared here are drawn from the Strada-Gallup Education ConsumerSurvey: an unprecedented telephone survey of more than 340,000 U.S. adults ages 18–65that explores their educational experiences and attitudes. Strada Education Network, LuminaFoundation, and Gallup collaborated on this report as part of a larger series of reports onadults without degrees.National Student Clearinghouse Research Center. Some College, No Degree: A National View of Students with SomeCollege Enrollment, but No Completion. Accessed Dec. 4, 2019, tional Student Clearinghouse Research Center. Some College, No Degree. Accessed Dec. 4, ads/SCND Report 2019.pdf.3Sample size for likely to enroll questions 3,021. Sample size for quality questions 8,860.12
Based on the responses of 42,190 adults ages 25-64 with some college, but no degree andwho are not currently enrolled,3 the report’s key findings include: The most common reason people cited for stopping out was difficulty balancing schooland work at the same time. The factors that would have the most impact on getting this population to re-enroll areaffordability, schedule flexibility and a guaranteed employment outcome connected tofurther education. Those who stopped out rated lower the quality of the academic and career advisingthey received than peers who completed degrees. Only 19 percent of these adults report they are no longer interested or don’t need tocomplete their education. Cost and time pressures continue to be barriers that keeppeople from re-enrolling. Adults with some college but no degree say that if they enroll in additional courses ortraining, they are most likely to do so via an employer. When considering nonemployerproviders, they are most likely to enroll at a community college. Younger people, people of color and those who are working in certain occupations,such as food preparation, are more likely to say they will enroll in additional courses ortraining.3
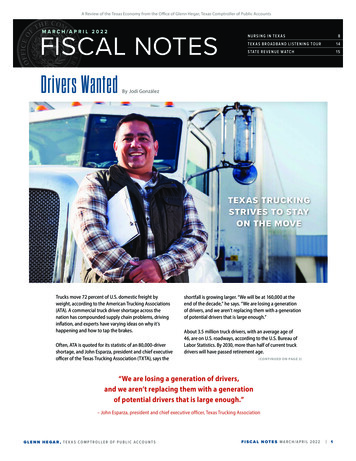
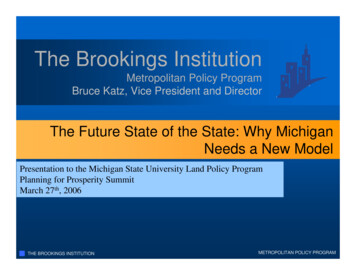
WHO ARE THEY?Many state policies are focused on re-enrolling adults with some college, no degree, butthese policies are often broadly stated and could improve their impact with additionalunderstanding of this population. There is a wide range of experience in terms of whenpeople stopped out, where they had previously been enrolled, and their current incomeand employment status. The adults in the survey were split almost evenly between thetype of institution they had attended, with slightly more having been enrolled at a two-yearinstitution. Highlighting their repeated efforts, about half of these individuals had attendedmultiple postsecondary institutions – one-third had attended two, 12 percent had attendedthree, and 5 percent had attended four or more. While Black and Hispanic students are morelikely to stop out than white students, the majority of college stop-outs are white.4 The raceand ethnicity breakdown of the some college, no degree survey sample was 65 percentwhite, 17 percent Black, 15 percent Hispanic, 1 percent Asian and 2 percent some other raceor ethnicity. About half were earning less than 35,000 per year, one-fourth between 35,000and 60,000, and another fourth 60,000 or more. About two-thirds were employed full-time.National Center for Education Statistics. Status and Trends in the Education of Racial and Ethnic Groups, Indicator 23:Postsecondary Graduation Rates. Accessed Dec. 4, 2019, tor red.asp.44
FIGURE 1 T H E SO M E CO L L E GE , N O DE GR E E P OP UL ATIONType of Institutions Attended52%stopped out ofassociate degreeprograms47%Race/EthnicityNumber of Institutions Attended51%33%12%5%stopped out ofbachelor’s degreeprograms2% 1%1 institution15%2 institutions17%65%3 institutions4 or more institutionsn Whiten BlackIncome Leveln Hispanicn Othern AsianEmployment Status30%25%24%20%15%4%10%8%59%5%5%0%0 to 15,000 15,000 to 35,000 35,000 to 60,000 60,000 to 100,000 100,000n Employed Full Time (Employer)n Unemployedn Employed Full Time (Self)n Not in Workforce5n Employed Part TimeNot in the workforce refers to people who are not working and not looking for work, as opposed to unemployed,who are not working but are seeking work.55
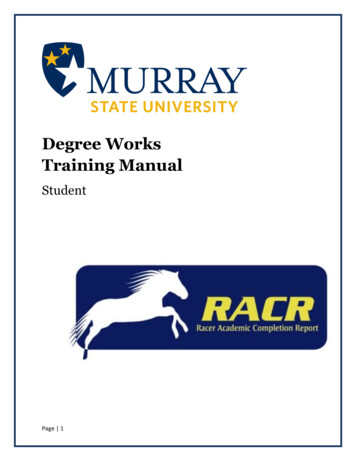
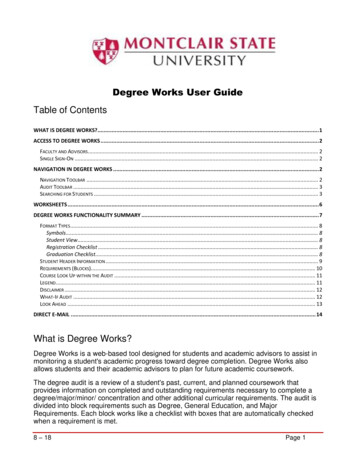
WHY DID THEY STOP OUT?Understanding why people stopped out is key both to re-enrolling as well as increasingretention and preventing future stop-outs. As part of the Strada-Gallup EducationConsumer Survey, an open-ended question was asked about why the respondent tookcollege courses but did not complete a degree. In all, 38,468 adults between the ages of25-64 answered this question. Adults gave many different reasons for why they did notcomplete the degree they started. The most common had to do with the need to work andthe difficulty balancing school and work:What is the main reason you took college courses but did notcomplete a degree?“The main reason was I was trying to work and go to college, and I wasn’t gettinggood grades, so I just stopped going to college. I couldn’t multitask.”“I worked full time and went to school full time. It became too much. I had fourkids at home at the time. It was just too much.”“Family – you have to make money; it’s hard to go to college and make moneyat the same time, especially in nursing school.”Other common reasons cited were financial pressures or other life events or personalchallenges (See appendix for Table 1: What is the main reason you took college coursesbut did not complete a degree?).Stopped out students also may have suffered from a lack of guidance – most did not havegood experiences with academic or career advising while they were enrolled. As seen inFigure 2, more than half (51 percent) of students who had stopped out from a two-yearinstitution rated their academic advising as poor or fair, and 55 percent rated their careeradvising as poor or fair. For those who had stopped out of a four-year institution, 54percent rated academic advising as poor or fair, and 59 percent rated career advising aspoor or fair. In contrast, most adults who attained an associate or bachelor’s degree ratedtheir academic and career advising as good or excellent.6
FIGURE 2Q U A L IT Y O F ADV IS IN G F O R COL L EGE GRAD UATES AN D STUD EN TS WH O D O N OTC O M P L E T E A DE GR E ECareer Advising(completed bachelor’s degree)Career Advising(stopped out of 4-year)Career Advising(completed associates degree)Career Advising(stopped out of 2-year)Academic Advising(completed bachelor’s degree)Academic Advising(stopped out of 4-year)Academic Advising(completed associates degree)Academic Advising(stopped out of 2-year)0%10%20%30%n Poor40%n Fair50%60%n Good70%80%90%100%n ExcellentWHY HAVE THEY NOT RE-ENROLLED?Another open-ended question on the survey asked adults with some college, no degreewhy they are not currently enrolled. This question was answered by 37,101 adults age 25-64.We found that for most people, the reasons they stopped out of college continue to be theprimary barriers to them returning. Those who stopped out because of difficulty balancingschool and work were most likely to say that they are not enrolled because they are alreadyworking and do not have enough time for classes. Those who stopped out due to financialissues are most likely to say that they are not enrolled because of cost. Many times, worriesabout time and cost are bound together – people need money to pay for education, but theyneed to work to have the money and, therefore, do not have enough time.At the same time, a new theme also emerges: About 1 in 5 were simply no longer interestedor did not feel that additional education would benefit them in their career (19 percent).Others express a similar sentiment: They are unsure if school would be worth the investmentof time (11 percent) and money (12 percent), and they have work responsibilities that arepre-eminent (17 percent). (See appendix for Table 2 : What is the main reason you are notcurrently taking college courses?).6Percentages do not sum to 100 as some respondents chose to answer “don’t know” or refused the question.7
What is the main reason you are not currently taking collegecourses?“There’s no need for me to. I own my own business, and I am doing well at it.”“I just don’t feel the need to go. I like the job I have right now, and I don’t need togo to school with what I do.”“Too many bills to pay and I have to work full time and can’t afford to go back until Iget more financially stable.”“I have my family, so I have to pay rent, and I don’t get paid much, so I don’t havetime.”“I want to know which direction I want to go. I don’t want to just go to college to goto college; I want my degree to be towards something that’s useful.”WILL THEY COME BACK?In Strada’s report “Back to School?,” we found that adults with some college, no degreeare no more likely than those who never went to college at all to say that they needadditional education. They are only marginally more likely than other adults withoutdegrees to say that they plan to enroll in postsecondary education within the next fiveyears. Given the priority of the some college, no degree population for many state policiesand institutional efforts, it is worth digging deeper to understand the nuance in likelihoodto enroll within this group.6Across all groups, people said they would be more likely to enroll in courses or trainingoffered by an employer than any other provider. The role of employers has becomeincreasingly paramount given the ever-evolving changes in skills needed to compete.Employers have always been responsible for creating jobs and, to some degree, providingtraining, but there has been a significant shift toward identifying market needs and helpingto ensure that education providers, including employers, are preparing learners to meetthose needs. Given that many of those who have stopped out are working, it makes sensethat they would prefer to re-enroll in courses or training where they are.The question wording was: “On a five-point scale, where 5 means extremely likely and 1 means not at all likely,in the next five years, how likely are you to enroll in courses or training offered through each of the following?”This series of questions was added to the survey in January 2019. The total n for these questions for the somecollege, no degree population is 3,021. After January 2019 this series of questions was only asked of those age 49and younger, so the sample differs from the broader sample in terms of age categories: 38 percent age 25-34, 32percent age 35-44, 21 percent age 45-54, and 10 percent age 55-64. This group is also slightly more likely to bein the workforce than the broader sample (81 percent versus 76 percent). Race and ethnicity, income and type ofinstitution attended were similar to the broader sample.78
Looking at nuances within subpopulations, age is the first distinction found (See Figure 3).Unsurprisingly, younger people were more likely to say they plan to re-enroll.7 While allage groups said they would be most likely to enroll via an employer, the youngest group ofstop-outs had a relatively higher likelihood of enrolling at a community college comparedto older age groups.FIGURE 3SE L F - R E P O RT E D L IK E L IHO O D T O EN ROL L IN COURSES OR TRAIN IN G WITH INF I V E Y E AR S B Y AGEPercentextremelylikely30%25%20%15%10%5%0%25-34n Four-year35-44n Community College45-54n Trade School55-64n Onlinen EmployerThere were distinct differences across racial and ethnic groups as well (See Figure 4). Whiteswere much less likely to report that they would enroll anywhere within the next five years.Likelihood to enroll was more similar among Blacks and Hispanics, with Blacks reportingslightly higher likelihood. All racial and ethnic groups reported the highest likelihood toenroll in courses or training offered by employers, followed by community colleges.FIGURE 4SE L F - R E P O RT E D L IK E L IHO O D T O EN ROL L IN COURSES OR TRAIN IN G WITH INF I V E Y E AR S B Y R ACE AN D E T iten Four-yearn Community CollegeBlackn Trade SchoolHispanicn Onlinen EmployerPrevious Strada research has found that younger people are more likely than older people to consider enrolling ineducation (Strada Education Network. Back to School? Accessed Dec. 4, 2019, ool.). Some older adults report feeling that they are now too old to go back to school and thatcolleges aren’t well designed to serve older students.89
There were also some notable differences in likelihood of re-enrolling by occupation.Figure 5 shows the top 10 occupational categories in which the some college, no degreepopulation is employed, along with the percent who said they were extremely likely toenroll in either community college (the most popular of the four nonemployer types ofacademic providers) or with an employer within the next five years. Those working infood preparation occupations stand out as significantly more likely to enroll in communitycollege than those working in other categories. Health care workers were the most likely tosay they would enroll in additional education and training through their employer.FIGURE 5SE L F - R E P O RT E D L IK E L IHO O D T O EN ROL L IN COURSES OR TRAIN IN G WITH INF I V E Y E AR S B Y CUR R E N T O CCU PATIONFood PreparationManufacturingInstallation, Maintenance and RepairHealth CareConstructionTransportationOffice and AdminSalesManagerBusiness and Finance0%5%10%15%20%25%Percent extremely likelyn Employer10n Community College30%
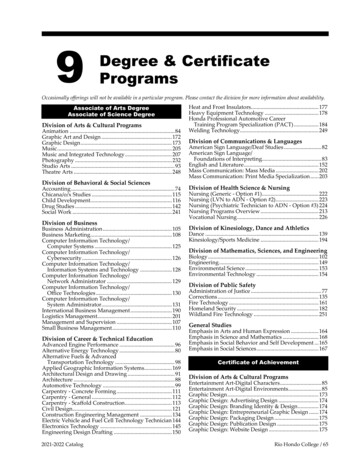
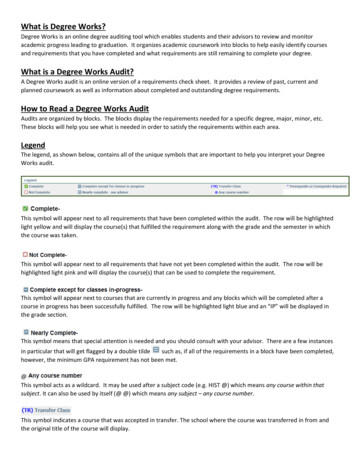
WHAT COULD HELP THEM RE-ENROLL?When asked about a variety of factors that may impact their likelihood to enroll, adults withsome college, no degree said the factors that would have the biggest impact on them werefree community college tuition, courses and training that fit their schedule and a guaranteedemployment outcome, such as a job placement or wage increase (See Figure 7). These threefactors are also the top three among all adults without degrees8 but in a slightly differentorder. The categories, however, are consistent: adults without degrees need career outcomes,affordability and schedule flexibility to enroll.FIGURE 7FA C T OR S IM PACT IN G S E L F - R E P ORTED L IK EL IH OOD TO EN ROL L IN COURSES ORT R A I N IN GHow would each of the following impact your likelihood of enrolling in additional education?Please use a five-point scale where 5 means it would impact your likelihood a great dealand 1 means not at all.Free communitycollege tuition52%11%Courses and training thatfits your schedule47%14%Guaranteed employment outcome(a job placement or wage increase)47%12%43%Low-cost tuitionCourses and training thatemployers need10%35%Locally accessible education andlearning center16%32%Quality online and distancelearning opportunities16%28%Resources and support for childand dependent care22%0%16%6%20%40%60%n 5 “A great deal80%100%n 4Focusing on the top three categories and breaking them apart by occupationreveals interesting nuance in terms of which policies have the biggest impact onwhich groups, as seen in Figure 8. For example, free community college tuitionhas the biggest reported impact on enrollment for those working in office andadministrative, food preparation and transportation occupations; while for thoseworking in health care or manufacturing, guaranteed employment outcomeswould be much more impactful. Those working in sales, management or construction place the most emphasis on schedule flexibility.Strada Education Network. Back to School? Accessed Dec. 4, o-school.911
FIGURE 8FA C T O R S IM PACT IN G S E L F - R E PORTED L IK EL IH OOD TO EN ROL LBY C U R R E N T O CCUPAT IO NOffice and AdminFood PreparationTransportationHealth CareBusiness and FinanceSalesManagerManufacturingInstallation, Maintenance and t Great Deal of Impactn Free community college tuitionn Course and training that fits your schedulen Guaranteed employment outcomeWhen looking at the impact on likelihood to enroll across racial and ethnic groups,compared to whites, people of color report a higher impact for all factors (Figure 9). Thisis consistent with earlier findings that whites report being less likely to enroll in additionaleducation or training. All groups said that free community college tuition would have thegreatest impact on their likelihood to enroll.FIGURE 9FA C T O R S IM PACT IN G S E L F - R E PORTED L IK EL IH OOD TO EN ROL LBY R ACE AN D E T HN ICIT nt Great Deal of Impactn Free community college tuitionn Guaranteed employment outcome12n Course and training that fits your schedule
CONCLUSIONBy speaking directly with individuals who have some college but no degree, we obtainnew insights to guide policy makers and education providers in developing more effectivesolutions to serve these adults. Based on their personal experiences: Difficulty balancing school and work is a key reason people stop out of college.Educational providers need to acknowledge that a high percentage of their studentswill be working and going to school – and provide the flexibility to make it possiblefor these students to do both. Better experiences with higher-quality academic and career advising are linkedwith completion. Students need to see how their education connects to a purpose.Implementing a proactive advising model is one approach that could be taken tobetter support learners. Employers are identified as the most likely pathway for individuals across alldemographic breakdowns of those with some college, no degree to enroll inadditional courses or training. Strategies to meet educational attainment goals willbe more effective as they integrate employers. When considering whether to re-enroll, adults with some college, no degree havethree key needs:– Education must be affordable.– They must be able to fit education into the rest of their lives, including work andfamily.– They want to see a clear career benefit to invest the time and money in furthereducation.To bring back the some college, no degree population, state policymakers and institutions ofhigher education must be more responsive to these individuals’ needs and circumstances.13
APPENDIXTABLE 1What is the main reason you took college courses but did notcomplete a degree?Work-related17%Financial pressure12%Other life event or personal problem11%Just wanted to learn more or didn’t need a degree7%Pregnant or had children7%Classes, degree or school was not a good fit4%Got bored, lost interest or became distracted4%Family obligations4%Personal health reasons3%Didn’t have enough time for classes3%Couldn’t decide on a career or field of study2%Was not mature enough1%Family pressure1%Classes were too difficult1%Deployed1%TABLE 2What is the main reason you are not currently taking collegecourses?14Don’t need it or not interested19%Work-related17%Too expensive12%No time for classes11%Family obligations7%Age6%Personal health problems5%Retired4%Life1%Inconvenient location1%
ABOUT THE STRADA-GALLUP EDUCATION CONSUMER SURVEYResults for the Strada-Gallup Education Consumer Survey are based on telephone surveysconducted from June 2016 through April 2019 with a random sample of more than 340,000respondents aged 18 to 65, living in all fifty U.S. states and the District of Columbia. Thesample includes national adults with a minimum quota of 70 percent cellphone respondentsand 30 percent landline respondents, with additional minimum quotas by time zone withina region. Landline and cellular telephone numbers are selected using random-digit-dialmethods. Landline respondents are chosen at random within each household based on whichmember will have the next birthday.Interviews are conducted in English and Spanish. Samples are weighted to correct forunequal selection probability and nonresponse. The data are weighted to match nationaldemographics of gender, age, race, Hispanic ethnicity, education and region. Demographicweighting targets are based on the most recent current population survey figures for thepopulation aged 18 to 65.All reported margins of sampling error include the computed design effects for weighting.At the 95 percent confidence level, the percentage point margin of error for sample sizeof 42,000 is / 0.6 percent, for 3,000 it is / 2.1 percent. In addition to sampling error,question wording and practical difficulties in conducting surveys can introduce error or biasinto the findings of public opinion polls.Strada Education Network is a national social impact organization dedicated to improvinglives by forging clearer and more purposeful pathways between education and employment.We engage partners across education, nonprofits, business and government to focusrelentlessly on students’ success throughout all phases of their working lives.Learn more about how Strada Education Network is listening to education consumersand compiling the nation’s largest dataset of consumer insights on education experiencesafter high school, as well as collecting insights from employers, alumni and current collegestudents. Visit stradaeducation.org/consumer-insights.15
EDUCATION NETWORKCOPYRIGHT STANDARDSThis document contains proprietary research, copyrighted materials and literary property of Gallup, Inc. and Strada Education Network. This document isof great value to Gallup, Inc. and Strada Education Network. Accordingly, international and domestic laws and penalties guaranteeing patent, copyright,trademark and trade secret protection safeguard the ideas, concepts and recommendations related within this document. No changes may be made tothis document without the express written permission of the parties. Gallup is a trademark of Gallup, Inc. All rights reserved. All other trademarks andcopyrights are property of their respective owners.
good grades, so I just stopped going to college. I couldn't multitask." "I worked full time and went to school full time. It became too much. I had four kids at home at the time. It was just too much." "Family - you have to make money; it's hard to go to college and make money at the same time, especially in nursing school."