Transcription
CONSUMER SURVEYQ4 2012 Video Discovery Trends Report:Consumer Behavior Across Pay-TV, VOD, OTT and Next-Gen Features
CONSUMER SURVEYQ4 2012 Video Discovery Trends ReportIntroductionWhat do consumers want from their pay-TV providers? How do consumers really view their pay-TV providers? What are consumers’ views on new trends andfeatures for improving their viewing experiences? These are three of the many questions Digitalsmiths set out to answer with the Q4 2012 Consumer Surveyand Video Discovery Trends Report. By distilling consumer opinions and behaviors on a quarterly basis, Digitalsmiths tracks trends and continues to improve itspersonalized video discovery platform based on actual consumer needs and wants, and also gives pay-TV providers an unbiased perspective on industry andconsumer trends today.This survey sheds new light on the cord-cutting debate and offers key insights into consumers’ TV viewinghabits and their relationships with service providers. It also reveals huge missed revenue opportunities for pay-TVproviders. The overall picture painted by these results shows not only the need to create a better video discoveryexperience for consumers, but also the opportunity to deliver a solution that meets both the needs of theconsumer and positively impacts revenue. The right solution presents consumers with personalizedrecommendations that include traditional linear TV, VOD and premium content; this also allows pay-TV providersto increase average revenue per user (ARPU) without increasing rates. Let’s face it, other than the big changesaround DVR/recording and the addition of new channels, the overall cable/satellite experience has stayed the samefor far too long. Due to more competition facing pay-TV providers than ever before, coupled with more tech savvygenerations, it’s time for change. These survey results prove this loud and clear.Consumers Surveyed:Over 2,000Geographic Regions:United States, CanadaAges of Respondents:Must be 18 years of ageDigitalsmiths conducts this survey on a quarterly basis and publishes a report evaluating and analyzing keytrends across the pay-TV industry. The importance of this survey is to track consumer trends over time,providing pay-TV providers real, unbiased feedback regarding consumers’ behaviors, perception ofthe industry and views of new technology hitting the market.2
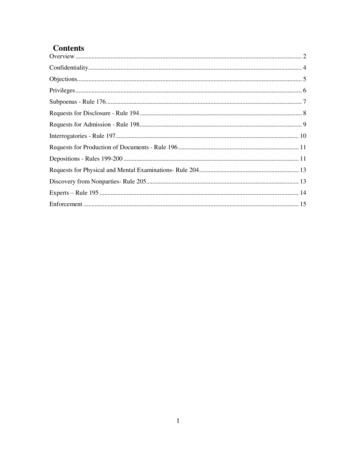
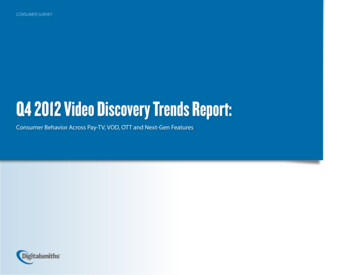
CONSUMER SURVEYQ4 2012 Video Discovery Trends ReportThe Pay-TV Providers: From the Eye of the ConsumerWith all the noise about cord-cutting and threats posed by alternative services for watching TV shows and movies, we wanted a better understanding ofconsumers’ perceptions of their pay-TV providers. When questioned about the value received from their pay-TV provider, 81% were satisfied or very satisfied.However, this does not mean that there isn’t work to be done. Of these respondents, 38% potentially want to make changes in the next six months. So, what doesthis mean for pay-TV providers?APPSPay-TV providers have no choice but toDo you have any of the following TV or 2nd screen appsdownloaded on your iPad/tablet (choose all that apply):invest in new technology to improvethe discovery and viewing experience inorder to keep existing subscribers and16.4%HBOGosave their “on-the-fence” subscribers.4.7%FanhattanAccording to our numbers, OTT solutions3.8%Zeeboxaren’t an enormous threat with 65%14.0%of respondents not using them at %IntoNowhowever it’s important to keep a closeeye on the services being offered, andunderstand why and how consumers usethose services.Hulu65.1%None5.0%Other3
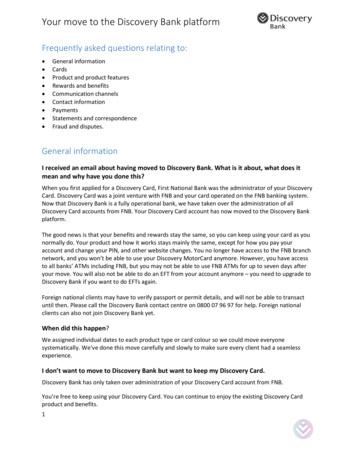
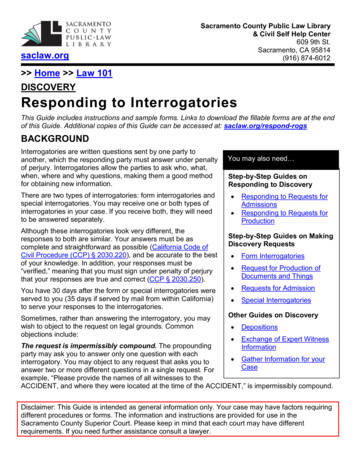
CONSUMER SURVEYQ4 2012 Video Discovery Trends ReportTOTAL MONTHLY BILLConsumers are begging for a better experience. Over 50% of the respondentssaid they would consider keeping their existing cable/satellite service if it waseasier to find something to watch on TV. Now more than ever, consumers areHow much is your total monthly bill from your cable/satelliteprovider for all major services used such as tv, internet, phone?(not including video-on-demand/movie purchases)19.9%faced with hundreds of channels, but the grid/channel guide has yet to be20.3%16.6%16.4%improved. In other words, providers offer more content, but they haven’t17.9%changed the discovery experience at all. Due to the cumbersome process ofscrolling through hundreds of channels, consumers find difficulty seeing value8.9%in their viewing options. 50However, a fine line exists in improving the experience without it costing the 51 75 76 100 101 125 126 150 150 consumer. With 44% paying more for their monthly bill than 12 months ago, afee increase isn’t the answer. Premium channels was the number one servicePROVIDERadded, beating out non-TV sources such as phone and internet; however, it wasWho is your current cable/satellite service provider?also the top service cut with 20% more cut versus added. This proves consumersare willing to pay more to find something they “want” to watch, but don’tsee value in the premium channel services offered today. Therefore, pay-TVproviders must improve the overall experience in order to keep currentsubscribers and capitalize on the upsell opportunity with the 60% of consumerswho plan to stay with their current provider. This is a win-win: generating newrevenue for pay-TV providers and allowing consumers to be able to find whatCox CommunicationDIRECTVAT&T U-verseInsight Communications CompanyShawTELUSComcast CorporationTime Warner CableSuddenlink CommunicationsMediacom Communications CorporatiionRogers Cablethey “want.” Improvements must be implemented the “right” way, however.OtherDISH NetworkVerizonCharter CommunicationsBright House NetworksBellCablevision Systems Corporation4
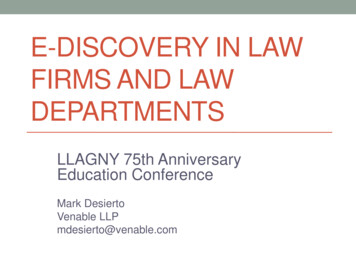
WHITE PAPERQ4 2012 Consumer Survey and Video Discovery Trends ReportVALUEPLAN TO CHANGE PROVIDERSSERVICE ADJUSTMENTHow would you rate the level of value you are receivingfrom your cable/satellite service provider?Do you plan to change cable/satellite providers in thenext six months?Have you adjusted your level of cable/satellite servicein the last 12 months?VERY SATISFIED 21.8%59.5%SATISFIED68.6%Stayed the sameUNSATISFIED 18.7%27.6%If unsatisfied, why do you feel you’re notgetting enough value from your provider?(choose all that apply)Increasing fees73.8%36.7%Poor cable/tv service23.3%Poor internet service37.9%Bad channel selectionOther17.2%Increased/Added Services60.7%60.7%27.6%4.1%6.1%1.5%1.5%NO, plan to STAY with current cable/satellite providerMAYBEYES, planning to SWITCH to an online app or6.1%4.1%YES, planning to CHANGE cable/satellite providersYES, planning to CUT cable/satellite servicerental service instead of a cable/satellite service14.3%BILL AMOUNTIs your cable/satellite bill less now than what you werepaying 12 months ago?MORE than 12 months ago44.4%SAME AMOUNT36.7%LESS than 12 months ago18.9%If yes, would you consider keeping yourexisting service if your provider releasednew functionality that made it easier foryou to find something to watch? (Forexample, if you had shows recommendedto you based on your interests so it is easierto find something you “want” to watchon TV)Decreased/Removed ServicesIf Decreased, whatservice(s) did you cut?Premium Channels67.3%Cable/Satellite therIf Increased, whatservice(s) did you add?48.9%Premium ChannelsInternet55.7% say14.2%DVRPhoneOther28.2%22.3%17.8%21.4%5
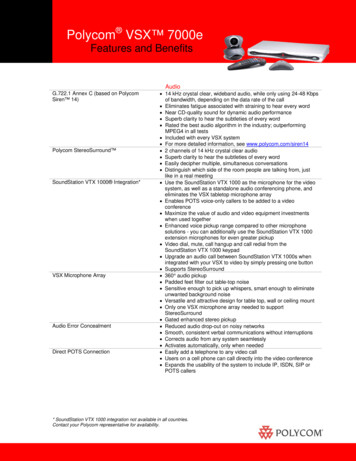
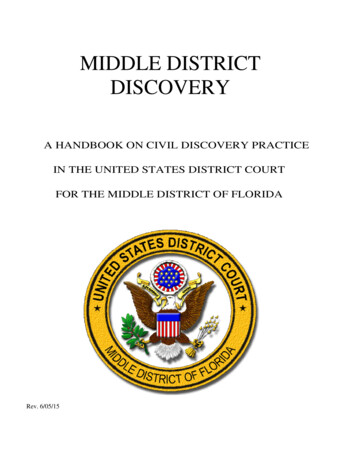
CONSUMER SURVEYQ4 2012 Video Discovery Trends ReportConsumer TV Viewing HabitsIn addition to understanding how pay-TV providers are viewed by the average consumer, knowing how consumers watch TV is key in improving the experience.These survey results confirm many industry assumptions while debunking others. Consumers watch less TV than one might have guessed, but the inordinateamount of time they spend channel surfing comes as no surprise. Over 50% of consumers surveyed spend over 10 minutes a day channel surfing, and almost25% spend over 20 minutes. In these 20 minutes, the consumer does not enjoy his or her pay-TV service or engage with content and/or advertising. The bulkof consumers also watch the same 4-8 channels out of the hundreds for which they pay, which negatively impacts the consumer’s perceived value of theirpay-TV service.Another surprising survey result was that over half of respondents spent less than 10% of their TV viewing timewatching recorded/DVR’d content, which means most consumers channel surf or scroll through the guide in orderto find something to watch when they turn on the TV. Therefore, pay-TV providers have a huge opportunity toinfluence the decisions of their subscribers.The bulk of consumerswatch the same 4-8channels out of theThese stats on TV viewing habits further strengthen the case for improving the video discovery experience.By delivering a better discovery experience, pay-TV providers will decrease the amount of time spent channelsurfing and increase the consumer-time spent engaged with the content. Additionally, these discoveryhundreds for whichthey pay.experiences expose consumers to content they will enjoy outside of their normal 4-8 channels. This helpsthem re-discover the value of pay-TV services, resulting in improved satisfaction levels.6
WHITE PAPERQ4 2012 Consumer Survey and Video Discovery Trends ReportWATCHING TVCHANNEL SURFINGHow many hours a day do you watch TV?How much time a day do you spend searching (channel surfing) or scrollingthrough the guide looking for something to watch?7.8% 1 hour21.2%1-2 hours2-3 hours17.4%16.2%5 hours11.6%20-30 minutes5.8%30-40 minutes10.5%4-5 hours29.1%10-20 minutes27%3-4 hours47.6% 10 minutes40-50 minutes2.9%60 minutes3.1%WATCHING DVRVARIETYIn an average week, what percentage of your TV viewing time is spent watchingshows that you have recorded/DVR’d?Do you feel you watch the same channels over-and-over again?13.3% 20%of viewing timeYES59.3%of viewing time20% - 40%86.7%NO12%30.1%40% - 60%of viewing time24.7%10.1%16% 60%of viewing timeIf yes, how many channelsdo you typically watch?15.8%11.4%18.6%2.1%0-22-44-66-88-1010 7
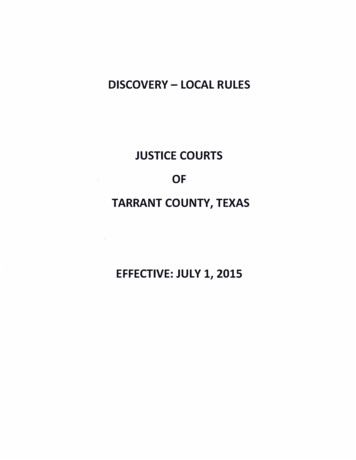
CONSUMER SURVEYQ4 2012 Video Discovery Trends ReportThe Missed Revenue OpportunitiesWhile the survey results show that the cord-cutting phenomenon is not as severe as some have claimed, pay-TV providers should still be concerned about the threatOTT services pose. Based on our results, most consumers don’t look to OTT solutions as a replacement for cable, but as a supplement which cuts into pay-TVproviders’ bottom lines, especially in the form of lost VOD revenue.Despite pay-TV providers’ heavy investments in their VOD catalogs and the marketing of these services, VOD revenues continue to disappoint. When asked howmany VOD purchases made from their service providers’ catalogs every month, 78% of respondents said zero and only 10.5% made two or more purchases. This isnot to say, however, that a portion of consumers never watch movies on-demand.Roughly half of consumers surveyed used Redbox, Netflix, Vudu, Amazon, Blockbuster, iTunes or another similar service. Of those using these services, over halfwatched/purchased 1-3 movies per month. Every month, therefore, pay-TV providers miss out on roughly 3 - 15 per subscriber across half of their subscriber base,representing millions in lost revenue. By improving the video discovery experience, the number of subscribers purchasing movies on-demand from their pay-TVproviders will dramatically increase over the ratio shown by these survey results. For example, if half of a provider’s 1 million subscribers made two monthly VODpurchases at 3 each, the provider would generate an additional 36 million annually.Why do consumers go elsewhere to watch movies on-demand? When asked, respondents cited convenience, selection, price and ease of finding a movie. In aseparate question asking respondents if they thought finding a movie they would enjoy in their providers’ VOD catalogs is easy, half answered no. The fact thatsome consumers think driving to a Redbox kiosk or renting movies online and waiting for them to arrive is more convenient than renting a movie from their couches speaks to the urgent need to improve the experience, and reveals the massive revenue opportunity pay-TV providers are missing. Later in the report, we addresshow this problem can be improved in parallel with other issues uncovered by the survey.8
WHITE PAPERQ4 2012 Consumer Survey and Video Discovery Trends ReportPREMIUM CHANNELSVODVOD CATALOG SEARCHDo you pay for any of the following premium channels?(choose all that apply)How many Video-on-Demand (VOD) purchases do youmake on average each month? (Movies purchased fromon-demand stations on TV. Does NOT include Netflix,Redbox, iTunes, etc.)Do you feel it’s easy to find amovie you will enjoy in the VODcatalog provided by your cable/satellite provider? (accessedfrom your 8%NoneOther2 5.1%78%69.7%3.6%49% say NO1-216.9%MOVIE RENTAL SERVICESDo you use any other movie rental services? (choose allthat e231.3%AmazonOther10.5%26.6%NetflixVuduHow many rentals/purchases do you makeeach month using these services?11.4%156 5.7%4.5%54.3%19.1%41.6%Convenience21.1%4Why do you use these movie rental services over the VODoptions available through your cable/satellite service?(choose all that apply)32.2%62.9%Cheaper33.3%Better SelectionEasier to find whatyou’re looking forOther27.7%7.7%9
CONSUMER SURVEYQ4 2012 Video Discovery Trends ReportThe Answer to Consumer Demand for a Better Experience:A Personalized Video Discovery PlatformWith 67% of respondents stating that they get frustrated “always” or“sometimes” when trying to find something to watch, it is evidentFINDING SOMETHING TO WATCHthe consumer experience needs to change. However, the mainHow often do you get frustrated when trying to findsomething to watch on TV?challenge to overcome is how can pay-TV providers improve thediscovery experience without it being a capital expenditure.Always10.4%57.6%A personalized video discovery platform makes it easier forconsumers to find relevant content. By filtering all available live TVDo you ever have troublefinding something to watchthat multiple members of yourhousehold will enjoy?Alwaysand on-demand options by consumers’ preferences, relevant,8.5%50.7%revenue-generating content once buried in the linear guide andVOD catalog surfaces. Most of these are relatively new conceptspresented to consumers, but were well-received by respondents.The following pages break down each feature, how consumersSometimesresponded to it, and how it improves the overall video r10
CONSUMER SURVEYQ4 2012 Video Discovery Trends ReportPersonalized SearchSixty-one percent of respondents said they do not use theirMood-Based Discoveryproviders’ search functionality; however, of those 61%, 57%Sixty-two percent of consumers stated they would like the abilitywould use search if the feature were easier to navigate.to find TV shows/movies based on their mood. The right discoveryBefore implementing a search solution, it’s important to thinkabout the level of data needed to guarantee the accuracy of asearch feature. From a consumer’s perspective, nothing is morefrustrating than inaccurate search results. To ensure the highestlevel of accuracy, the search functionality should rely on deepsolution allows consumers to filter available content by categoriessuch as, “mood,” “theme,” “subject,” “setting,” and “time-period”. Lookingat the survey results for search, recommendations and mood-baseddiscovery, it’s evident consumers clearly want more than one optionto find content.intelligence about the video content including scene-leveland asset-level data.MOOD-BASED DISCOVERYPERSONALIZED SEARCHDo you ever type in a TV show, movie title, or topic into asearch box to find something to watch?YES38.3%If no, would you use searchfunctionality if it was easy to use?NO61.7%57.5% SAY YESWould you like the ability to find something to watch based on themood you’re in? (For example, search shows/movies if you’re in themood for a light-hearted comedy)YESNO37.8%62.2%11
CONSUMER SURVEYQ4 2012 Video Discovery Trends ReportPersonalized RecommendationsEighty-seven percent of respondents stated their cable/satellite provider does not recommend TV shows/movies tothem. In addition, almost half of those respondents said they would like recommendations based on their interests,Eighty-seven percentpast viewing habits, etc. When asked about the channel guide, 63% prefer recommendations that match their personalof consumers stated thatpreferences or interests. Again, it is time to improve the discovery experience. However, in order to be seen as helpfultheir cable/satelliteand not an annoyance to consumers, recommendations must be personalized, and powered by implicit and explicitprovider does notviewer data similar in usage to the search function.recommend TV showsNot only the single consumer demands a better discovery experience, but also a group or a family; 58% have troublefinding something for the group to watch. Therefore, implementing a personalized search and recommendationsor movies to them.platform that blends profiles, and easily adds new ones helps to recommend relevant content for mom and dad ormom, dad and son. The right solution filters all sources of available video content, blending linear, VOD, premium andonline content catalogs by a user’s or group’s viewing preferences, therefore recommending the most relevant TVshows, movies and live events, regardless of channel.PERSONALIZED RECOMMENDATIONSDoes your cable/satellite provider make personalized recommendations to you? (When you turn onthe TV, are you presented with recommendations based on your interests, past viewing habits, etc.)N/ANO87%YESIf no, would you like the option to see personalizedrecommendations based on shows available at aparticular time, regardless of channel?42% SAY YESWould you like yourchannel guide to showyou what’s on/availablebased on your personalpreferences/interestsfirst including all content(movies, live events, TVshows, etc.?63.5% SAY YES12
CONSUMER SURVEYQ4 2012 Video Discovery Trends ReportSocial TrendingAt 69%, the bulk of respondents don’t post on social networks, such as Twitter and Facebook, about the TV shows/movies they watch. In addition,social buzz regarding TV shows/movies does not influence their decision to watch content. These numbers might come as a shock to some due toall the hype surrounding social networks in general. However, this does not shock Digitalsmiths for a few reasons. First, we feel this will remain lowuntil an intergration is done within the cable/satellite platforms that enables consumers to update their status or tweet straight from their TV.Secondly, the demographic using social networks must catch up with the much larger TV subscriber demographics.However, do not let these numbers affect the social efforts on your priority list. We believe you will see a dramatic increase in the adoption of socialfeatures when pay-TV providers offer a video discovery platform with a seamless integration into users’ social networks.BUZZDo you ever choose to watch a TV show or movie because of all the buzz it’s getting on Facebook, Twitter,and other social networks?80.2% SAY NO19.8%SAY YESDo you post about what you’rewatching on social networkssuch as Twitter, Facebook, etc?14% SAY YES13
CONSUMER SURVEYQ4 2012 Video Discovery Trends ReportBusiness RulesThe remaining question is how can pay-TV providers increase ARPU and generate new revenue to pay for new video discovery features?Personalized video discovery platforms must support the ability to create rules that strategically control the output of search results, personalizedrecommendations, and browsing experiences in order to meet the pay-TV provider’s business needs and revenue goals. This functionality allowsproviders to up-sell and cross-sell premium content and services on a personalized, targeted level.Here are a few examples of how Digitalsmiths Seamless Discovery Business Rules Engine has been leveraged to drive revenue:Premium Content Promotion: A rule can be created to target frequent viewers of “The Ultimate Fighter,” the weekly series on FX, with asponsored recommendation for an upcoming UFC Pay-Per-View event.Video On Demand Promotion: A rule can be created to deliver sponsored recommendations for “Sherlock Holmes: A Game of Shadows”to subscribers who are fans of Robert Downey, Jr., the film’s starring actor.New Series Promotion: A rule can be created to promote the Discovery Channel’s new show “Gold Rush: The Jungle” to frequent viewersof similar shows, such as “Deadliest Catch,” the Discovery Channel series on Alaskan king crab fishermen.14
CONSUMER SURVEYQ4 2012 Video Discovery Trends ReportKey TakeawaysThe hype surrounding cord-cutting is mostly just that: hype. Most consumers don’t plan to disconnect their pay-TV services anytime soon. However,pay-TV providers must implement improvements to the consumer experience quickly in order to save on-the-fence consumers and stay ahead of theOTT competition.Over 50% of respondents spend more than 10 minutes channel surfing every day but watch only 4-8 channels. Also, with 67% stating they get frustrated“always” or “sometimes” when trying to find something to watch, it is evident the video discovery experience needs to change in order to improveconsumer engagement and satisfaction.Pay-TV providers lose millions in VOD revenue to other movie rental services. By implementing a personalized video discovery platform that makesit easier and more convenient for consumers to find VOD titles they’ll enjoy, providers can not only reclaim, but also increase VOD revenue. To giveconsumers the experience they want, providers need to offer alternatives to the linear channel grid for finding content. The ideal platform blends liveTV and VOD catalogs and surfaces relevant TV shows and movies based on consumer’s viewing preferences.In addition to making consumers happier, a personalized video discovery platform with business rules functionality generates new revenue streams forpay-TV providers, ensuring this technology will not be a capital expenditure, but a revenue generator. It’s a win-win!Click here to learn more about Digitalsmiths Seamless Discovery platform.About UsGuided by the belief that consumers should not have to work to find relevant content—the content should find them—Digitalsmiths provides the industry’s most comprehensivevideo discovery platform, offering personalized search, recommendations and browsing, social trending, mood-based recommendations, and a business rules engine for allconnected devices. Built for service providers, content providers and consumer electronics manufacturers, Digitalsmiths Seamless Discovery enables personalized discoveryexperiences that instantly connect consumers to the most relevant movies, TV shows and live events available, at any time, on any screen.Digitalsmiths serves customers across all media channels and devices including Cisco, Warner Bros., Paramount, Technicolor, Turner Sports, the NBA, the PGA and NASCAR.Digitalsmiths is privately held and backed by .406 Ventures, Aurora Funds, Chrysalis Ventures, Cisco and Technicolor.Copyright Digitalsmiths. All Rights Reserved.15
Do you plan to change cable/satellite providers in the next six months? 60.7% 27.6% 1.5% 6.1% 4.1% NO, plan to STAY with current cable/satellite provider MAYBE YES, planning to SWITCH to an online app or rental service instead of a cable/satellite service YES, planning to CHANGE cable/satellite providers YES, planning to CUT cable/satellite .