Transcription
EC09CH11-RayARI28 April 201714:54V I E WANI NC ESRED V AConflict and DevelopmentDebraj Ray1,2 and Joan Esteban31Department of Economics, New York University, New York, NY 10012;email: debraj.ray@nyu.ed2Department of Economics, University of Warwick, Coventry CV4 7AL, UK3Institut d’Anàlisi Econòmica (IAE-CSIC), Barcelona 08193, Spain;email: joan.esteban@gmail.comAnnu. Rev. Econ. 2017. 9:263–93KeywordsThe Annual Review of Economics is online ateconomics.annualreviews.orgeconomic development, social conflict, inequality, civil war, ethnic 061109-080205Abstractc 2017 by Annual Reviews.Copyright All rights reservedJEL codes: H56, O10, O15, O43, P16In this review, we examine the links between economic development and social conflict. By economic development, we refer broadly to aggregate changesin per capita income and wealth or in the distribution of that wealth. By socialconflict, we refer to within-country unrest, ranging from peaceful demonstrations, processions, and strikes to violent riots and civil war. We organize ourreview by critically examining three common perceptions: that conflict declines with ongoing economic growth; that conflict is principally organizedalong economic differences rather than similarities; and that conflict, mostespecially in developing countries, is driven by ethnic motives.263
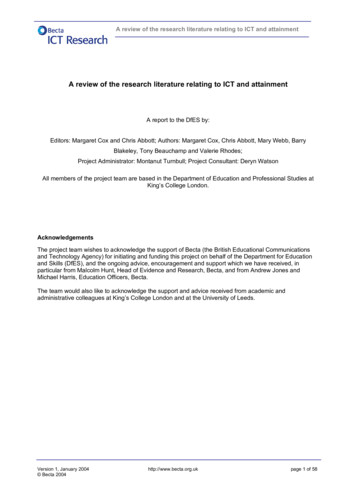
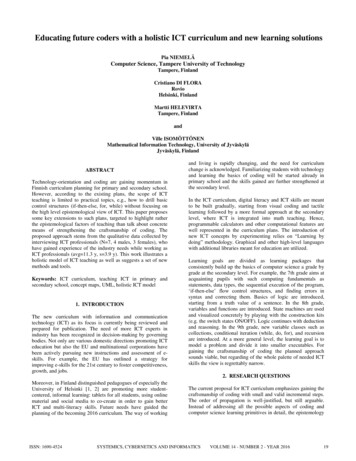
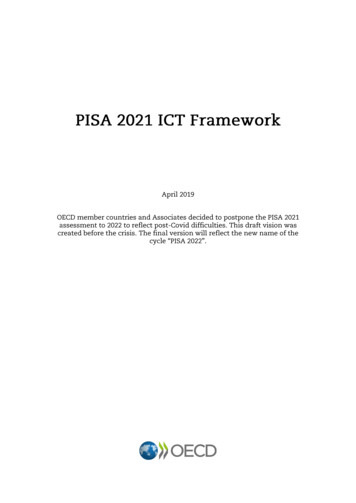
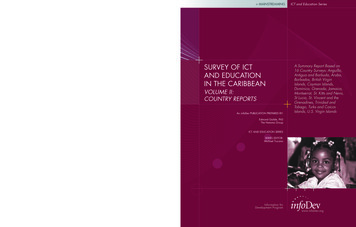
EC09CH11-RayARI28 April 201714:54“No society is immune from the darkest impulses of man.”—Barack Obama, New Delhi, India, January 27, 20151. INTRODUCTIONIn this review, we examine the links between economic development and social conflict. By economicdevelopment, we refer broadly to aggregate changes in per capita income and wealth or in thedistribution of that wealth. By social conflict, we refer to within-country unrest, ranging frompeaceful demonstrations, processions, and strikes to violent riots and civil war. In whatever formit might take, the key feature of social conflict is that it is organized: It involves groups and isrooted—in some way or form—in within-group identity and cross-group antagonism.1Our review is organized around the critical examination of three common perceptions: that conflict declines with ongoing economic growth; that conflict is principally organized along economicdifferences rather than similarities; and that conflict, most especially in developing countries, isdriven by ethnic motives. Although these perceptions are not necessarily wrong, they are oftenheld too closely for comfort; hence the qualification “critical” in our examination.Within-country conflicts account for an enormous share of the deaths and hardships in theworld today. Since World War II, there have been 22 interstate conflicts with more than25 battle-related deaths per year; 9 of these conflicts have killed at least 1,000 people over theentire history of the conflict (Gleditsch et al. 2002). The total number of attendant battle deathsin these conflicts is estimated to be around 3 to 8 million (Bethany & Gleditsch 2005). The verysame period has witnessed 240 civil conflicts with more than 25 battle-related deaths per year, andalmost half of these conflicts killed more than 1,000 people (Gleditsch et al. 2002). Estimates ofthe total number of battle deaths in these conflicts are in the range of 5 to 10 million (Bethany &Gleditsch 2005). To the direct count of battle deaths, one would do well to add the mass assassination of up to 25 million noncombatant civilians (Center for Systematic Peace, http://www.systemicpeace.org/inscrdata.html) and indirect deaths due to disease and malnutrition, whichhave been estimated to be at least four times as high as violent deaths cd7/unhcr-global-trends-2015.html), not to mention the forceddisplacements of 60 million individuals by 2015 (UNHCR 2015).2 In 2015, there were 29 ongoingconflicts that had killed 100 or more people in 2014, with cumulative deaths for many of themclimbing into the tens of thousands. Figure 1 depicts global trends in inter- and intrastate conflictand Figure 2 the distribution of these conflicts over the world regions.Of course, things were probably worse in the past. For instance, Steven Pinker’s book TheBetter Angels of Our Nature (Pinker 2011) is a delightfully gruesome romp through the centuries inan effort to show that violence of all forms has been on the decline. And he is undoubtedly correct:Compared to the utter mayhem that prevailed in the Middle Ages and certainly earlier, we aresurely constrained—at least relatively speaking—by mutual tolerance, the institutionalized respectfor cultures and religions, and the increased economic interactions within and across societies. Tothis one must add the growth of states that seek to foster those interactions for the benefit of1That is not to argue that individual instances of violence, such as (unorganized) homicide, rape, or theft, are unimportant,and indeed, some of the considerations discussed in this review potentially apply to individual violence as well. But socialconflict has its own particularities, specifically, its need to appeal to and build on some form of group identity: religion, caste,kin, or occupational or economic class. In short, social conflict lives off of both identity and alienation.2Such displacements also have a high cost in lives due t endemic sicknesses the newly settled population is not immune to (seeCervellati & Sunde 2005, Montalvo & Reynal-Querol 2007).264Ray·Esteban
EC09CH11-RayARI28 April 201714:54Armed conflict by type (1946–2015)ExtrastateInterstateInternationalized intrastateIntrastate60Number of 9480194610YearFigure 1Armed conflicts by type, 1946–2015. Conflicts include cases with at least 25 battle deaths in a single year. Figure taken from Melanderet al. (2016).their citizens and that internalize the understanding that violence—especially across symmetricparticipants—ultimately leads nowhere.And yet, it is not hard to understand why this sort of long-run celebration seemingly flies inthe face of the facts. We appear to live in an incredibly violent world. Not a day appears to goby when we do not hear of some new atrocity: individuals beheaded, planes shot from the sky,suicide bombings of all descriptions, mass killings, and calls to even more escalated violence. True,perspective is important: We did not live a century ago, nor in the Middle Ages, nor in the earlydays of Christendom. Nor did those eras have access to the Internet, where each act of savagerycan be played on YouTube or by media outlets specializing in breaking news. With the calmafforded by a longer historical view, a perspective that Pinker correctly brings to the table, we canplace our tumultuous present into context.What today’s violence does show, however, is that there are limits to peace and civility as long asthere are enormous perceived inequities in the world, and, as we try to argue in this review, high onthat list of perceived inequities are economic considerations. Even the most horrific conflicts, thosethat seem entirely motivated by religious or ethnic intolerance or hatred, have that undercurrentof economic gain or loss that flows along with the violence, sometimes obscured by the moregruesome aspects of that violence but never entirely absent. From the great religious struggles ofthe past to modern civil wars and ethnic conflicts, we can see—if we look hard enough—a battlefor resources or economic gain: oil, land, business opportunities, or political power (and politicalpower is, in the end, a question of control over economic resources).This sort of economic determinism is unnecessarily narrow to some sensibilities, and perhapsit is. Perhaps conflict, in the end, is a “clash of civilizations” (Huntington 1996), an outcome ofwww.annualreviews.org Conflict and Development265
EC09CH11-RayARI28 April 201714:54Armed conflict by region (1946–2015)EuropeAmericasMiddle EastAfricaAsia60Number of 9480194610YearFigure 2Armed conflicts by region, 1946–2015. Conflicts include cases with at least 25 battle deaths in a single year. Figure taken fromMelander et al. (2016).simple ethnic hatred, or the unfortunate corollary of a religious or ideological dogma. Perhaps, butthat sort of reasoning is incomplete. Is anti-Semitism a fundamental construct; or is racism just aprimitive abhorrence of the Other; or is the caste system born from some primeval, intrinsic desireto segregate human beings? In all of these queries, there is a grain of truth: Anti-Semitism, racism,or ethnic hatred is deeply ingrained in many people, perhaps by upbringing or social conditioning.Often, we can get quite far by simply using these attitudes as working explanations to predict theimpact of a particular policy or change (and we do so in Section 5). But stopping there preventsus from seeing a deeper common thread that, by creating and fostering such attitudes, there aregains to be made, and those gains are often economic. By following the economic trail and askingcui bono?, we can obtain further insights into the origins of prejudice and violence that will—at thevery least—supplement any noneconomic understanding of conflict.This review, therefore, asks the following questions:1. How is economic prosperity (or its absence) related to conflict? What is the connectionbetween economic development and conflict? Does economic growth dampen violence orprovoke it?2. Is the main form of economic violence between the haves and the have-nots? Is conflict bornof economic similarity or difference?3. Is there evidence for the hypothesis that “ethnic divisions”—broadly defined to includeracial, linguistic, and religious differences—are a potential driver of conflict? And if so, doesthis rule out economic motives as a central correlate of conflict?266Ray·Esteban
EC09CH11-RayARI28 April 201714:542. THREE COMMON PERCEPTIONS ABOUT CONFLICTWe organize the themes of this review around three common perceptions.2.1. Perception 1: Conflict Declines with Per Capita IncomePerhaps the most important finding of the literature on the economics of conflict is that per capitaincome is systematically and negatively correlated with civil war, whether one studies “incidence”or “onset.” This is a result that appears and reappears in the literature, especially in large-scalecross-country studies of conflict (see, e.g., Collier & Hoeffler 1998, 2004a,b; Fearon & Laitin2003a; Hegre & Sambanis 2006).Yet even this seemingly robust finding is fraught with difficulties of interpretation. Althoughthere is no doubting the correlation between these two variables, there is also little doubt thatcountries with a history of active conflict are likely to be poor or that there are omitted variables,such as the propping up of a dictatorship by international intervention or support, that lead to bothconflict and poverty. There are also issues of conceptual interpretation that we discuss in Section 3.The argument we make in this review is that economic development is intrinsically uneven. That tranquil paradigm on which generations of economists have been nurtured—balancedgrowth—must be replaced by one in which progress occurs in fits and starts via processes in whichone sector and then another takes off, to be followed by the remaining sectors in a never-endinggame of catch-up. Thus, it is often the case that overall growth is made up of two kinds of changes:one that creates a larger pot to fight over, and therefore increases conflict, and another that raisesthe opportunity cost to fighting, and therefore decreases conflict. Whether conflict is positively ornegatively related to growth will therefore depend on the type of growth, specifically, how uneven itis across sectors or groups. Cross-country studies are too blunt to pick these effects up in any detail.2.2. Perception 2: Conflict Is Created by Economic Difference,Rather Than SimilarityThe great revolutions of the twentieth century were born of economic difference and of the realization that a relatively small elite reaped most of the rewards while a large, struggling proletariatsuffered under a disproportionately small share of the pie. The traditional literature on crisis andrevolution, in which the contributions of Karl Marx are central, focuses nearly exclusively on classconflicts. More recently, Piketty (2014) documents the rise of economic inequality in the secondhalf of the twentieth century. Movements such as Occupy have rehighlighted the awareness ofeconomic differences and the connections between those differences and social unrest.And yet, there are eerie lines along which conflict occurs across economically similar, ratherthan different, groups. This conflict is over resources that are explicitly and directly contested:a limited pool of jobs (e.g., natives versus immigrants), the same customers (business rivalriesacross organized groups), or scarce land. Because the conflict is over the direct use of a resource,the groups are often remarkably similar in their economic characteristics, although there areexceptions to this rule.3 The gains from conflict are immediate: The losing group can be excludedfrom the sector in which it directly competes with the winners.This is the second theme of our article. It leads naturally to the view that ethnicity is possiblya marker for organizing similar individuals along opposing lines, which takes us to our third andfinal perception.3For instance, the land acquisition debates in India feature very different groups because buyers and (potential) sellers see theland as being put to very different uses.www.annualreviews.org Conflict and Development267
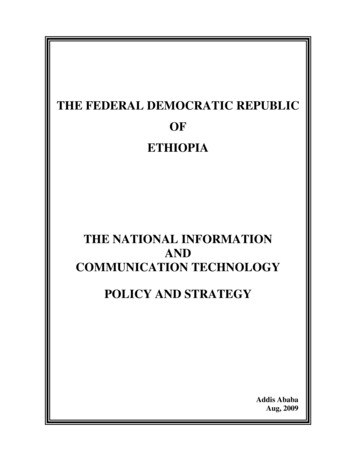
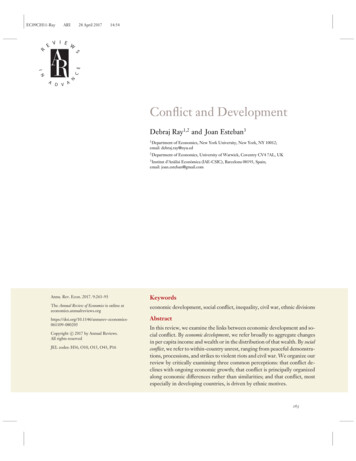
EC09CH11-RayARI28 April 201714:542.3. Perception 3: Conflicts in Developing Countries Are Basedon Ethnic DifferencesConflicts in postcolonial developing countries, although certainly not immune to the gravitationalpull of class, have often been organized along ethnic lines. Specifically, many conflicts appear to belargely ethnic, geographical, and religious in nature, whereas outright economic class struggle isrelatively rare. Indeed, as noted by Fearon (2006), 100 of the 700 known ethnic groups participatedin rebellions over the period 1945–1998. Observations such as these led Horowitz (1985, p. 92),a leading researcher in the area of conflict, to remark that “in much of Asia and Africa, it is onlymodest hyperbole to assert that the Marxian prophecy has had an ethnic fulfillment.”This perception is the subtlest of all to analyze. The facts, as laid down by Horowitz andothers, are certainly correct. But there are two puzzles to confront. First, if conflicts are ethnic,then “ethnic divisions” must somehow bear a strong statistical relationship to conflict. It turns outthat the answer to this question is somewhat involved and, in part, fundamentally rests on a properconceptualization of what “ethnic divisions” entail. Second, if such a result were indeed to be true,how would one interpret it? One approach is based on the primordialist position that at the heartof all conflicts is intrinsic hatred and that conflict is a Huntingtonian “clash of civilizations.” Asecond approach instrumentalist: Noneconomic divisions can be and frequently are used to obtaineconomic or political gains by violent means, often through exclusion.And this takes us back to Perception 2. Nothing dictates that the groups in conflict must beeconomically distinct. Indeed, we have argued the contrary. If two groups are very similar economically, it is more likely that they will intrude on each other’s turf: The motives for exclusion andresource grabbing—and therefore for violence—may be even higher. In such situations, organized violence will necessitate the instrumental use of markers based on kin, religion, geography,and other possibly observable differences, in a word, on ethnicity. In short, there is no contradiction between the use of noneconomic markers in conflict and the view that conflict may be drivenby economic forces.43. ECONOMIC DEVELOPMENT AND CONFLICTSystematic empirical studies of conflict begin with the work of Collier & Hoeffler (1998, 2004a)and Fearon & Laitin (2003a). These are cross-sectional studies (presumably) aimed at establishingthe correlates of civil war, though causal interpretations have all too readily been advanced. Perhapsthe most important finding from this literature is that conflict is negatively related to per capitaincome. In this section, we discuss alternative interpretations of this finding, but we also criticallyexamine the finding itself.3.1. The Empirical FindingCollier & Hoeffler (1998, 2004a) and Fearon & Laitin (2003a) observe that per capita income andconflict are significantly and negatively correlated. Table 1 reproduces the central table used byFearon & Laitin (2003a). They study the onset of “civil war,” which they define as (a) “fightingbetween agents of (or claimants to) a state and organized, nonstate groups,” having (b) a yearlyaverage of at least 100 deaths, with a cumulative total of at least 1,000 deaths and (c) at least4Economic similarity across groups is just one of many possible arguments for the salience of ethnic violence. See Section 5.3for a more detailed discussion.268Ray·Esteban
EC09CH11-RayARITable 128 April 201714:54Logit analyses of determinants of civil war onset, 1945–1999VariablePrior warPer capita incomelog(Population)log(% mountain)Noncontiguous state[1]Civil war 0.954[2]Ethnic war(0.314) 0.849(0.388) 0.916(0.312)(0.072) 0.379(0.100) 0.318(0.071) 0.309(0.079) 0.263(0.073) 0.389(0.110) 0.272(0.074) 0.223(0.079) 0.219(0.085)0.120 (0.106) 0.199(0.085) 0.418(0.103)0.443 (0.274)0.481 (0.398)(0.279) 0.809New state(0.339) 1.777Instability 0.618(0.235) 0.858Democracy [Polity IV]0.021 (0.017)Ethnic fractionalization0.166 (0.373)Religious fractionalization0.285 (0.509) 0.171 (0.328)0.426 (0.272) 0.751(0.278) 1.269(0.297)(0.415) 1.658(0.342) 1.147(0.413)0.385 (0.316) 0.513(0.242) 0.584(0.268)0.013 (0.022)0.146 (0.584) 1.533(0.724) 0.119 (0.396)0.164 (0.368)0.326 (0.506) 0.521Democracy [Dichotomous]Observations 0.551 (0.374)(0.352)AnocracyConstant[4]Civil war (COW) 0.344 1.709Oil exporter[3]Civil war(0.237)0.127 (0.304) 6.731(0.736)6,327 8.450(1.092)5,186 7.019(0.751) 1.176(0.563) 0.597(0.261)0.219 (0.354) 7.5036,327(0.854)5,378The dependent variable is coded as “1” for country years in which a civil war began and as “0” in all others. Columns 1, 2, and 3 use conflict onset data asdescribed by Fearon & Laitin (2003a) and column 4 uses conflict data from the Correlates of War (COW) project. Per capita income and population are inthousands and lagged 1 year. For all variable definitions, see Fearon & Laitin (2003a). Standard errors are in parentheses, with *, **, and *** representingassociated p-values lower than 0.05, 0.01, and 0.001, respectively. Adapted from Fearon & Laitin (2003a, table 1).100 deaths on both sides (to rule out genocides or one-sided massacres) (Fearon & Laitin 2003,p. 76). These criteria are similar though not identical to other criteria used in the literature, whichprincipally vary in the size of the thresholds and generally lack the third criterion.They conclude that,Per capita income . . . is strongly significant in both a statistical and a substantive sense: 1,000 less inper capita income is associated with 41% greater annual odds of civil war onset, on average . . . . Theincome variable is not just a proxy for “the West,” whose states might have low rates of civil war forreasons of culture or history that have little to do with income. The estimated coefficient . . . remainsstrongly significant (Fearon & Laitin 2003, p. 83).One can discuss this finding on a number of levels, and we do so next.3.1.1. The definition of conflict. We get an obvious preliminary consideration out of the way:There are conflicts, and there are conflicts. Whether threshold-like criteria involving substantialnumbers of deaths are adequate depends on the type of question the analyst has in mind. Manytypes of organized unrest can lead to relatively low levels of deadly violence: demonstrations,strikes, coups, the detaining of political prisoners, or even the growth of organized crime cometo mind. Their costs might even exceed the costs imputed to civil wars. Indeed, one might arguethat this type of social unrest corresponds more clearly to the Marxian notion of “class struggle”55However, note that the Marxian view is that conflict is precipitated by the development of the “productive forces,” whereaswhat we observe is that higher GDP reduces the likelihood of conflict.www.annualreviews.org Conflict and Development269
EC09CH11-RayARI28 April 201714:54rather than a recurring state of armed civil war. The problem, of course, is that we do not havecomprehensive data of this sort.When violence is involved, it could have potent and long-lasting consequences for social tensionand yet have low numbers of fatalities attached to it. Think of the the Irish Republican Army (IRA)movement in the United Kingdom; the Red Army Faction in West Germany in the late 1970s;the Black Panther movement in the United States; the permanent situation of turmoil in Italy,with either real or fabricated extreme left terrorist actions; the military coups in Greece andTurkey; the failed coups in France in 1958 and in Spain in 1981; and the Euskadi Ta Askatasuna(ETA) movement (again in Spain) since the early 1970s. One could add the many revolutionarymovements and bloody military coups in Latin America in countries with per capita incomes wellabove those of many Asian or African countries. How can it be that this does not sufficiently showup in the empirical results? Is this because the number of deaths did not go beyond some arbitrarythreshold of 50 or 100 yearly casualties?More generally, we cannot discard the possibility that the empirical results capture more theexplicit outbreaks of civil war, whereas, in reality, there could be active sources of discontent thatdo not always come to fruition in the form of multiple deaths and overt conflict. That is, thereasons for conflict could well be active at all economic levels, but poverty allows that conflictto fully express itself. A hypothesis compatible with this alternative interpretation is that richercountries have better state capacity to contain insurgencies than poor countries, a line of reasoningto which we return below (Section 3.2.2).We do not wish to dwell excessively on this specific issue. There is not much more that canbe done with the data we currently have. Our only point is that developed countries may haverelatively more of the “quieter conflicts,” leading to a bias in the observed correlation betweenper capita income and conflict.3.1.2. Endogeneity. The negative relationship between per capita income and conflict mustobviously be interpreted with a great deal of caution, rife as it is with endogeneity. Ongoingconflict will destroy productive capacity, leading to lower per capita income. For instance, Hess(2003) estimates the cost of all civil wars to be 8% of the world’s GDP, and de Groot (2009) findsthat global GDP in 2007 would have been 14.3% higher if there had not been any conflict since1960. Using geolocalized data for Africa with a 1-degree grid, Mueller (2016) finds that for everyyear that a cell in that grid experiences more than 50 fatalities, growth is reduced by about 4.4percentage points.6There are also important omitted variables to be contended with. Both low per capita incomeand conflict could be the joint outcome of weak political institutions, as mentioned above. Djankov& Reynal-Querol (2010) argue that country-specific historical factors are highly significant inexplaining both conflict and weak institutions and that they render nonsignificant the role oflow per capita income. Besley & Reynal-Querol (2014) find that local conflicts over the past fewcenturies are highly significant in explaining today’s civil wars, as well as today’s developmentoutcomes. Ashraf & Galor (2013) and Arbath et al. (2015) argue that genetic diversity explainsboth the level of development and social conflict.6Collier & Hoeffler (2004a,b) estimate the typical cost of a civil war to be around 50 billion and argue that this reduces thefuture growth rate by 2 percentage points. The recent computations by Gates et al. (2012) indicate that a medium-sized conflictwith 2,500 battle deaths increases undernutrition by an additional 3.3%, reduces life expectancy by about 1 year, increasesinfant mortality by 10%, and deprives an additional 1.8% of the population from access to potable water. Undoubtedly, thatin turn affects per capita income. For a rigorous methodology for computing the costs of conflict, see Abadie & Gardeazabal(2010). For an overview of the different quantitative cost estimates, see Lindgren (2004), de Groot (2009), and Mueller (2013).270Ray·Esteban
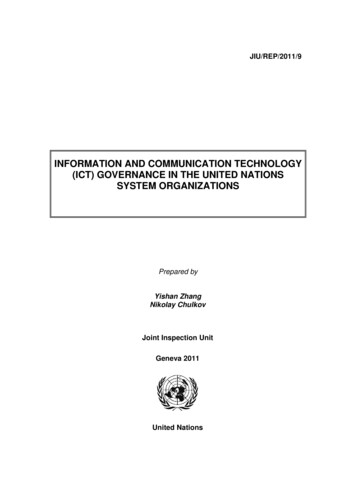
EC09CH11-RayARI28 April 201714:54A good instrument for per capita income would alleviate some of these concerns. Rainfall ispotentially such an instrument, and this connection is exploited by Miguel et al. (2004). Theiranalysis must rely, however, on regions in which rainfall significantly affects output, which explainstheir focus on sub-Saharan Africa. Specifically, a large fraction of output is agricultural, andirrigation is far from being widespread. Indeed, a first-stage regression of income growth onweather shock works very well for sub-Saharan Africa. Yet this strategy is obviously limited.Rainfall shocks do not work well outside the sub-Saharan sample or, indeed, even over morerecent time periods for sub-Saharan Africa.Miguel et al. (2004) work with a conflict database developed by the Peace Research Instituteof Oslo (PRIO) in conjunction with the University of Uppsala. (We return to this database inSection 5.2.) The specification they use is somewhat different from that employed by Collier &Hoeffler (1998, 2004a,b) and Fearon & Laitin (2003a): They relate the incidence of civil conflictin sub-Saharan Africa (over the period from 1981 to 1999) to the growth rate of per capita GDP(rather than its level). The relationship Miguel et al. (2004, p. 727) uncover is strong: “A fivepercentage-point drop in annual economic growth increases the likelihood of a civil conflict (atleast 25 deaths per year) in the following year by over 12 percentage points, which amounts to anincrease of more than one-half in the likelihood of civil war.”Table 2 reproduces the main results found by Miguel et al. (2004). Of particular interest arecolumns 5–7, which report the instrumental variables specifications and show the negative association between growth and conflict. It is also noteworthy that the level of per capita income playsno role once growth rates are included in the picture.7 This is not to say that the previous crosssectional correlations are necessarily suspect but rather that the exact nature of the relationshipbetween income and conflict—questions of correlation and causation aside—is far from cast instone. We return to this issue in Section 3.3, after we discuss matters of interpretation.3.2. Questions of InterpretationIf we tentatively buy the causal link from low income (or negative shocks to income) to conflict,there are two main interpretations to consider:1. Opportunity cost. Individuals allocate their time between productive work and conflictualactivity to obtain resources. When the society is poor, the opportunity cost of engaging inconflict is lower.2. Weak institutions. States in poor societies are ill-equipped to handle the demands and pressures of conflicting groups and succumb more easily to open conflict.The first of these interpretations is favored by Collier & Hoeffler (1998, 2004a) and the secondby Fearon & Laitin (2003a).3.2.1. Opportunity cost. The opportunity cost argument, going back to Becker (1968) andEhrlich (1973) and echoed in Skaperdas (1992), Hirshleifer (1995), Grossman & Kim (1995), Dal7This observation is related to Ciccone’s (2011) critique of Miguel et al.’s (2004) exercise. Effectively, their specificationconnects conflict at date t to the growth of rainfall between periods t 2 and t 1. Ciccone argues that this connection saysvery little about the level–level relationship or indeed about whether conflict levels are affected by rainfall shocks, in the senseof a downward departure from “normal” rainfall levels, as opposed to a reduction in rainfall over two successive years. Thelatter could be a shock but could also be a mean reversion (if period t 2 had supernormal rainfall). Indeed, Ciccone (2011)finds no robust link between rainfall levels (or shocks) and civil conflict.www.annualreviews.org Conflict and Development271
EC09CH11-RayTable 2ARI28 April 201714:54Economic growth and civil conflict in sub-Saharan AfricaConflict deaths 25[1]OLS[2]OLS 0.210 (0.200) 0.210 (0.160)VariableEconomic growth t[3]IV-2SLS 0.410 (1.480) 2.250Economic growth t 10.010 (0.200)log(GDPpc 1979)0.085 (0.084)0.053 (0.098)Democracy [Polity IV t 1]0.003 (0.006)0.004 (0.006)Ethnolinguistic fractionalization0.510 (0.400)0.510 (0.390)Religious fractionalizationOil exporter0.070 (0.160)(1.070)0.100 (0.420)0.220 (0.440) 0.160 (0.200) 0.100 (0.220)Log mountainous0.057 (0.060) 0.182Log population t 1 1,000[4]IV-2SLS 1.130 (1.400) 2.550(1.100)[5]IV-2SLS 1.48(0.82) 0.77 (0.70)0.060 (0.058) 0.159(0.086)(0.093)Country FENoYesNoYesYesR20.530.71–––Root mean square 43Dependent variable: civil conflict 25 deaths (and 1,000 deaths in col
1Department of Economics, New York University, New York, NY 10012; email: debraj.ray@nyu.ed 2Department of Economics, University of Warwick, Coventry CV4 7AL, UK 3Institut d'An alisi Econ omica (IAE-CSIC), Barcelona 08193, Spain; email: joan.esteban@gmail.com Annu. Rev. Econ. 2017. 9:263-93 The Annual Review of Economics is online at