Transcription
Nursing Education Program Information SurveyTexas Center for Nursing Workforce StudiesI n C o l l a b o r at i o n w i t h t h e Texas Board of NursingPost-Licensure RN to BSN Education ProgramsThis update presents data for the 43 Texas professional nursing programs that indicated they had a post-licensure RNto BSN (Bachelor’s of Science in Nursing) program track during the 2018 reporting year.The focus on post-licensure RN students is due to the Institute of Medicine’s 2011 recommendation that 80% ofRNs have at least a baccalaureate degree in nursing by the year 2020.1 Note that beginning in 2014, all RN to BSNprograms, especially online programs, were asked to only include data on students that were Texas residents, which wasnot specified in previous surveys. This report includes only students in Texas enrolled in Texas programs, not students inother states enrolled in Texas programs.The Texas Center for Nursing Workforce Studies (TCNWS) collected data in the 2018 Board of Nursing’s (BON)Nursing Education Program Information Survey (NEPIS) that was available online as of October 1, 2018. The reportingperiod was academic year (AY) 2017-2018 (September 1, 2017 – August 31, 2018) unless otherwise noted. TCNWScollaborated with the BON in the design and dissemination of the survey.1Institute of Medicine, Committee on the Robert Wood Johnson Foundation Initiative on the Future of Nursing. (2011). Front matter. The future of nursing: Leadingchange, advancing health.RN to BSN Program CharacteristicsIn the 2018 NEPIS, RN to BSN programs were askedto report the number of semester credit hours for upperdivision nursing and the length of time for programcompletion in months.Table 1. Mean and Median Number of Hours Dedicated toClinical ComponentsClinical ComponentThe median number of semester credit hours was30, ranging from 21 to 102.The median length of time for program completionwas 12 months (18 programs).23 programs (53.5%) used a block curriculum, 15 (34.9%)used an integrated curriculum, 3 (7.0%) used a conceptbased curriculum, and 2 (4.7%) used a competency-basedcurriculum. Programs were asked to provide faculty-tostudent ratios:Median HoursClinical clock hours128.5112.5Lab clock hours15.60.0High-fidelity simulation clock hours4.80.0Virtual simulation clock hours12.00.0Programs were asked to report on their students’ previouswork experience.12 programs provided ratios for face-to-facedidactic instruction. The median ratio was 1:19,ranging from 1:1 to 1:40.41 programs provided ratios for online instruction.The median was 1:20, ranging from 1:1 to 1:100.29 programs provided ratios for clinical supervision.The median was 1:12, ranging from 1:1 to 1:50.36 (83.7%) responding programs had requirements for aclinical component. Table 1 shows the mean and mediannumber of hours dedicated to clinical components.Publication #: 25-15189Mean Hours1 of 6First, programs were asked how many years ofnursing practice were required to be eligible foradmission to the program. 3 programs reportedthat they required nursing experience for admissioninto the program. These programs all required 1year of experience.Programs were then asked to report the percentageof their students who had less than 2 years of workexperience. The median percentage was 16.0%,ranging from 0.0% (12 programs) to 100% (1program). This is an increase from 2017, when amedian of 7.0% of students had less than 2 years ofwork experience.March 2019www.dshs.texas.gov/chs/cnws/2018
Programs were asked whether they offered nursing coursesvia online technology. Of the 43 RN to BSN programs:8 programs (18.6%) offered select courses online.11 programs (25.6%) offered web-enhancedsections of courses online.29 programs (67.4%) offered the entire didacticprogram curriculum online.Qualified Applications for Post-Licensure RN to BSN ProgramsTable 2 presents data on qualified applications andadmissions to post-licensure RN to BSN programs in AY2017-2018. Qualified applications were those that metall criteria for admission.2138 qualified applications were not admitted in2018 (1.9% of all qualified applications), up from72 qualified applications in 2017.38 of 43 programs (88.4%) offered admission to allstudents with qualified applications in 2018.Of the 7,287 applications offered admission, 4,768(65.4%) registered and enrolled in a post-licensureRN to BSN program for AY 2017-2018, a decreasefrom the previous year (87.1%).Table 2. Qualified Applications, Admissions, and QualifiedApplications Not Offered Admission, 2014-2018QualifiedOffered ApplicationsAdmission Not Seatsfor 4,85876 (1.5%)4,021201512,2475,1984,752446 (8.6%)4,135201612,9005,2045,12282 (1.6%)4,573201714,5477,0046,93272 (1.0%)6,039201814,4847,4267,287138 (1.9%)4,7682 of the 5 programs that did not accept all qualifiedapplications ranked the importance of reasons whyqualified applications were not accepted.One reported that lack of budgeted facultypositions was the most important reason whyqualified applications were not accepted, and onereported that lack of clinical space was the mostimportant reason why qualified applications werenot accepted.6 programs did not admit new RN to BSNapplicants in AY 2017-2018.Seats for new students decreased by 0.4% in 2018,while the number of programs increased by 2.Seats for new students may include seats for outof-state students, but qualified applications,applications offered admission, and newly enrolledstudents only include Texas residents.Qualified applications refers to applications submitted, not individualapplicants, since candidates for admission may apply to more than one nursingprogram.2Seats for new students does not distinguish between non-Texas and Texasresidents.34Per the survey operational definition, seats for new students refers to themaximum number of seats for new students that a program can enroll in anygiven admission period. Seats for new students may be limited by Board ofNursing rules or logistical concerns (faculty size, classroom space, etc.).Newly Enrolled Students in Post-Licensure RN to BSN ProgramsTable 3 shows the yearly change in newly enrolled, first yearstudents from 2014 to 2018. Newly enrolled students arethose who were offered admission and decided to registerand enroll in the program.Table 3. Change in Newly Enrolled Students, 2014-2018There were a total of 4,768 newly enrolled postlicensure students in AY 2017-2018.From AY 2016-2017 to AY 2017-2018, the numberof newly enrolled students decreased by 21.0%.Publication #: 25-151892 of 6Newly Enrolled Post-LicensureStudents% Annual 3932.1%20184,768-21.0%March 2019www.dshs.texas.gov/chs/cnws/
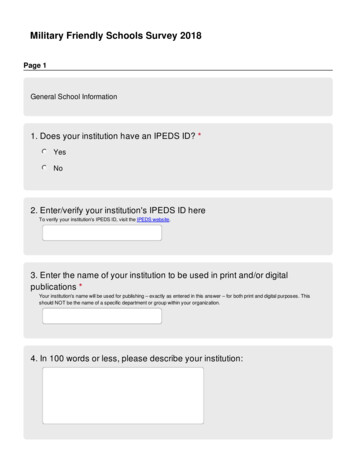
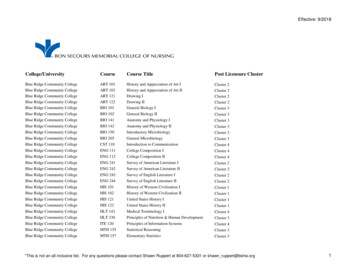
Total Enrollment in Post-Licensure RN to BSN ProgramsOn September 30, 2018, as shown in Figure 1, there were8,145 students enrolled in post-licensure RN to BSNprograms.Figure 1. Total Enrollment in Post-Licensure RN to BSNPrograms, 2014-201812,000From 2017 to 2018, enrollment decreased by 2,812students (25.7% decrease) while the number of RNto BSN programs increased by 2.From AY 2016-2017 to AY 2017-2018, 18programs had a decrease in total enrollment, 21programs reported increased total enrollment, and1 program did not have a change in enrollment. 3programs reported enrollees for the first time in ,0005,4742,000020142015201620172018Graduates from Post-Licensure RN to BSN ProgramsAs shown in Figure 2, there were 4,236 post-licensure RNto BSN graduates during AY 2017-2018.15 programs reported a decrease in the number ofpost-licensure RN to BSN graduates during AY2017-2018 while 21 programs were able to increasethe number of graduates. 4 programs reported thesame number of graduates as AY 2016-2017 and 3programs reported graduates for the first time.This represented a 27.6% increase from AY 20162017 (917 more graduates).Figure 2. Graduates from Post-Licensure RN to BSN Programs,2014-20185,0004,2364,0003,000The 43 post-licensure RN to BSN programs were askedto describe any barriers they faced in increasing postlicensure RN to BSN graduates.A variety of barriers were cited including lack ofclinical space/competition with other programs (7programs or 16.3%), not offering an online program(6 programs or 14.0%), and cost of program orstudent financial difficulties (3 programs or 0172018Publication #: 25-151893 of 6March 2019www.dshs.texas.gov/chs/cnws/
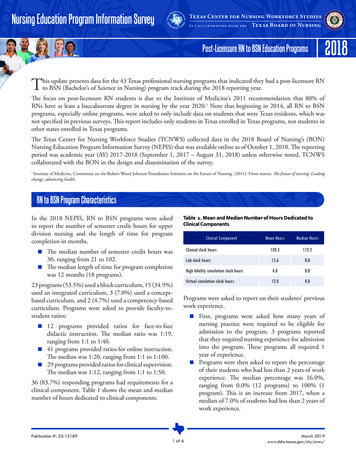
Demographics of Newly Enrolled Post-Licensure RN to BSN StudentsSexFemales made up 87.4% of the 2018 newly enrolledpost-licensure RN to BSN student population, whichwas virtually unchanged from the proportion who werefemale in 2017 (87.3%). Gender data were missing for0.04% of newly enrolled RN to BSN students.Figure 4.Race/Ethnicity of Newly Enrolled RN to BSNStudents, Pre-Licensure RN Students,6 and Texas Population,7201860%52.9%50%40%AgeFigure 3 displays the breakdown of age among newlyenrolled post-licensure RN to BSN students in 2018. Agedata were available for all newly enrolled students.43.6%40.3%Newly Enrolled RN to BSN StudentsNewly Enrolled Pre-Licensure RN StudentsProjected Texas Population41.5%30.8%30%24.4%20%15.1% 14.5%11.4%Figure 3. Age of Newly Enrolled Students11.2%7.7%6.8%10%51 years8.7% 25 years12.6%41-50 years21.7%0%31-40 years36.1%Newly enrolled RN to BSN students remainedfairly evenly distributed among age groups 21-30,31-40, and 41 or more years.There were considerably more post-licensure RN toBSN students aged 51 and older (8.7%) comparedto pre-licensure RN students (1.4%).6Race/EthnicityWhite/Caucasian students made up a greaterproportion of post-licensure RN to BSN newlyenrolled students (52.9%) compared to prelicensure RN students (43.6%) and compared tothe Texas population (40.3%). The post-licensureRN to BSN white/Caucasian student proportionwas slightly lower than in 2017 (53.8%).Publication #: ispanics/Latinos continued to be underrepresentedamong post-licensure RN to BSN students. Whilethe proportion of Hispanics/Latinos was 41.5% inTexas, Hispanics/Latinos made up only 24.4% ofthe post-licensure RN to BSN student population,compared to 30.8% of the pre-licensure RN studentpopulation.There were more black/African American RN toBSN students (15.1%) compared to pre-licensureRN students (14.5%) and the Texas population(11.4%).Other students, which include Asian, NativeHawaiian, Alaskan, and other race/ethnicities, alsorepresented a greater proportion of the post- andpre-licensure student population than the Texaspopulation.Since 2013 the proportion of newly enrolledRN to BSN students who were Hispanic/Latinohas increased by 38.4% (Figure 5, page 5). Theproportions of other races have fluctuated since2013 but remained mostly unchanged.26-30 years20.7%Figure 4 displays the race/ethnicity distribution of postlicensure RN to BSN students in comparison to the race/ethnicity distribution of pre-licensure RN students andthe projected Texas population. Race/ethnicity data weremissing for 14.4% of newly enrolled RN to BSN students.White/CaucasianInternational StudentsPrograms reported a total of 51 newly enrolled studentswho were international (1.1% of all RN to BSN newlyenrolled students).84 of 6March 2019www.dshs.texas.gov/chs/cnws/
Figure 5. Race/Ethnicity of Newly Enrolled RN to BSNStudents, 2013-2018Pre-licensure RN data come from the 2018 RN NEPIS fact sheets locatedhere: m#Professional.6Texas population data come from the 2018 Texas State Data Center populationprojections .760%International was defined as a person who is not a citizen or permanentresident of the United States and who is in this country on a temporary basisand does not have the right to remain 201420152016Black/African American20172018Hispanic/LatinoOtherDemographics of Post-Licensure RN to BSN GraduatesSexRace/EthnicityFemales made up 86.4% of the 2018 post-licensure RN toBSN graduate population, which is slightly lower than theproportion who were female in 2016 (87.3%). Genderdata were missing for 0.02% of RN to BSN graduates.Figure 7 displays the race/ethnicity distribution of postlicensure RN to BSN graduates in comparison to the race/ethnicity distribution of pre-licensure RN graduates andthe Texas population. Race/ethnicity data were missingfor 14.2% of RN to BSN graduates.AgeFigure 6 displays the breakdown of age among postlicensure RN to BSN graduates in 2018. Age data weremissing for 0.1% of RN to BSN graduates.Figure 7.Race/Ethnicity of RN to BSN Graduates, Pre-LicensureRN Graduates,6 and Texas Population,7 2018Figure 6. Age of Graduates60%50%51 years 25 years8.8%8.8%40%RN to BSN GraduatesPre-Licensure RN GraduatesProjected Texas Population54.5%48.5%41.5%40.3%28.2%30%21.8%26-30 years20.6%41-50 years24.2%20%15.8%10%0%31-40 years37.5%RN to BSN graduates were fairly evenly distributedamong age groups 21-30, 31-40, and 41 or moreyears.There were considerably more post-licensure RN toBSN graduates aged 51 and older (8.8%) comparedto pre-licensure RN graduates (1.7%).6Publication #: 25-151895 of %Hispanic/Latino10.9%6.8%OtherWhite/Caucasian graduates made up a higherproportion of post-licensure RN to BSN graduates(54.5%) than pre-licensure RN graduates (48.5%),and the Texas population (40.3%). The postlicensure RN to BSN white/Caucasian graduateproportion increased from 2017 (50.7%).March 2019www.dshs.texas.gov/chs/cnws/
While the proportion of Hispanics/Latinos was41.5% in Texas, Hispanics/Latinos made up only21.8% of post-licensure RN to BSN graduates,compared with 28.2% of pre-licensure RN graduates.There were more black/African American postlicensure RN to BSN graduates (15.8%) comparedto pre-licensure RN graduates (12.4%) and theTexas population (11.4%).Other race/ethnicities also represented a greaterproportion of the post- and pre-licensure graduatepopulation than the Texas population.Since 2013 the proportion of RN to BSN graduateswho were Hispanic/Latino has increased by23.0% (Figure 8). The proportions of other raceshave fluctuated since 2013 but remained mostlyunchanged.Figure 8. Race/Ethnicity of RN to BSN Graduates, 1420152016Black/African American2017Hispanic/Latino2018OtherInternational StudentsPrograms reported a total of 49 graduates who wereinternational students (1.2% of all post-licensure RN toBSN graduates).86Pre-licensure RN data come from the 2018 RN NEPIS fact sheets located here: m#Professional.7Texas population data come from the 2018 Texas State Data Center population projections .International was defined as a person who is not a citizen or permanent resident of the United States and who is in this country on a temporary basis and does nothave the right to remain indefinitely.8Publication #: 25-151896 of 6March 2019www.dshs.texas.gov/chs/cnws/
The 43 post-licensure RN to BSN programs were asked to describe any barriers they faced in increasing post-licensure RN to BSN graduates. A variety of barriers were cited including lack of clinical space/competition with other programs (7 programs or 16.3%), not offering an online program (6 programs or 14.0%), and cost of program or