Transcription
BGP Eye: A New Visualization Tool for Real-time Detectionand Analysis of BGP AnomaliesSoon-Tee Teoh , Supranamaya Ranjan , Antonio Nucci , Chen-Nee Chuah– San Jose State University, San Jose, CA, USA– Narus Inc, Mountain View, CA, USA– University of California Davis, Davis, CA, USA ABSTRACTOwing to the inter-domain aspects of BGP routing, it is difficult tocorrelate information across multiple domains in order to analyzethe root cause of the routing outages. This paper presents BGP Eye,a tool for visualization aided root-cause analysis of BGP anomalies. In contrast to previous approaches, BGP Eye performs realtime analysis of BGP anomalies through a hierarchical deep-diveapproach. First BGP updates are clustered to obtain BGP eventsthat are more representative of an anomaly and then these eventsare correlated across all the border routers to ascertain the extent ofthe anomaly. Furthermore, BGP Eye provides both the capabilityto analyze BGP anomalies from an Internet-Centric View throughmultiple vantage points as well as from a Home-Centric View of aparticular Autonomous System (AS). We present the capability forscalable and real-time root-cause analysis provided by BGP Eyethrough the analysis of two widely contrasting anomalies. First,we provide an Internet-Centric view towards the routing outagescaused during the spread of the Slammer Worm on January 25th,2003 from AS568 and; Second, we provide a Home-Centric viewfrom the perspective of AS6458 into the routing outages causedby the inadvertent prefix hijacking by AS9121 on December 24th,2004.1.INTRODUCTIONThe Internet is a global, decentralized network comprised ofmany smaller inter-connected networks. A network under the administrative control of a single organization is called an AutonomousSystem (AS). The process of routing within an AS is called intradomain routing and routing between ASes is called inter-domainrouting. The dominant inter-domain routing protocol on the Internet is the Border Gateway Protocol (BGP). Although BGP’s simplicity and resilience have enabled it to play a fundamental rolewithin the global Internet, it has historically provided very limited performance or security guarantees, which often contribute toa global-scale instability and outages.Due to the inter-domain aspect of BGP, even small routing failures within an AS can sometimes propagate widely into the restof the Internet causing significant and widespread damage. Onesuch failure occurred on April 25th 1997, when a mis-configuredrouter maintained by a small Internet Service Provider (ISP) in Vir-Permission to make digital or hard copies of all or part of this work forpersonal or classroom use is granted without fee provided that copies arenot made or distributed for profit or commercial advantage and that copiesbear this notice and the full citation on the first page. To copy otherwise, torepublish, to post on servers or to redistribute to lists, requires prior specificpermission and/or a fee.Copyright 2002 ACM X-XXXXX-XX-X/XX/XX . 5.00.ginia injected incorrect routing information into the global Internetand claimed to have optimal connectivity to all Internet destinations. Since there are no mechanisms to validate route announcements, most Internet traffic was re-directed to this small ISP, whichoverwhelmed the mis-configured routers and effectively crippledthe Internet for almost two hours. Loss of reachability on the Internet can be consequence of human mistakes (e.g., router misconfigurations) or malicious activities. Several Internet worm outages in the past have indicated the increasing vulnerability of theInternet routing infrastructure to attacks that initially start out in thedata plane. For example, the SQL Slammer worm outbreak [21]on Jan 25th, 2003 started by exploiting a vulnerability in the MSSQL server. Although the SQL Slammer worm was not directlytargeted towards the Internet routing infrastructure, it resulted inseveral AS peering links being overloaded on account of the sudden traffic surge. The congestion caused by the port-scanning andworm-payloads resulted in the BGP peering sessions being reset,thus starting the chain of events that led to the huge surge in thenumber of BGP updates. Such coincidences between worm propagation and Internet routing event surges have been observed in thepast as well, such as the Code-Red [22] worm outbreak in July 2001and the Nimda [23] worm outbreak in September 2001.As the number of critical applications on the Internet grows, sowill the reliance on it to provide reliable and secure services. Because of the increased importance of the Internet, there is muchmore interest in increasing the security of its underlying infrastructure, including BGP. Although such assertions might seem novel,they are not: the United States government cites BGP securityas part of the national strategy for securing the Internet [Department of Homeland Security 2003]. Further, BGP security issuesare being looked by both IETF working groups [25] as well asNANOG [26], which is an indication of the importance and relevance of this topic.1.1 Motivation and Related WorkSeveral approaches have been proposed recently on root-causeanalysis of BGP routing changes [1, 2, 3, 4, 5, 6]. These studies analyze streams of BGP update messages from several vantagepoints throughout the Internet, with the goal of inferring the mostlikely cause of the problem and its location. Although these approaches provide “identification of ASes that are involved in thesame problem”, they do not consider what really matters to a Network Operator, i.e. the view of their specific AS, referred in the paper as customer-AS. On the other hand, in [7] the authors proposeda new approach for root-cause analysis that analyzes BGP routingchanges from the perspective of a customer-AS such to quantifythe effects of these changes on that specific network. An idealsystem would combine both views, e.g. multiple vantage pointsand customer-AS specific, such to add up the benefits of both approaches.
The two categories of approaches described above suffer fromtwo serious limitations. First, they produce “large” textual reportsthat Operators have to parse through to sort out problems related totheir networks. This procedure may be time-consuming and inefficient. Second, most of the approaches offer only an off-line capability for data analysis. An ideal system would establish a real-timeinteraction between end-users and network traffic such that userscan gain insight of both network dynamics and hidden traffic patterns and analyze/react “on-the-fly” to the undergoing problems.In order to accomplish the above, several visualization tools wereproposed. These visualization tools empower the user to develop areference model of what is normal on their own network so thatthey can diagnose problems better and faster. For example, oneexisting system which maps BGP path attributes to an AS graphis BGPlay [15]. When the user starts BGPlay, a query windowwill appear, where the user enters the prefix and time interval. TheBGPlay server will then query the database for all updates to thespecified prefix during the specified time interval. The animationwindow then displays routing activity of that prefix including (a) ahistogram of the number of events over time and (b) an AS graphshowing paths that change versus stable paths during the query interval.Another system that also maps BGP attributes to an AS graph isLinkRank [16]. In a LinkRank graph, the weight of an inter-AS linkis determined by the number of prefixes having an AS path that includes that link. In a Rank-Change graph, the weight on each link isthe difference between the LinkRank of that link over time. A negative weight indicates routes lost on a link, while positive weightindicates routes gained in that time period. A similar system isthe TAMP graph [19], which shows how many prefixes are carriedover an AS-AS link. The edge colors indicate how the statistics arechanging (e.g., no change, losing prefixes, gaining prefixes, andprefix count flapping too fast to animate).The Elisha system [20] also contains network visualization ofBGP updates. In this system, all the paths from the observationpoint AS to the origin AS of the IP prefix is plotted. This systemalso allows animation over time, so that at each frame, all the ASpaths used in the time interval are displayed. The color representsthe time (less recently or more recently) the path was used withinthe currently-displayed time window.1.2 An Alternate Solution: BGP EyeThese existing visualization tools focus only on raw information, i.e. BGP updates, and do not give any deep insight into theproblem. On this perspective, in this paper we introduce a new visualization tool, called BGP Eye, that provides a real-time statusof BGP activity with easy-to-read layouts. The tool has been designed such to meet criteria like: i) scalability, i.e. the ability toprocess and display a large set of data at very fine time-scales forlarge-size network deployment; ii) efficiency, i.e. variety of different graphical layouts that provide a complete view of the BGProuting behavior; iii) readability, i.e. clear and easy-to-read layouts that enable Operators to promptly detect, classify, analyze theunder-going anomaly and report rich-enough feedback to Operatorsin order for them to take the appropriate counter actions. Comparedto previous visualization tools, BGP Eye is novel in the followingways:The scalability of BGP Eye is derived from its use of the metric of BGP event which clusters together multiple short-livedsomewhat arbitrary BGP updates likely to be originated by thesame network problem. This concept allows Operators to identify a small number of important routing disruptions from alarge volume of raw BGP updates.It provides a deeper and wider view of BGP activity as a whole,e.g. how multiple ASes interact with each other (Internet-Centric),Step12345678PolicyIgnore if the next hop is unreachableHighest Local PreferenceShortest AS pathLowest Origin TypeLowest MED among routers from same ASeBGP routes over iBGP routesLowest IGP cost (“Hot-Potato routing”)Lowest router IDTable 1: BGP Decision Processas well as AS specific, e.g. how problems involving ASes faraway from the customer-AS might affect its normal behavior(Home-Centric).It provides new information like number of BGP events carriedover each AS-AS link, and number of BGP events originatedfrom each AS.It is capable of de-noising and profiling BGP events over timeusing the Exponential Weighted Moving Average technique forall/or highlighted ASes and all/or highlighted AS-AS links.It can deep-dive into the problem displaying information nevershown before, as: (i) total number of BGP events per singleand multiple border routers; (ii) classification of BGP eventsaccording to family types and per each border router; (iii) prefixstatus and (iv) prefix instability.The paper is organized as follows. In Section 2 we describe somebasic concepts of the BGP routing protocol and how we classifyBGP events into several family types, as previously defined in [7].In Section 3 we introduce BGP Eye and describe in great detailsall the layouts supported. In Section 4 we show how BGP Eye isable to promptly detect two common problems widely experiencedin the Internet: prefix reachability and prefix authenticity. As anexample of prefix reachability, we analyze the impact of the Slammer worm outbreak on January 25th, 2003 from the perspective ofAS568, which belongs to the Department of Defense (DoD). Weshow how AS568 was severely infected by the Slammer worm andhow AS568 started to actively spread the worm deeply and widelyacross the Internet. As an example of prefix authenticity, we analyze the inadvertent hijacking of 100,000 prefixes by Turkey Net(AS9121) on December 24th, 2004. Specifically, from the viewpoint of a few ASes (AS6453, AS3257), we study the impact of thiscolossal hijacking event, and conclude that the impact of a colossalevent as this could vary widely at different points in the Internet,depending on the peering topology. Section 5 concludes the paper.2. FROM BGP UPDATES TO BGP EVENTSWe give a quick overview of BGP routing protocols in Section 2.1and discuss the clustering process of BGP updates into BGP eventsand their family-types in Section 2.22.1 BGP OverviewBGP is the routing protocol that ASes use to exchange information about how to reach destination address blocks (or prefixes).Three important aspects of BGP are:Path-vector protocol: Each BGP advertisement includes thelist of ASes along the path and other attributes such as next-hopIP address. By representing the path at the AS level, BGP hidesthe details of the topology and routing inside each network.Incremental protocol: Every BGP update message is indicative of a routing change, such as the old route disappearing or
the new route becoming available.Policy-oriented protocol: Routers can apply complex policiesto influence the selection of the best route for each prefix and todecide whether to propagate this route to neighbors. A routerapplies the decision process shown in Table 1 to compare theroutes learned from BGP neighbors and select the best route.In the backbone networks, BGP route selection depends onthe interaction between three routing protocols: External BGP(eBGP), Internal BGP (iBGP) and Interior Gateway Protocol(IGP). IGP determines the routing paths between two routerswithin the same AS. The routers use the IGP path costs in theseventh step in Table 1 to select the closest egress point. eBGPis used to exchange routing information with external ASes,while iBGP is used to re-advertise the routes learned from external peers to other routers in the same AS.A single network disruption, such as a link failure or policychange can trigger multiple BGP update messages as part of theconvergence process. The intermediate routes are short-lived somewhat arbitrary, since they depend on subtle timing details that drivehow the routers explore alternate paths. Operators may be interested in removing the transitory behavior associated with BGP updates and analyze BGP behavior in a more stationary regime. Forthis matter, we introduce a level of aggregation into our analysis,by borrowing the concept of BGP event from [7]. A BGP event isdefined as a sequence of BGP updates for the same prefix from anyborder router where the inter-arrival time is less than a predefinedevent-timeout. Since there is the risk that certain prefixes neverconverge to a stable path due to persistent routing instabilities, it isimportant to upper bound the maximum duration allowed for anyroute to converge. This is defined as convergence-timeout. Appropriate event-timeout and convergence-timeout values are analyzedand properly set up by BGP Eye.2.2 Classification of BGP Routing events: Single and Multiple Border Router(s) ViewAnother way to look at the data is how each border router reachesa specific prefix over time. Indeed, although a border router mightgenerate a BGP update or BGP event for a specific prefix at a specific point in time, it may either undergo a transient routing changeonly to return to the same stable best route or change to a newroute. Operators may be interested in tracking the status of specific prefixes or routers over time. We use the same concept ofrouting vector proposed by [7]. Letbethe set of border router of the specific AS that deployed our system. Letthe set of all admissible prefix. Letbe the best route selected by the border routerto reach destination prefixat time . We represent each routewith a two entries vector, where theentrycorresponds to the next-hop address of the eBGPneighbor router. Since a border routermay select asaroute learned via iBGP from another border router, we use the entryto capture this information, with value i in case thebest route is learned via iBGP or e in case the best route is learnedvia eBGP. With this definition, we can track in time the evolution offor anythe routing vectorspecific prefix. With this definition, Operators gain insightof the routing status, i.e. how each border router reaches a specificprefix over time.From a single border router perspective, we can classify BGPevents as:No Change (NC): For this scenario, traffic entering the network at border routerdestined to the prefixwould continue to flow through the AS in the same way (and). () *-,/. 3 !4#5%6'7 89 "! #&%(' 102 : 3 ) *-,/. ;89 " 0 @? ! #&%(' 6 A EGFIH ) *-,/. 6 A B(C D ) *-,/. 6 A EGFIH ! #&%6'7 6 A B(C D Internal/External Path Change (IPC/EPC): An Internal pathevent may cause a router to switch from one egress point to another (IPC). In this case, routeruses iBGP-learned route before and after the routing change (i)but with a different next-hop router ().An external path event may cause a router to switch betweeneBGP-learned routes with different next-hop ASes (EPC). Ine while the next hopthis case, thechanges, i.e. ().Loss/Gain of Egress Point (LEP/GEP): An external event maycause a route to disappear, or be replaced by a less attractivealternative, forcing a border router to select an iBGP-learnedhasroute (LEP). In this case, a routerbute whilei. On the contrary, anexternal event may cause a router to switch between eBGPlearned routes with different next-hop ASes (GEP). In this case,hasbuti whilea routere.As previously proposed by [7], it might be important to correlatedifferent views from multiple BGP routers to identify which subsetof the border routers have similar views of the problem.The multi-border router views leads to the classification ofBGP events into the following six family-types:Distant/Transient Disruption (TD): A BGP event is classified as belonging to this family if and only if each element of itsrouting vector has “NC”. These events do not have any influence on the flow of traffic through the AS. A transient disruption may cause temporary routing changes before the borderrouters converge back to the original BGP routes.Internal Disruption (ID): A BGP event is classified as belonging to this family if and only if the change of each of the elements in its routing vector is either of type “NC” or type “IPC”with at least one element undergoing an “IPC”. These eventsare important because they may cause a large shift in traffic asrouters switch from an egress point to another.Single External Disruption (SED): A BGP event is classifiedas belonging to this family if and only if only one element of itsrouting vector has a change of type “LEP”, “GEP” or“EPC”.Typically, an ISP has eBGP sessions with a neighboring AS atmultiple geographical locations, making it interesting to highlight routing changes that affect just one of these peering points.Multiple External Disruptions (MED): A BGP event is classified as belonging to this family if and only if multiple elementsof its routing vector have a change of type “LEP”, “GEP”or“EPC”.Loss/Gain of Reachability (LR/GR): A BGP event is classified as belonging to the family Loss of Reachability if and onlyif every element of its routing vector with an external route experiences a “LEP”. Similarly, a BGP event is classified as belonging to the family Gain of Reachability if and only if every element of its routing vector with an external route experiences a “GEP”. A loss of reachability may signify completeloss of connectivity to the destination addresses, especially ifthe routers have no route for other networks that contain theseaddresses. A gain of reachability might also indicate a problem, if there are no existing routes for that prefix (e.g., an ASthat mistakenly starts advertising a large number of small subnets).With this type of information, Operators can cluster BGP eventsof the same type across prefixes to infer the real cause of a networkproblem, i.e. correlation across destination prefix space. ) *-,/. 6 A B(C D ! #&%('7 6 A B(C D L ) *J,7. 6 A B6C D ) *J,7. 6 A EGFKH ! #&%6'7 6 A B(C D L ! #&%6'/ 6 A EGFKH) *-,/. 6 A EGFIH ! #&%('7 6 A E FKH ) *-,/. 6 A EGFIH ! #&%(' 6 A B(C D ! #&%(' 6 A E FKH ) *-,/. 6 A EGFKH ! #&%6' 6 A B(C D ! #&%6' 6 A EGFKH ) *-,/. 6 A B(C D) *-,/. 6 A B(C D
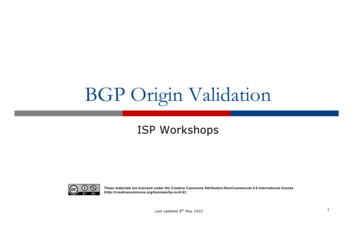
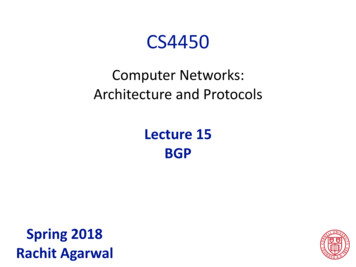
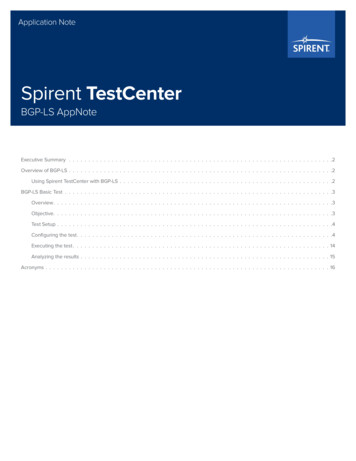
3.BGP EYE LAYOUTSGoal of BGP Eye is to track the healthiness of BGP activity,raise an alert when an anomaly is detected, and indicate its mostlikely cause. BGP Eye offers two different views of BGP Dynamics: Internet-Centric View and Home-Centric View.The Internet-Centric View studies the activity among ASes interms of BGP events exchanged. We have created a graph-based visualization of BGP routing changes that displays information like:(a) moving average of the total number of BGP events originated byASes and traversing AS-AS links; (b) instantaneous deviation fromhistorical trends of BGP events originated by ASes and traversingAS-AS links. Operators can use this view to: (i) monitor the Internet stability over time, i.e. number of BGP events generated acrossdifferent ASes; (ii) promptly detect abrupt changes in the routingactivity and which ASes are experiencing the observed problem;(iii) analyze the propagation of the problem through the entire Internet, e.g. growing rate and spreading factor, and forecast the timeat which their network will be hit. Moreover, this view can alsohelp the Operator in identifying which ASes are the most unstableover time in order for them to select appropriate peers for the futureor revise current peering agreements.The Home-Centric View has been designed to understand theBGP behavior from the perspective of a specific AS, e.g. customerAS. BGP updates originated and received by the customer-AS areclustered into different types of BGP events. We have createdseveral layouts that will help Operators to: (i) monitor the routing dynamics of their AS and its interaction with its peers; (ii)promptly detect routing instabilities, prefixes involved and whichborder routers are processing such routes; (iii) promptly diagnosethe causes of the problem whether is in/near/far away their AS; (iv)predict the potential damage associated to the undergoing routinginstability by incrementally gaining knowledge of the type of instability, prefixes and border routers involved and how much traffic isassociated with 1 .3.1 Internet-Centric ViewThe Internet-Centric view provides the Operator a real-time viewof the routing activity from an Internet perspective. BGP updatesare collected from several vantage-points, clustered together intoBGP events and processed such to provide information associatedwith their AS routing paths, e.g. chain of ASes traversed, fromthe Origin AS, as the root of propagation tree, to all its DestinationASes, e.g. leaves of the tree. In this tree, a generic - link isdrawn if a peering session was observed between the two adjacentASes, e.g. and , when the snapshot was taken.Due to the bursty nature of BGP updates and events, it is imperative for the tool to provide a first level de-noising of the data as wellas a trend analysis. In order to achieve a good trade-off between accuracy and the tight constraint of being real-time, we use a simplebut efficient learning algorithm known as EWMA. In each generictimeslot , BGP Eye does the following steps: (i) collects the BGPupdates originated by each AS and traversing each AS-AS link, andgenerates the associated BGP events. Let’s represent the sample of BGP events generated in the time slot for a generic timeseries, e.g. generic AS or AS-AS link; (ii) computes its movingaverage using the last “good” samples stored in memory, such to smooth out the large variance present into the data andextract the major trend; (iii) uses the EWMA to predict the value, 5, &9 To quantify the impact of problems detected by BGP Eye interms of Traffic Engineering, Netflow data collected on the outgoinglinks can be aggregated to compute prefix-level traffic statistics. Foreach destination prefix involved, the Operator can generate a trafficweight that corresponds to the percentage of traffic destined to thatprefix across the overall traffic volume in the network. The weightsallow the Operator to estimate the potential impact of occurrenceof routing events we have discussed previously.,, 5 5 , & , &, & , that would obey the historicalfor the current timeslot, e.g.trend. is computed as ,where represents a decay factor chosen by the user, ,used to calculateand strictly relatedto the number of samples , e.g. . Note that, a large value of meansmore importance to the present, while a small value of givesmore importance to the historical trend, i.e. the past. Usually agood recommendation for is to be equal to . (iv) evaluatesthe deviation of the sample and its predicted value , e.g. . (v) generates an alert if exceeds apre-specified threshold, like for example ! . Samples for whichan alert is generated are discarded and not used to compute futurerunning averages, thus avoiding to compromise the historical trendwith bad samples.The AS graph layout uses size and color of the objects, e.g.nodes and links, as two different dimensions to report more information to the operator. The size of an AS represents the movingaverage of the number of BGP events originated by the AS, e.g. , while its color represents the instantaneousdeviation of thecurrent sample from its historical trend, e.g. . The more eventsoriginating from the AS, the larger its size. The color map is shownat the lower left of Figure 1, with the minimum value mapped toblue, and the maximum value mapped to red.Similarly, for each AS-AS link shown in the AS graph, we represent the number of BGP events traversing link by its thickness.Specifically, the thickness of the link represents the moving average of the number of BGP events traversing the link, while its colorrepresents the deviation of the current sample from its historicaltrend. In addition, we allow the user to select a few ASes to showin detail. For each selected AS, its data will be plotted over time.The data plotted are (1) the number of BGP events per time window, and (2) the moving average over time. Our system also allowshighlighting of selected AS nodes and AS-AS links. There are several ways of highlighting a node: (1) the user can explicitly clickon a node to toggle whether it’s highlighted, (2) the user can enterthe AS number of the AS to highlight, (3) the user can set a threshold such that every AS that has originated BGP events more thanthe threshold will be automatically highlighted, or (4) the user canset a number such that the top ASes/AS-AS links will be highlighted. The number can be set by the Operator and can represent,for example, i) top ASes/AS-AS links with the largest number ofBGP events, or ii) top ASes/AS-AS links that are deviating themost from their historical trends. Each highlighted node or link isshown in bright colors in the foreground, while nodes and links thatare not highlighted are shown in dull colors in the background ascontext. An example is shown in Figure 1.To visualize the Internet-AS network, we allow the user to chooseamong three different ways of laying out the network graph.Force-based layout: Various force-based methods exist; a recent example is Lin and Yen’s work [17]. In this method, the systemstarts with an initial placement of the nodes. Each link is assigneda rest length, and when it deviates from its rest length, it exerts aforce on the nodes at its end-point. At each iteration, the resultantforce on each node is calculated and the node is moved in the direction of the force. The AS network shown in Figure 1 has beenlaid out using the force-based method.Path distance based layout: The second layout method startsby detecting all the source and sink nodes. The source nodes (withonly outgoing edges) are placed at the bottom of the display, and thesink nodes are placed at the top. The system then uses a breadthfirst-search algorithm to assign a distance number to each remaining node. The distance number of a node is defined as its distancefrom the source. All the nodes with the same distance are placedin the same horizontal layer in the display. The method then uses aheuristic to place the nodes within each layer in a way that reduces, 5, & ,, & & &, 5 5! &!!!!, 5
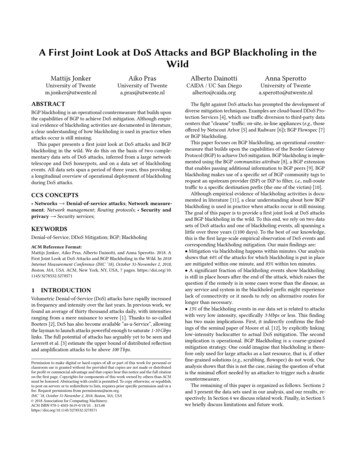
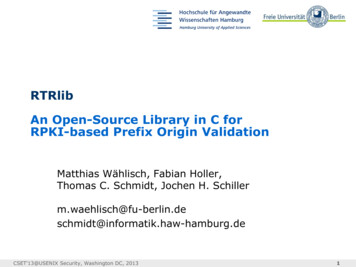
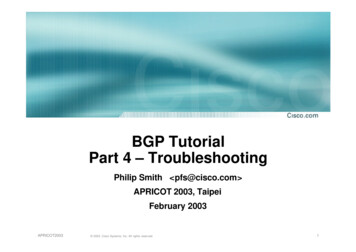
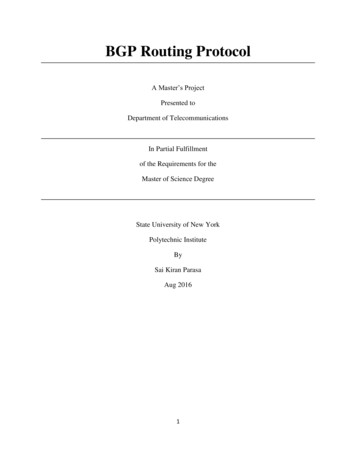
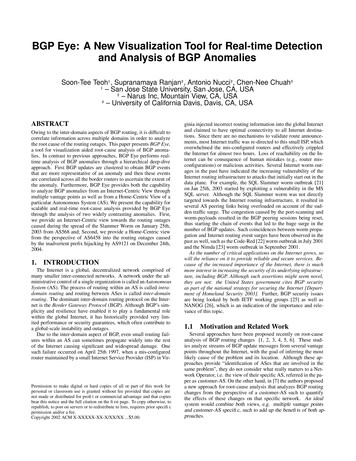
Figure 3: Circular layout of observation routers in the innerring, and peer routers in the outer ringFigure 1: Visualization of number of BGP events originatingfrom selected ASes and carried over selected AS-AS linksthe number of crossings of the links. Figure 2 shows an example ofthe distance-layer layout. ' ' ' !@ ' the curvedbetween the two nodes is ( line , ), . An example is shown in Figure 3.% ' ' ' ' ' Figure 4: Visualization of Prefixes Status from a Single BorderRouter.Figure 2: Layout of AS nodes according to their distance fromthe observation pointManual layout: In this method, we allow the user to manually adjust the position of each node by clicking and dragging thenode. This method can be used in conjunction with either of thetwo above methods.3.2 Home-Centric ViewAnother view provided by our system is the “Home-centric” view,where we focus on how the BGP events are observed from thecustomer-AS, much like how this term is used in Ball et. al’swork [18]. The first panel is shown in Figure 3. In this view, weplace the routers in the customer-AS in the inner ring, and theirpeer routers, belonging to other ASes, in the outer ring. In theouter layer, the method groups routers belonging to the same AStogether. We use a node placement algorithm to obtain a placementof the nodes that reduces the distance between connected nodes.After we have placed the
These existing visualization tools focus only on raw informa-tion, i.e. BGP updates, and do not give any deep insight into the problem. On this perspective, in this paper we introduce a new vi-sualization tool, called BGP Eye, that provides a real-time status of BGP activity with easy-to-read layouts. The tool has been de-