Transcription
Semiannual Report to ShareholdersJune 30, 2021Invesco Oppenheimer V.I. InternationalGrowth FundThe Fund provides a complete list of its portfolio holdings four times each fiscal year, at the end of each fiscal quarter. For the secondand fourth quarters, the list appears, respectively, in the Fund’s semiannual and annual reports to shareholders. For the first and thirdquarters, the Fund files the list with the Securities and Exchange Commission (SEC) as an exhibit to its reports on Form N-PORT. TheFund’s Form N-PORT filings are available on the SEC website, sec.gov. The SEC file numbers for the Fund are 811-07452 and033-57340. The Fund’s most recent portfolio holdings, as filed on Form N-PORT, have also been made available to insurancecompanies issuing variable annuity contracts and variable life insurance policies (“variable products”) that invest in the Fund.A description of the policies and procedures that the Fund uses to determine how to vote proxies relating to portfolio securities isavailable without charge, upon request, from our Client Services department at 800 959 4246 or at invesco.com/corporate/about-us/esg. The information is also available on the SEC website, sec.gov.Information regarding how the Fund voted proxies related to its portfolio securities during the most recent 12-month period endedJune 30 is available at invesco.com/proxysearch. The information is also available on the SEC website, sec.gov.Invesco Advisers, Inc. is an investment adviser; it provides investment advisory services to individual and institutional clients and doesnot sell securities. Invesco Distributors, Inc. is the US distributor for Invesco Ltd.’s retail mutual funds, exchange-traded funds andinstitutional money market funds. Both are wholly owned, indirect subsidiaries of Invesco Ltd.This report must be accompanied or preceded by a currently effective Fund prospectus and variable product prospectus, which contain morecomplete information, including sales charges and expenses. Investors should read each carefully before investing.NOT FDIC INSURED MAY LOSE VALUE NO BANK GUARANTEEInvesco Distributors, Inc.O-VIIGR-SAR-1
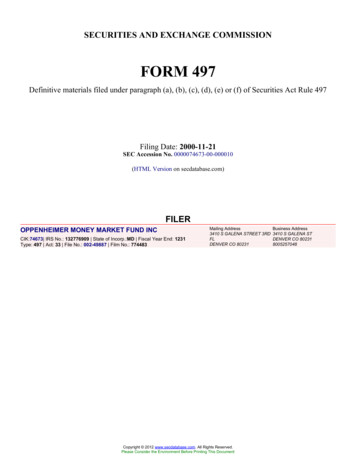
Fund PerformancePerformance summaryAverage Annual Total ReturnsFund vs. IndexesSeries I SharesInception (5/13/92)10 Years5 Years1 YearSeries II SharesInception (3/19/01)10 Years5 Years1 YearAs of 6/30/21Cumulative total returns, 12/31/20 to 6/30/21, excluding variable product issuer charges. If variableproduct issuer charges were included, returns would be lower.Series I SharesSeries II SharesMSCI All Country World ex-USA Index䊲6.87%6.919.16䊲Source(s): RIMES Technologies Corp.The MSCI All Country World ex-USA Index is an index considered representative ofdeveloped and emerging stock markets, excluding the US. The index is computed usingthe net return, which withholds applicable taxes for non-resident investors.The Fund is not managed to track the performance of any particular index, including theindex(es) described here, and consequently, the performance of the Fund may deviatesignificantly from the performance of the index(es).A direct investment cannot be made in an index. Unless otherwise indicated, indexresults include reinvested dividends, and they do not reflect sales charges. Performanceof the peer group, if applicable, reflects fund expenses; performance of a market indexdoes not.Effective May 24, 2019, Non-Service andService shares of the Oppenheimer International Growth Fund/VA, (the predecessorfund) were reorganized into Series I andSeries II shares, respectively, of InvescoOppenheimer V.I. International GrowthFund. Returns shown above, for periodsending on or prior to May 24, 2019, for Series I and Series II shares are those of theNon-Service shares and Service shares ofthe predecessor fund. Share class returnswill differ from the predecessor fund because of different expenses.The performance data quoted representpast performance and cannot guaranteefuture results; current performance may belower or higher. Please contact your variable product issuer or financial adviser forthe most recent month-end variable prod-Invesco Oppenheimer V.I. International Growth Funduct performance. Performance figures reflect Fund expenses, reinvested distributions and changes in net asset value.Performance figures do not reflect deduction of taxes a shareholder would pay onFund distributions or sale of Fund shares.Investment return and principal value willfluctuate so that you may have a gain orloss when you sell shares.Invesco Oppenheimer V.I. InternationalGrowth Fund, a series portfolio of AIM Variable Insurance Funds (Invesco Variable Insurance Funds), is currently offeredthrough insurance companies issuing variable products. You cannot purchase sharesof the Fund directly. Performance figuresgiven represent the Fund and are not intended to reflect actual variable productvalues. They do not reflect sales nses and fees assessed in connectionwith a variable product. Sales charges, expenses and fees, which are determined bythe variable product issuers, will vary andwill lower the total return.The most recent month-end performanceat the Fund level, excluding variable productcharges, is available at 800 451 4246. Asmentioned above, for the most recentmonth-end performance including variableproduct charges, please contact your variable product issuer or financial adviser.Fund performance reflects any applicablefee waivers and/or expense reimbursements. Had the adviser not waived feesand/or reimbursed expenses currently or inthe past, returns would have been lower.See current prospectus for more information.
Liquidity Risk Management ProgramIn compliance with Rule 22e-4 under the Investment Company Act of 1940, as amended (the “Liquidity Rule”), the Fund has adopted andimplemented a liquidity risk management program in accordance with the Liquidity Rule (the “Program”). The Program is reasonably designed to assess and manage the Fund’s liquidity risk, which is the risk that the Fund could not meet redemption requests without significant dilution of remaining investors’ interests in the Fund. The Board of Trustees of the Fund (the “Board”) has appointed Invesco Advisers, Inc. (“Invesco”), the Fund’s investment adviser, as the Program’s administrator, and Invesco has delegated oversight of the Programto the Liquidity Risk Management Committee (the “Committee”), which is composed of senior representatives from relevant businessgroups at Invesco.As required by the Liquidity Rule, the Program includes policies and procedures providing for an assessment, no less frequently than annually, of the Fund’s liquidity risk that takes into account, as relevant to the Fund’s liquidity risk: (1) the Fund’s investment strategy andliquidity of portfolio investments during both normal and reasonably foreseeable stressed conditions; (2) short-term and long-term cashflow projections for the Fund during both normal and reasonably foreseeable stressed conditions; and (3) the Fund’s holdings of cash andcash equivalents and any borrowing arrangements. The Liquidity Rule also requires the classification of the Fund’s investments into categories that reflect the assessment of their relative liquidity under current market conditions. The Fund classifies its investments into oneof four categories defined in the Liquidity Rule: “Highly Liquid,” “Moderately Liquid,” “Less Liquid,” and “Illiquid.” Funds that are not invested primarily in “Highly Liquid Investments” that are assets (cash or investments that are reasonably expected to be convertible intocash within three business days without significantly changing the market value of the investment) are required to establish a “Highly Liquid Investment Minimum” (“HLIM”), which is the minimum percentage of net assets that must be invested in Highly Liquid Investments.Funds with HLIMs have procedures for addressing HLIM shortfalls, including reporting to the Board and the SEC (on a non-public basis) asrequired by the Program and the Liquidity Rule. In addition, the Fund may not acquire an investment if, immediately after the acquisition,over 15% of the Fund’s net assets would consist of “Illiquid Investments” that are assets (an investment that cannot reasonably be expected to be sold or disposed of in current market conditions in seven calendar days or less without the sale or disposition significantlychanging the market value of the investment). The Liquidity Rule and the Program also require reporting to the Board and the SEC (on anon-public basis) if a Fund’s holdings of Illiquid Investments exceed 15% of the Fund’s assets.At a meeting held on March 22-24, 2021, the Committee presented a report to the Board that addressed the operation of the Programand assessed the Program’s adequacy and effectiveness of implementation (the “Report”). The Report covered the period from January 1, 2020 through December 31, 2020 (the “Program Reporting Period”). The Report discussed notable events affecting liquidity overthe Program Reporting Period, including the impact of the coronavirus pandemic on the Fund and the overall market. The Report notedthat there were no material changes to the Program during the Program Reporting Period.The Report stated, in relevant part, that during the Program Reporting Period:䡲 The Program, as adopted and implemented, remained reasonably designed to assess and manage the Fund’s liquidity risk and was operated effectively to achieve that goal;䡲 The Fund’s investment strategy remained appropriate for an open-end fund;䡲 The Fund was able to meet requests for redemption without significant dilution of remaining investors’ interests in the Fund;䡲 The Fund did not breach the 15% limit on Illiquid Investments; and䡲 The Fund primarily held Highly Liquid Investments and therefore has not adopted an HLIM.Invesco Oppenheimer V.I. International Growth Fund
Schedule of InvestmentsJune 30, 2021(Unaudited)SharesValueCommon Stocks & Other Equity Interests–95.51%Australia–1.15%CSL Ltd.Belgium–0.27%Galapagos N.V.(a)Canada–4.72%Alimentation Couche-Tard, Inc., Class BCAE, Inc.(a)Dollarama, Inc.ECN Capital Corp.Shopify, Inc., Class A(a)28,738 5,157,071China–3.32%Alibaba Group Holding Ltd., ADR(a)Tencent Holdings rk–2.58%Ascendis Pharma A/S, ADR(a)Novo Nordisk A/S, Class ��16.90%Adevinta ASA, Class B(a)Airbus SE(a)Dassault Systemes SEEdenredEssilorLuxottica S.A.Hermes InternationalKering S.A.L’Oreal S.A.LVMH Moet Hennessy Louis Vuitton SESartorius Stedim BiotechSEB S.A.Worldline ,226Germany–5.00%CTS Eventim AG & Co. KGaA(a)Infineon Technologies AGSAP SESiemens AGSiemens Healthineers 0,8722,743,3584,045,2266,573,58626,633,027Hong Kong–0.68%WH Group Ltd.4,019,0003,613,109India–2.82%Dr Lal PathLabs Ltd.(b)Reliance Industries 169,660,828Ireland–1.81%Flutter Entertainment PLC(a)Shares601,782Japan–7.72%Daikin Industries Ltd.Hitachi Ltd.Hoya Corp.Keyence Corp.Kobe Bussan Co. Ltd.Nidec Corp.Nihon M&A Center, Inc.Nitori Holdings Co. 6.38%Aalberts N.V.Adyen N.V.(a)(b)ASML Holding N.V.Boskalis WestminsterShop Apotheke Europe ,124,03314,286,404981,7192,967,09734,022,531New Zealand–1.11%Xero Ltd.(a)57,4485,900,744Spain–1.40%Amadeus IT Group S.A.(a)Prosegur Cash weden–6.46%Atlas Copco AB, Class AEpiroc AB, Class ASKF AB, Class BSwedish Match y Callebaut AGIWG PLC(a)Lonza Group AGSika AGSTMicroelectronics N.V.Temenos AGVAT Group 35,119,60931,233,217Taiwan–2.10%Taiwan Semiconductor Manufacturing Co. ,4551,921,7673,719,6919,709,433United Kingdom–15.32%Blue Prism Group PLC(a)boohoo Group PLC(a)Britvic PLCCompass Group PLC(a)ConvaTec Group PLC(b)Electrocomponents PLCEntain PLC(a)See accompanying Notes to Financial Statements which are an integral part of the financial statements.Invesco Oppenheimer V.I. International Growth FundValueItaly–1.52%Davide Campari-Milano N.V. 8,071,881
SharesUnited Kingdom–(continued)Legal & General Group PLCLondon Stock Exchange Group PLCMelrose Industries PLCNext PLC(a)Ocado Group PLC(a)Rightmove PLCTrainline PLC(a)(b)ValueSharesValuePreferred 1594,538879,354United States–8.39%Atlassian Corp. PLC, Class A(a)EPAM Systems, Inc.(a)Ferguson PLCJames Hardie Industries PLC, CDIMedtronic PLCResMed, Inc.17,85321,01542,466270,72034,16440,824Total Common Stocks & Other Equity Interests(Cost 270,305,117) 00%Zee Entertainment Enterprises Ltd., 6.00%,Pfd.(Cost 0)599,541 16,051Money Market Funds–2.19%Invesco Government & Agency Portfolio,4,075,951Institutional Class, 0.03%(c)(d)Invesco Liquid Assets Portfolio, Institutional2,947,936Class, 0.01%(c)(d)Invesco Treasury Portfolio, Institutional Class,4,658,2300.01%(c)(d)Total Money Market Funds (Cost 11,683,223)TOTAL INVESTMENTS IN SECURITIES—97.70%(Cost 281,988,340)OTHER ASSETS LESS LIABILITIES–2.30%NET 296520,709,05512,241,554 532,950,609509,009,708Investment Abbreviations:ADR – American Depositary ReceiptCDI – CREST Depository InterestPfd. – PreferredNotes to Schedule of Investments:(a)(b)(c)Non-income producing security.Security purchased or received in a transaction exempt from registration under the Securities Act of 1933, as amended (the “1933 Act”). The security may beresold pursuant to an exemption from registration under the 1933 Act, typically to qualified institutional buyers. The aggregate value of these securities atJune 30, 2021 was 43,425,353, which represented 8.15% of the Fund’s Net Assets.Affiliated issuer. The issuer and/or the Fund is a wholly-owned subsidiary of Invesco Ltd., or is affiliated by having an investment adviser that is under commoncontrol of Invesco Ltd. The table below shows the Fund’s transactions in, and earnings from, its investments in affiliates for the six months ended June 30, 2021.ValueDecember 31, 2020Purchasesat CostProceedsfrom SalesChange inUnrealizedAppreciationRealizedGainValueJune 30, 2021Dividend IncomeInvestments in Affiliated Money Market Funds:Invesco Government & Agency Portfolio, InstitutionalClassInvesco Liquid Assets Portfolio, Institutional ClassInvesco Treasury Portfolio, Institutional Class 3,150,8302,250,0593,600,948 16,686,431 (15,761,310)11,918,879 (11,220,047)19,070,206 (18,012,924) 216- 8- 4,075,9512,949,1154,658,230 509253210 9,001,8371,167,080(1,167,080)2,075,824(2,075,824) 50,918,420 (48,237,185) 216 8 11,683,2963*76* 1,051Investments Purchased with Cash Collateral fromSecurities on Loan:Invesco Private Government FundInvesco Private Prime FundTotal*(d)Represents the income earned on the investment of cash collateral, which is included in securities lending income on the Statement of Operations. Does notinclude rebates and fees paid to lending agent or premiums received from borrowers, if any.The rate shown is the 7-day SEC standardized yield as of June 30, 2021.Open Forward Foreign Currency eciation)USD 38,591CAD 47,826 (10)Contract toSettlementDateCounterpartyCurrency Risk07/02/2021State Street Bank & Trust Co.Abbreviations:CAD – Canadian DollarUSD – U.S. DollarSee accompanying Notes to Financial Statements which are an integral part of the financial statements.Invesco Oppenheimer V.I. International Growth Fund
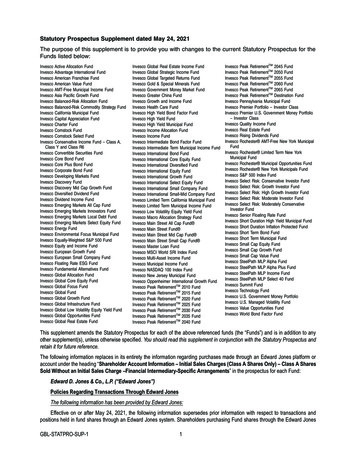
Portfolio CompositionBy sector, based on Net Assetsas of June 30, 2021Consumer DiscretionaryInformation TechnologyIndustrialsHealth CareConsumer StaplesCommunication ServicesMaterialsFinancialsEnergyOther Sectors, Each Less than 2% of Net AssetsMoney Market Funds Plus Other Assets Less 040.684.49See accompanying Notes to Financial Statements which are an integral part of the financial statements.Invesco Oppenheimer V.I. International Growth Fund
Statement of Assets and LiabilitiesStatement of OperationsJune 30, 2021For the six months ended June 30, 2021(Unaudited)(Unaudited)Assets:Investments in securities, at value(Cost 270,305,117)Investments in affiliated money market funds, at value(Cost 11,683,223)CashForeign currencies, at value (Cost 190,241)Receivable for:Investments soldFund shares soldDividendsInvestment for trustee deferred compensation andretirement plansTotal assetsInvestment income:Dividends (net of foreign withholding taxes of 211,066)Dividends from affiliated money market fundsTotal investment incomeLiabilities:Other investments:Unrealized depreciation on forward foreign currencycontracts outstandingPayable for:Investments purchasedFund shares reacquiredAccrued foreign taxesAccrued fees to affiliatesAccrued other operating expensesTrustee deferred compensation and retirement plansTotal liabilitiesNet assets applicable to shares outstandingNet assets consist of:Shares of beneficial interestDistributable earningsNet Assets:Series ISeries II 6448,01194,27151,6861,714,587 532,950,609 215,608,243317,342,366 532,950,609 242,924,783 290,025,826Expenses:Advisory feesAdministrative services feesCustodian feesDistribution fees - Series IITransfer agent feesTrustees’ and officers’ fees and benefitsReports to shareholdersProfessional services feesTaxesOtherTotal expensesLess: Fees waivedNet expensesNet investment incomeRealized and unrealized gain (loss) from:Net realized gain (loss) from:Unaffiliated investment securitiesAffiliated investment securitiesForeign currenciesChange in net unrealized appreciation (depreciation) of:Unaffiliated investment securities (net of foreign taxes of 132,866)Affiliated investment securitiesForeign currenciesForward foreign currency contractsNet realized and unrealized gainNet increase in net assets resulting from operationsShares outstanding, no par value, with an unlimited number ofshares authorized:Series I78,180,062Series II89,292,698Series I:Net asset value per share 3.11Series II:Net asset value per share 3.25See accompanying Notes to Financial Statements which are an integral part of the financial statements.Invesco Oppenheimer V.I. International Growth Fund ,422)216(101,005)(10)(1,660,221)33,339,883 33,604,278
Statement of Changes in Net AssetsFor the six months ended June 30, 2021 and the year ended December 31, 2020(Unaudited)June 30,2021Operations:Net investment income (loss)Net realized gainChange in net unrealized appreciation (depreciation)Net increase in net assets resulting from operationsDistributions to shareholders from distributable earnings:Series ISeries IITotal distributions from distributable earningsShare transactions–net:Series ISeries IINet increase (decrease) in net assets resulting from share transactionsNet increase in net assetsNet assets:Beginning of periodEnd of periodSee accompanying Notes to Financial Statements which are an integral part of the financial statements.Invesco Oppenheimer V.I. International Growth Fund December 31,2020264,39535,000,104(1,660,221)33,604,278 2,003)27,186,472501,883,723 532,950,609474,697,251 501,883,723
Financial Highlights(Unaudited)The following schedule presents financial highlights for a share of the Fund outstanding throughout the periods indicated.Net gains(losses)on securitiesDividends DistributionsNet assetNet(bothTotal from from netfrom netNet assetvalue, investmentbeginning income realized and investment investment realizedTotalvalue, end Total(a)of period (loss)unrealized) operations incomegainsdistributions of period return (b)Series ISix months ended 06/30/21Year ended 12/31/20Year ended 12/31/19Year ended 12/31/18Year ended 12/31/17Year ended 12/31/16Series IISix months ended 06/30/21Year ended 12/31/20Year ended 12/31/19Year ended 12/31/18Year ended 12/31/17Year ended 12/31/16(a)(b)(c)(d)(e)Ratio ofRatio ofexpensesexpensesto average to average netnet assets assets withoutwith fee waivers fee waiversNet assets,and/orand/orend of periodexpensesexpenses(000’s omitted)absorbedabsorbed(c) 2.912.452.032.592.082.20 0.00(0.00)0.020.020.020.03 0.200.520.54(0.51)0.52(0.08) 0.200.520.56(0.49)0.54(0.05) —(0.02)(0.02)(0.02)(0.03)(0.02) —(0.04)(0.12)(0.05)—(0.05) —(0.06)(0.14)(0.07)(0.03)(0.07) 9(2.12) 2)290,026271,421252,753199,636239,042175,633Ratio of netinvestmentincome(loss)to average Portfolionet assets turnover alculated using average shares outstanding.Includes adjustments in accordance with accounting principles generally accepted in the United States of America. Total returns are not annualized for periods less than one year, ifapplicable and do not reflect charges assessed in connection with a variable product, which if included would reduce total returns.Does not include indirect expenses from affiliated fund fees and expenses of 0.00% for the years ended October 31, 2019, 2018, 2017, and 2016, respectively.Portfolio turnover is calculated at the fund level and is not annualized for periods less than one year, if applicable.Ratios are annualized and based on average daily net assets (000’s omitted) of 229,490 and 278,953 for Series I and Series II shares, respectively.See accompanying Notes to Financial Statements which are an integral part of the financial statements.Invesco Oppenheimer V.I. International Growth Fund
Notes to Financial StatementsJune 30, 2021(Unaudited)NOTE 1—Significant Accounting PoliciesInvesco Oppenheimer V.I. International Growth Fund (the “Fund”) is a series portfolio of AIM Variable Insurance Funds (Invesco Variable Insurance Funds) (the “Trust”).The Trust is a Delaware statutory trust registered under the Investment Company Act of 1940, as amended (the “1940 Act”), as an open-end series managementinvestment company. Information presented in these financial statements pertains only to the Fund. Matters affecting the Fund or each class will be voted onexclusively by the shareholders of the Fund or each class. Current Securities and Exchange Commission (“SEC”) guidance, however, requires participating insurancecompanies offering separate accounts to vote shares proportionally in accordance with the instructions of the contract owners whose investments are funded byshares of each Fund or class.The Fund’s investment objective is to seek capital appreciation.The Fund currently offers two classes of shares, Series I and Series II, both of which are offered to insurance company separate accounts funding variable annuitycontracts and variable life insurance policies (“variable products”).The Fund is an investment company and accordingly follows the investment company accounting and reporting guidance in accordance with Financial AccountingStandards Board Accounting Standards Codification Topic 946, Financial Services – Investment Companies.The following is a summary of the significant accounting policies followed by the Fund in the preparation of its financial statements.A. Security Valuations — Securities, including restricted securities, are valued according to the following policy.A security listed or traded on an exchange (except convertible securities) is valued at its last sales price or official closing price as of the close of the customarytrading session on the exchange where the security is principally traded, or lacking any sales or official closing price on a particular day, the security may bevalued at the closing bid price on that day. Securities traded in the over-the-counter market are valued based on prices furnished by independent pricing servicesor market makers. When such securities are valued by an independent pricing service they may be considered fair valued. Futures contracts are valued at the finalsettlement price set by an exchange on which they are principally traded. Listed options are valued at the mean between the last bid and asked prices from theexchange on which they are principally traded. Options not listed on an exchange are valued by an independent source at the mean between the last bid and askedprices. For purposes of determining net asset value (“NAV”) per share, futures and option contracts generally are valued 15 minutes after the close of thecustomary trading session of the New York Stock Exchange (“NYSE”).Investments in open-end and closed-end registered investment companies that do not trade on an exchange are valued at the end-of-day net asset value pershare. Investments in open-end and closed-end registered investment companies that trade on an exchange are valued at the last sales price or official closingprice as of the close of the customary trading session on the exchange where the security is principally traded.Debt obligations (including convertible securities) and unlisted equities are fair valued using an evaluated quote provided by an independent pricing service.Evaluated quotes provided by the pricing service may be determined without exclusive reliance on quoted prices, and may reflect appropriate factors such asinstitution-size trading in similar groups of securities, developments related to specific securities, dividend rate (for unlisted equities), yield (for debt obligations),quality, type of issue, coupon rate (for debt obligations), maturity (for debt obligations), individual trading characteristics and other market data. Pricing servicesgenerally value debt obligations assuming orderly transactions of institutional round lot size, but a fund may hold or transact in the same securities in smaller, oddlot sizes. Odd lots often trade at lower prices than institutional round lots. Debt obligations are subject to interest rate and credit risks. In addition, all debtobligations involve some risk of default with respect to interest and/or principal payments.Foreign securities’ (including foreign exchange contracts) prices are converted into U.S. dollar amounts using the applicable exchange rates as of the close ofthe NYSE. If market quotations are available and reliable for foreign exchange-traded equity securities, the securities will be valued at the market quotations.Because trading hours for certain foreign securities end before the close of the NYSE, closing market quotations may become unreliable. If between the timetrading ends on a particular security and the close of the customary trading session on the NYSE, events occur that the investment adviser determines aresignificant and make the closing price unreliable, the Fund may fair value the security. If the event is likely to have affected the closing price of the security, thesecurity will be valued at fair value in good faith using procedures approved by the Board of Trustees. Adjustments to closing prices to reflect fair value may also bebased on a screening process of an independent pricing service to indicate the degree of certainty, based on historical data, that the closing price in the principalmarket where a foreign security trades is not the current value as of the close of the NYSE. Foreign securities’ prices meeting the approved degree of certaintythat the price is not reflective of current value will be priced at the indication of fair value from the independent pricing service. Multiple factors may be consideredby the independent pricing service in determining adjustments to reflect fair value and may include information relating to sector indices, American DepositaryReceipts and domestic and foreign index futures. Foreign securities may have additional risks including exchange rate changes, potential for sharply devaluedcurrencies and high inflation, political and economic upheaval, the relative lack of issuer information, relatively low market liquidity and the potential lack of strictfinancial and accounting controls and standards.Securities for which market prices are not provided by any of the above methods may be valued based upon quotes furnished by independent sources. The lastbid price may be used to value equity securities. The mean between the last bid and asked prices is used to value debt obligations, including corporate loans.Securities for which market quotations are not readily available or became unreliable are va
institutional money market funds. Both are wholly owned, indirect subsidiaries of Invesco Ltd. This report must be accompanied or preceded by a currently effective Fund prospectus and variable product prospectus, which contain more complete information, including sales charges and expenses. Investors should read each carefully before investing.