Transcription
458Baseline / Marine Pollution Bulletin 52 (2006) 447–468ReferencesBeiras, R., Fernández, N., González, J.J., Besada, V., Schultze, F., 2002.Mercury concentrations in seawater, sediments and wild mussels fromthe coast of Galicia (NW Spain). Marine Pollution Bulletin 44, 340–349.Birkett, J.W., Noreng, J.M.K., Lester, J.N., 2002. Spatial distribution ofmercury in the sediments and riparian environment of the River Yare,Norfolk, UK. Environmental Pollution 116, 65–74.Carreón-Martı́nez, L.B., Huerta-Diaz, M.A., Nava-López, C., SiqueirosValencia, A., 2001. Mercury and silver concentrations in sedimentsfrom the Port of Ensenada, Baja California, Mexico. Marine PollutionBulletin 42 (5), 415–418.Carreón-Martı́nez, L.B., Huerta-Diaz, M.A., Nava-López, C., SiqueirosValencia, A., 2002. Levels of reactive mercury and silver in sedimentsfrom the Port of Ensenada, Baja California, Mexico. Bulletin ofEnvironmental Contamination and Toxicology 68, 138–147.CONAPESCA, 2002. Indicadores de la actividad pesquera. Dirección deEstadı́stica y Registros Pesqueros. México DF.Consejo de Recursos Minerales, 1992. Monografı́a geológico-minera delestado de Sonora. Publicación M-8e, first ed., México.Garcı́a-Hernández, J., Glenn, E.P., Artiola, J., Baumgartner, D.J., 2000.Bioaccumulation of selenium (Se) in the Cienega de Santa ClaraWetland, Sonora, Mexico. Ecotoxicology and Environmental Safety46, 298–304.Garcı́a-Hernández, J., King, K.A., Velasco, A.L., Shumilin, E., Mora,M.A., Glenn, E.P., 2001. Selenium, selected inorganic elements, andorganochlorine pesticides in bottom material and biota from theColorado River Delta. Journal of Arid Environments 49 (1), 65–89.Garcı́a-Rico, L., Wilson-Cruz, S., Frasquillo-Félix, M.C., Jara-Marini,M.E., 2003. Total metals in intertidal surface sediment of oysterculture areas in Sonora, Mexico. Bulletin of Environmental Contamination and Toxicology 70, 1235–1241.Hylander, L.D., 2001. Global mercury pollution and its expected decreaseafter a mercury trade ban. Water, Air, and Soil Pollution 125, 331–344.Ikem, A., Egiebor, N.O., 2005. Assessment of trace elements in cannedfishes (mackerel, tuna, salmon, sardines and herrings) marketed inGeorgia and Alabama (United States of America). Journal of FoodComposition and Analysis 18, 771–787.Kot, F.S., Green-Ruiz, C., Páez-Osuna, F., Shumilin, E.N., Rodrı́guezMeza, D., 1999. Distribution of mercury in sediments from La PazLagoon, Peninsula of Baja California, México. Bulletin of Environmental Contamination and Toxicology 63, 45–51.Long, E.R., Morgan, L.G., 1991. The potential for biological effects ofsediment-sorbed contaminants tested in the national status and trendsprogram. Office of Coastal and Estuarine Assessment, Seattle, WA.Mahan, K.I., Foderaro, T.A., Garza, T.L., Martinez, R.M., Maroney,G.A., Trivisonno, M.R., Willging, E.M., 1987. Microwave digestiontechniques in the sequential extraction of calcium, iron, chromium,manganese, lead, and zinc in sediments. Analytical Chemistry 59 (7),938–945.Marins, R.V., Lacerda, L.D., Paraquetti, H.H.M., de Paiva, E.C., VillasBoas, R.C., 1998. Geochemistry of mercury in sediments of a subtropical coastal lagoon, Sepetiba Bay, southeastern Brazil. Bulletin ofEnvironmental Contamination and Toxicology 61, 57–64.McAloon, K.M., Mason, R.P., 2003. Investigations into the bioavailability and bioaccumulation of mercury and other trace metals to the seacucumber, Sclerodactyla briareus, using in vitro solubilization. MarinePollution Bulletin 46, 1600–1608.Méndez, L., Acosta, B., Alvarez-Castañeda, S.T., Lechuga-Devéze, C.H.,1998. Trace metal distribution along the southern coast of Bahia de LaPaz (Gulf of California), Mexico. Bulletin of Environmental Contamination and Toxicology 61, 616–622.Méndez, L., Alvarez-Castañeda, S.T., Acosta, B., Sierra-Beltrán, A.P.,2002a. Trace metals in tissues of gray whale (Eschrichtius robustus)carcasses from the northern Pacific Mexican Coast. Marine PollutionBulletin 44, 217–221.Méndez, L., Salas-Flores, L.M., Arreola-Lizarraga, A., Alvarez-Castañeda, S.T., Acosta, B., 2002b. Heavy metals in clams from GuaymasBay, Mexico. Bulletin of Environmental Contamination and Toxicology 68, 217–223.Miller, J.C., Miller, J.N., 1993. Errores en Análisis Instrumental;Regresión y Correlación. In: Estadı́stica para Quı́mica Analı́tica.Addison-Wiley Iberoamericana, Wilmington, Delaware, USA.Páez-Osuna, F., Gracia, A., Flores-Verdugo, F., Lyle-Fritch, L.P.,Alonso-Rodrı́guez, R., Roque, A., Ruiz-Fernández, A.C., 2003.Shrimp aquaculture development and the environment in the Gulf ofCalifornia ecoregion. Marine Pollution Bulletin 46, 806–815.Silva, L.F.F., Machado, W., LisboaFilho, S.D., Lacerda, L.D., 2003.Mercury accumulation in sediments of a mangrove ecosystem in SEBrazil. Water, Air, and Soil Pollution 145, 67–77.Willerer, A.O.M., Kot, F.S., Shumilin, E.N., Lutsarev, S., Rodrı́guez,A.J.M., 2003. Mercury in bottom sediments of the tropical RioMarabasco, its estuary, and Laguna de Navidad, Mexico. Bulletin ofEnvironmental Contamination and Toxicology 70, 1213–1219.0025-326X/ - see front matter Ó 2006 Elsevier Ltd. All rights reserved.doi:10.1016/j.marpolbul.2006.12.013Water quality of the Madang Lagoon, Papua New Guinea:A status reportAriadna Benet-Monicoaa,*, Sarah Cornell b, Paul Chatterton a, Lisette WilsonWWF, South Pacific Programme, PM Box, Madang, MP511, Papua New GuineabDepartment of Earth Sciences, University of Bristol, Bristol BS8 1RJ, UKcWWF, South Pacific Programme, PM Box, Port Moresby, Papua New GuineaVery little is known about the water quality parameters of marine ecosystems in Papua New Guinea*cCorresponding author. Address: 5 Torrington Court, 32 ShakespeareRoad, Mill Hill, London NW7 4BD, UK. Tel.: 44 20 89062909.E-mail address: ariadnabm@yahoo.com (A. Benet-Monico).(PNG). While several studies converge in classifying theseecosystems as among the richest in the world in terms ofmarine biodiversity (Pearse, 1988; Rau, 1988; Goslineret al., 1996; Maniwavie, 2000; Karlson et al., 2004),relatively little can be said about the status of theirwaters, although water pollution and pressures on marine
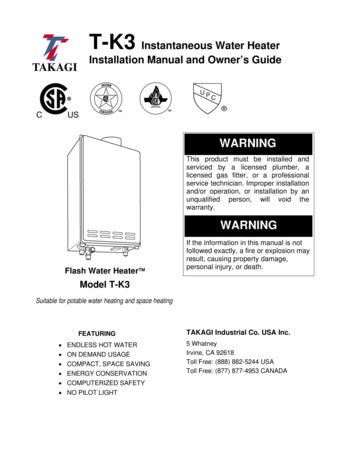
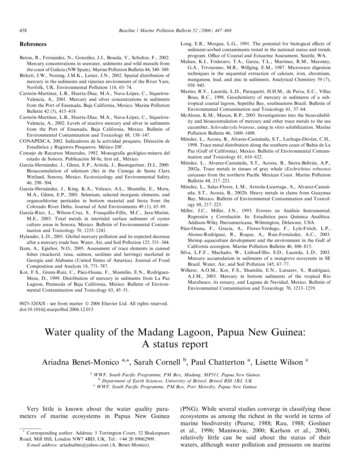
Baseline / Marine Pollution Bulletin 52 (2006) 447–469environments are increasingly becoming a concern amongcoastal people in PNG.The importance of the Madang Lagoon lies in its highlyheterogeneous, diverse and rich reef system (Pearse, 1988;Maniwavie, 2000; Jenkins, 2003). The Lagoon was designated a priority area for conservation (Alcorn, 1993), whichled Wetlands International to assist some communitiesalong the Lagoon to establish protection regimes (Fig. 1)(Jenkins, 2003). Currently, the natural resources of theLagoon are threatened. Coastal population growth, intensive agriculture, urban development and intense loggingactivities are aggravated by minimal planning for waste disposal and the lack of water purification systems (Fig. 1)459(Hunnam et al., 2001; Benet Monico, in preparation). Consequently, there is an intention to develop an IntegratedCoastal Zone Management Plan for the Lagoon. In thiscontext, the Water Quality Monitoring (WQM) aims atdefining a baseline for a suite of physical and chemical waterquality indicators, and at identifying warning signals if anyproblems were already evident. This study represents thefirst extensive water quality assessment conducted in theNorth Coast of PNG, and describes a robust and easymethod that could be applied in similar conditions.The Madang Lagoon (5 S 145 E) is the largest Lagoonin the North Coast of PNG (approximate area 50 km2). Itis bordered on its seaward edge by a narrow barrier reefFig. 1. Map of the Madang Lagoon. Sea sampling sites (black dots) are labeled as nA to nD and river sampling sites as Rn. The map indicates allprotected areas (boxes), mangrove habitats (thick grey lines) and coral reef habitats (thin grey lines) in the Madang Lagoon area. Also, it locates industry(square dots), logging concessions (dotted areas) and agricultural land (stripped areas) occurring along the Lagoon. Passages connecting the Lagoon withthe open sea are labeled in italics.
460Baseline / Marine Pollution Bulletin 52 (2006) 447–468with four major passages that link the Lagoon to the opensea (Fig. 1). The barrier reef is steep-sided on the seawardside, dropping to seabed depths of 400 m–1 km (Jebb andLowry, 1995). The Lagoon is even in depth (30–40 m),and its bed is a thick layer of silt clay with numerous shallow patch reefs and coral rubble islands. The inner coastline is greatly dissected. It has shallow fringing reefs,mangroves and sea grass habitats (Fig. 1). The Lagoon harbors spawning aggregation sites, nursery areas and holoturian and burrowing fauna (Rau, 1988; Pearse, 1988). Theclimate includes precipitation of about 3000 mm per yearand is strongly influenced by El Niño Southern Oscillation(ENSO) events (Jebb and Lowry, 1995). Surface marinetemperatures of 27–30 C are among the highest knownin tropical regions. Visibility is generally poor by tropicaloceanic standards, rarely exceeding 20 m. The New GuineaCurrent (NGCU), at a depth of 200 m, has high salinity,low tritium and high dissolved oxygen concentration anddominates the oceanography of the northern New Guineanwaters (Tsuchiya et al., 1990). NGCU upwellings occurwhen changes in the direction of surface currents, asobserved in the Madang Lagoon (Jenkins, 2003). Twomajor rivers discharge into the Lagoon: the Biges and theMeiro (Fig. 1). During heavy rain, water coming fromthe Gum and Gogol rivers, located to the south of theLagoon, also enters the Lagoon through God Awanpassage reducing visibility and causing localised siltation.In coastal waters, organic matter, nutrients, microorganisms, metals and toxicants are the most criticalcontaminants. Most of these occur naturally in the sea.Information on the natural background level of thesecontaminants is key to designing management plans toprevent the accumulation of these substances to the levelof pollutants, which might impact on marine ecosystemsand human health (UNEP, 1982).In order to investigate the level and variation of contaminants in Madang Lagoon, a total of 41 sites within theLagoon (nA to nD) and eight sites on rivers and creeks(R1A to R6B) were sampled between May 2002 and April2003 (Fig. 1). The Lagoon was divided into 12 transects(1–12). Several points along each transect were sampled(A-coast to D-ocean) to assess changes in the parametersacross the width of the Lagoon. The physical parametersplus dissolved oxygen (DO) were measured up to six timesboth at surface and 15 m depth. Temperature, pH, conductivity and salinity were measured with a field-based YSI 63meter. DO was measured with a field-based YSI 58 meter.Calibration of both meters was done according to manufacturer guidelines. Water clarity (the inverse of turbidity)was measured using a Secchi disc. The range of other chemical parameters that could be included in this study wasconstrained by the limited testing facilities available atthe National Analytical Laboratories in Lae. BiologicalOxygen Demand (BOD), phosphates and a suite of tracemetals (arsenic, cadmium, copper, lead and mercury) weremeasured three times using standard techniques. Watersamples for analysis of BOD and phosphorus werecollected in 500 ml polyethylene bottles, pre-rinsed withsample before complete filling. Sediment samples formetals analysis were collected from the Lagoon bottomor the nearest beach into a polythene bag using a plasticscoop. Each sample bag was placed into a second sealedbag for storage, to avoid cross-contamination of samples.Water samples for faecal coliforms analysis were collectedin 250 ml sterile bottles, which were opened and closedbeneath the water surface, and immediately sealed withTeflon tape. All water samples were kept in an Esky chillbox, and cooled with ice while sampling. After sampling,all bottles were stored at 5 C overnight, and flown toLae the following morning in a refrigerated Esky. No fieldblanks or internal standards were included in this monitoring programme, although in the longer term, includingthese in the protocol would permit the detection of accidental contamination or laboratory discrepancies.To analyse the data, sampling sites were groupedaccording to the three different natural environments existing at the Madang Lagoon: (1) river outlets, (2) coastalareas without rivers, and (3) inshore and offshore sites.Trigger values for management responses were calculatedin relation to the average values of the indicators assessedfor each of the environments. The lack of previous waterquality studies along the North Coast of PNG has hinderedthe identification of an appropriate reference systems, thusimpeding the derivation of low-risk trigger concentration values with which to compare the current results(NWQMS, 2000). With studies of coral reef and fish suggesting that the Lagoon is a moderately pristine area, theLagoon itself was defined a reference site. Mean values ofreplicates (medians when high variability was observed)were calculated for the physical parameters and DO at eachsampling site. Sites with fewer than four observations wereexcluded. The mean (or median) was calculated for eachcategory at surface and 15 m depth. Low-risk trigger valuesfor each category were defined as the mean one standarddeviation (or median and 80th percentile and 20th percentile). Mean (or median) values for individual sampling sitesfar outside the low-risk trigger value would be consideredas warning signals of potential pollution. The low numberof replicates for metals, chemical and microbiologicalparameters precluded this type of statistical approach.Therefore the interim trigger values described in theAustralian NWQMS Guidelines were used as a genericindication of a good water quality situation (NWQMS,2000). The data obtained have been interpreted in the lightof these threshold values. Samples falling outside theinterim trigger value in more than one of the surveysare highlighted in the discussion below and this forms thebasis for the ongoing development of this monitoringprotocol.Table 1 summarises the low-risk trigger values of themeasured indicators for the three categories at both surfaceand 15 m depth. These values were similar to the interimtrigger values listed in the Australian Guidelines for coastaland open waters (data not shown) (NWQMS, 2000).
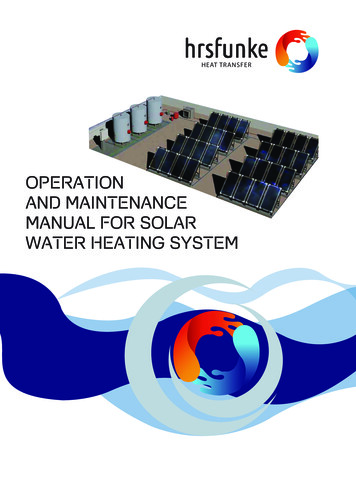
93.9)8.02 0.098.08 0.07s-surface, d-depth.29.39 0.52Inshore/offshore(n 19)29 .9)7.85 0.227.97 0.1729.18 0.3930.07 0.83Coast(ns 15/nd 12)15 m–23.58(21.5–28.3)Surface15 m–39.83(32.7–54.4)Surface15 m–80.85(75.2–84.9)Surface15 m–7.8 0.21Surface15 m–Surface30.86 0.61Mean st. devMean st. devRiver outlet(n 7)Salinity 0%ile)Conductivity (mS cm 1)Dissolved oxygen (% sat)pHT ( C)Table 1Low-risk trigger values calculated as the mean one standard deviation for temperature and pH, and the 80%ile–20%ile of the median for DO, conductivity and salinity for the three naturalenvironment categories found at the Madang LagoonBaseline / Marine Pollution Bulletin 52 (2006) 447–469461In agreement with previous data, Madang water temperatures ranged from 29 to 31 C (Jenkins, 2003; Tamataet al., 1993). Deep water temperatures were consistentlylower than their surface counterparts (Table 1). Temperature declines from the coast to the ocean, because of lesswater movement and greater depth. River outlet pointshave greater temperature variation due to the influence ofthe river (Fig. 2(A)). Water temperature tends to decreasewhen heavy rain had occurred the night before sampling.In tropical climates, where temperature variation is low,changes in temperature may have important effects on thegrowth and reproduction of the biota and enhance coralbleaching (NWQMS, 2000; Hoegh-Guldberg, 1999),although critical temperatures are specific to each ecosystem (Brown et al., 2000). The NWQMS guidelines indicatea maximum permissible increase of 2 C over the temperature for optimal growth, which in the case of MadangLagoon is unknown. Points 9A and 9B had average temperatures of 32.2 C, almost two degrees above the set trigger value for coastal waters. Two factors may contribute tothis observed deviation: (1) the sampling site 9B is locatedin a narrow and shallow harbour and water at this point isvery static; and (2) the sampling point 9 A is at the outlet ofa small creek carrying hot water from the food processingindustry near to it.pH trigger values increased slightly from river outlets toinshore–offshore waters, both at the surface and 15 m(Table 1). Little pH variation was observed amonginshore–offshore sample sites (Fig. 2(B)). Changes in pHcan cause direct adverse effects on aquatic organisms, andmay also alter the toxicity or speciation of several pollutants (NWQMS, 2000). No significant departures fromthese conditions were found in sea values. In rivers, sitesR6A and R6B were found to have very low pH values,reaching 4.5 in one of the surveys. Such low pH values werenot seen in any of the other points, and are well below theinterim trigger value for freshwaters (NWQMS, 2000).They may be indicative of leaching or dumping of liquidwastes into the river system.Whilst the Lagoon’s surface waters were strongly influenced by freshwater input, stratification effects kept deepwater more constant (Table 1). River outlets and surrounding waters had low and very variable salinity values ranging from 1.7 ppt to 33 ppt (Fig. 3(A)). Conversely,coastal and inshore–offshore sites had consistent andhigher salinity values across the Lagoon, in agreement withother studies (Furnas and Brodie, 1996). Accordingly, conductivity was also variable and low in river outlets andhigher and more consistent in coast and offshore–inshoresites (Fig. 3(B)). Lower values of both salinity and conductivity correlated with precipitation on the mountain ranges.Most aquatic biota can tolerate a range of conductivity,but marine biota is especially sensitive to decreased salinity(the ionic composition). Near the coast these parametersare episodically subject to changes due to enhancedfreshwater runoff. Consequently reefs and corals near thecoast, such as those at Madang, may have a higher
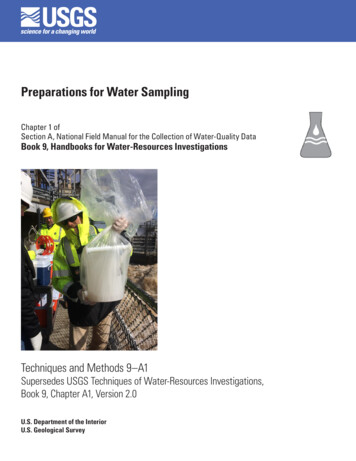
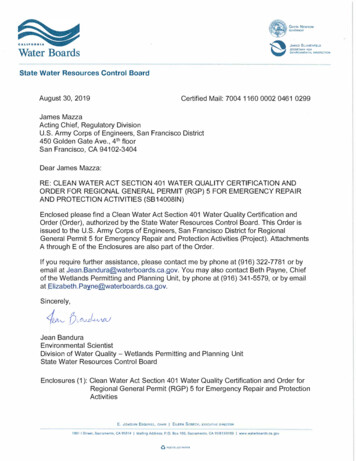
462Baseline / Marine Pollution Bulletin 52 (2006) 447–468Fig. 2. Box-plots of the mean and standard deviations of replicates at each sampling point for Temperature— C (A) and pH (B) at both surface ( ) and15 m depth ( ). Sampling sites are grouped in the three natural environment categories: river outlets, coast and inshore–offshore. Trigger value (overallmean) represented for surface (- -) and 15 m (– –).resilience. Points 9B and 12C had median salinity wellbelow the trigger value calculated for coastal points(Fig. 3(A)), and therefore should be taken into consideration for further surveillance. Strong variability in conductivity readings was also observed in rivers. Although mostof the values were below 400 lS cm 1, well within theNWQMSguidelinesrecommendthresholdof1500 lS cm 1 readings ranged from 140 to 41,000 lScm 1. The high variability may be attributable to naturalgeology and hydrological variability, local contaminationat the sampling sites, and possibly to the suspended solidsthat affected meter readings.The large degree of DO variability observed in the Madang Lagoon might reflect the influence of organic matter inthe water and its decomposition rate, since DO readingswere higher in coastal sites close to vegetation such as riveroutlets and seagrass beaches (Fig. 4). The median value ofDO at 15 m is higher than the surface median (Table 1), butonly three sets of observations for DO at 15 m wererecorded, so no statistical treatment is appropriate, andDO at 15 m has therefore not been represented in Fig. 4.Low DO concentrations have adverse effects on manyaquatic organisms, and can cause sediments to releasenutrients and toxicants to the water column. Points 9Aand 9B have surface median DO values very markedlylower than the identified trigger value, with only 50% saturation. This generally indicates high levels of organic matter or rapid biological activity. It could be attributed eitherto the natural characteristics of these sites (rich in mangroves and seagrass), or to the organic contents of thewater discharged by the food processing industry (point9A). DO readings in the rivers are generally very low, withsite R6A plummeting to 10% saturation on two differentsampling days, representing a significant water qualityconcern.Visibility in the Lagoon was generally poor by tropicalstandards, ranging from 1 to 21 m, although readingsabove 15 m were rare. At river outlets, turbidity was highest. Changes in light penetration have a critical effect onmarine biota. The particulate matter can bury hard coralsas it sediments out from the water column and alter thestructure and nutrient dynamics of reef surfaces (Bilgerand Atkinson, 1995). Water clarity is highly dependenton rainfall. Seven years of sampling in the Great BarrierReef have shown that the peak for sediment input carriedby rivers happens at the beginning of the wet season(Mitchell et al., 1996) and very similar behaviour wasobserved in this study. Extensive plumes of silty water were
Baseline / Marine Pollution Bulletin 52 (2006) 447–469463Fig. 3. Box-plots of the media and first and third quartiles of replicates at each sampling point for conductivity—mS/cm (A) and salinity—ppt (B), at bothsurface ( ) and 15 m depth ( ). Sampling sites are grouped in the three natural environment categories: river outlets, coast and inshore–offshore. Triggervalue (overall media) represented for surface (- -) and 15 m (– –).observed in the Madang Lagoon on the days after heavyrains in the Adelbert Ranges, which were associated witha decrease in water clarity, as previously described by Jebband Lowry (1995). Oil spills coming from the wharf at thenorthern end of the Lagoon have been repeatedly reportedby local people, and the impact of these was also observedat times during sampling.Dissolved phosphorus was analysed in just two of the sixsurveys. The analytical laboratory’s limit of detection fordissolved reactive phosphorus was 50 lg L 1, which isclose to the accepted NWQMS trigger values (55 lg L 1).At Madang Lagoon, dissolved phosphorus concentrationsranged from 50 to 245 lg L 1. River concentrations weregenerally higher than in the sea (around 100 lg L 1) andFig. 4. Box-plots of the media and first and third quartiles of replicates at each surface sampling point for dissolved oxygen (% of saturation). Samplingsites are grouped in the three natural environment categories: river outlets, coast and inshore–offshore. Surface trigger value (overall media) (- -).
464Baseline / Marine Pollution Bulletin 52 (2006) 447–468Table 2Faecal coliform counts and BOD in the Madang feeder river sitesSampleRiverFaecal coliforms (counts/100 ml)BOD (mg/l)R1.AR1.BR2.AR3.AR4.AR5.AR6.AR6.BBiges, NBiges, SNagadaMissMeiroMarrainSiar Creek1Siar Creek2200028008900c69000c670014009000c560not samplednot c07030301150c6200cnot sampled625c107000c07.37b 1 1 1 11.0610.4a 13.86b3.042.93.2not sampled3.08109.05a3.66Highly polluted.Semi-polluted.Unacceptable levels.Table 3Metals range found in the Madang LagoonMetal (lg g 1)AsCdCuPbHgThis studyNHMRC .04–0.241aANZECC (1992) admissible trigger levels for metals.higher than the accepted trigger values for freshwater(37 lg L 1). Sample R6A contained 4149 lg L 1 in onesurvey, a very high concentration for a natural aquaticsystem.As expected in this relatively pristine environment,almost all surface values for BOD5 along the MadangLagoon were 62 mg L 1, indicative of unpolluted waters(Clark, 1986). River samples, on the other hand, showeda different picture (Table 2). R1A (Biges River, North)had BOD5 values falling in the category of semi-pollutedto polluted waters. Similarly, BOD5 values at R6A wereindicative of highly polluted waters.The World Health Organisation’s faecal coliforms (FC)criterion for marine bathing waters is 350 FC in 100 ml ofwater (WHO, 1983). In Madang Lagoon, the variation inFC counts was very high, not only between points but alsoat the same point in different surveys (Table 2). In one ofthe surveys, FC counts were significantly higher than inthe other surveys, and the possibility of problems in sampleprocessing could not be excluded. Most of the assessed sitesin the Madang Lagoon had coliform counts lower than theWHO threshold. Only points 1A and 12B had valueshigher than 350 (ranging from 90 to 3250 counts per100 ml) in more than one survey. In most of the sampledrivers, FC counts tend to be higher than the recommendedtrigger value in at least one of the surveys (Table 2). TheMarrain, Miss and Nagada rivers and Siar Creek were ofgreatest concern since high values ( 1000 counts) wereobserved repeatedly.High variability in As, Cd, Cu, Pb and Hg concentrations and the low number of surveys only allow generalconclusions to be drawn. However these metals should beincluded in the routine monitoring programme and thesesurveys show that this is feasible with the protocol pro-posed. In general metal concentrations were lower thanthe ANZECC (1992) admissible trigger levels for metalsin sediments (Table 3).This study gives the first assessment of the water chemical quality of the Madang Lagoon, and the protocol developed for this assessment is robust enough to be carried outin the field using the facilities available, and also intensiveenough to capture the broad-scale characteristics of theLagoon. Interim low-risk trigger values are calculated asindicators of good quality.The data described above indicate that the Lagoon isstill in a relatively pristine state, with most indicators generally at natural concentrations for this type of system.Most of the indicators, especially those inshore andoffshore, had concentrations within the trigger levelsdetermined by the survey campaigns or lower than theNWQMS or WHO interim trigger levels. However, signsof pollution were found in the neighbouring of the foodprocessing industry (points R6.A, 9A and 9B). Therefore,these points have been flagged as a key location for a futuremonitoring programme. Nevertheless, the biologicalassessment currently under way at the sampling sitesshould complement the water quality monitoring programme. To make the water quality assessment protocoloperational as a monitoring tool for integrated management of the Lagoon, the recommendations are to:1. Continue the monitoring for at least a further year toallow a better estimation of the variability of theassessed parameters and to investigate possible trendsthat would affect the definition of the baseline state ofthe Lagoon.2. Conduct further investigations and monitoring of theidentified sources of pollution.
Baseline / Marine Pollution Bulletin 52 (2006) 447–4693. Daily water checking should be done at one or twopoints, to establish the seasonal behaviour of the physical parameters.4. Consolidate the water quality monitoring with otherbiodiversity and resource use surveys planned for Madang Lagoon to either confirm or reject the assumptionthat the current state of the Lagoon is a fair referencestate. A more integrated approach including biologicalassessment would give a more complete picture ofchanges in reef health than from the monitoring of contaminants alone.AcknowledgementsThis work was part of the WWF South Pacific Programme based in Madang, Papua New Guinea (madang@wwfpacific.org.pg). It was funded through grantsfrom the UK Department for International Development,McArthur Foundation and the Packard Foundation. Special thanks to Paul Led, Didic Kazaz and John Mizeu fortheir assistance in the water quality monitoring. Also manythanks to Michele Bowe for reviewing this paper.ReferencesAlcorn, J.B. (Ed.), 1993. Papua New Guinea Conservation NeedsAssessment Biodiversity Support Program, Government of PapuaNew Guinea, Department of Environment and Conservation. Corporate Press Inc., Landover, MD.Bilger, R.W., Atkinson, M.J., 1995. Effects of nutrient loading on masstransfer rates to a coral-reef community. Limnology and Oceanography 40, 279–289.Brown, B.E., Dunne, R.P., Goodson, M.S., Douglas, A.E., 2000. Marineecology: bleaching patterns in reef corals. Nature 404, 142–143.Clark, R.B., 1986. Marine Pollution. Clarendon Press, Oxford, UK,p. 215.Furnas, M.J., Brodie, J., 1996. Current status of nutrient levels and otherwater quality parameters in the great barrier reef. In: Hunter, H.M.,Eyles, A.G., Rayment, G.E. (Eds.), Downstream Effects of Land Use.Department of Natural Resources, Brisbane, Australia, pp. 9–21.Gosliner, T.M., Behrens, D.W., Williams, G.C., 1996. Coral reef animalsof the Indo-Pacific. Source Sea Challengers, Monterey, CA.0025-326X/ - see front matter Ó 2006 Elsevier Ltd. All rights gh-Guldberg, O., 1999. Coral bleaching, climate change and the futureof the world’s coral reefs. Marine and Freshwater Research 50, 839–866.Hunnam, P., Jenkins, A., Kite, N., Shearman, P., 2001. Marine resourcemanagement and conservation planning. Bismarck-Solomon SeasEcoregion: Papua New Guinea, Solomon Islands. Worldwide Fundfor Nature South Pacific Program, Fiji. Available from: http://www.wwfpacific.org.fj/pdfs/marine report.pdf.Jebb, M.H.P., Lowry, J.K., 1995. Natural history of Madang Lagoon withan Appendix of collecting localities. Records of the AustralianMuseum 22 (Suppl.), 1–14.Jenkins, A., 2003. Sinub Marine Wildlife Management Area. WetlandsInternational Oceania Program, Canberra, Australia.Karlson, H.R., Cornell, H.V., Hughes, T.P., 2004. Coral communities areregionally enriched along the oceanic biodiversity gradient. Nature429, 8
Fig. 1. Map of the Madang Lagoon. Sea sampling sites (black dots) are labeled as nA to nD and river sampling sites as Rn. The map indicates all protected areas (boxes), mangrove habitats (thick grey lines) and coral reef habitats (thin grey lines) in the Madang Lagoon area. Also, it locates industry