Transcription
1020437 Ch03 p074-1217/13/074:55 AMPage 7433.1 Measures of Central Tendency: Mode, Median,and Mean3.2 Measures of Variation3.3 Percentiles and Box-and-Whisker PlotsWhile the individual man is an insolvablepuzzle, in the aggregate he becomes amathematical certainty. You can, forexample, never foretell what any one manwill do, but you can say with precisionwhat an average number will be up to.—Arthur Conan Doyle,The Sign of FourFor on-line student resources,visit math.college.hmco.com/students and follow theStatistics links to the Brase/Brase, Understandable Statistics,9th edition web site.74Sherlock Holmes spoke these words to hiscolleague Dr. Watson as the two wereunraveling a mystery. The detective wasimplying that if a single member is drawnat random from a population, we cannotpredict exactly what that member will looklike. However, there are some “average” features ofthe entire population that an individual is likely topossess. The degree of certainty with which we wouldexpect to observe such average features in any individual depends on our knowledge of the variationamong individuals in the population. SherlockHolmes has led us to two of the most important statistical concepts: average and variation.
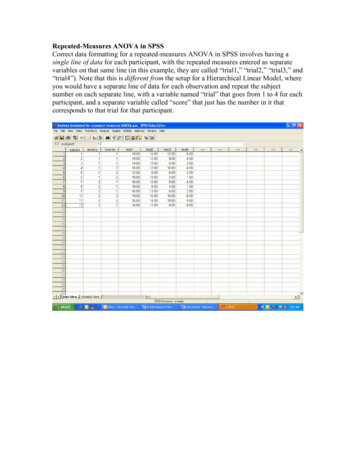
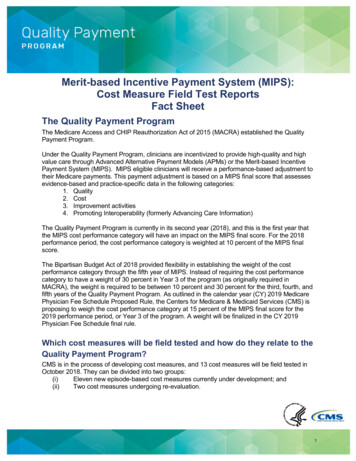
1020437 Ch03 p074-1217/13/074:55 AMPage 75Averages and VariationP R EVI EW QU ESTIONSWhat are commonly used measures of central tendency? What dothey tell you? (SECTION 3.1)How do variance and standard deviation measure data spread?Why is this important? (SECTION 3.2)How do you make a box-and-whisker plot, and what does it tellabout the spread of the data? (SECTION 3.3)FOCUS PROBLEMThe Educational AdvantageIs it really worth all the effort to get a college degree? From a philosophicalpoint of view, the love of learning is sufficient reason to get a college degree.However, the U.S. Census Bureau also makes another relevant point.Annually, college graduates (bachelor’s degree) earn onaverage 23,291 more than high school graduates. Thismeans college graduates earn about 83.4% more thanhigh school graduates, and according to “EducationPays” on the next page, the gap in earnings is increasing. Furthermore, as the College Board indicates, formost Americans college remains relatively affordable.After completing this chapter, you will be able toanswer the following questions.(a) Does a college degree guarantee someone an 83.4%increase in earnings over a high school degree?Remember, we are using only averages from censusdata.(b) Using census data (not shown in “EducationPays”), it is estimated that the standard deviationof college-graduate earnings is about 8,500.Compute a 75% Chebyshev confidence intervalcentered on the mean ( 51,206) for bachelor’sdegree earnings.(c) How much does college tuition cost? That depends,of course, on where you go to college. Construct aweighted average. Using the data from “CollegeAffordable for Most,” estimate midpoints for the75
1020437 Ch03 p074-121767/13/07Chapter 34:55 AMPage 76AVERAGES AND VARIATIONcost intervals. Say 46% of tuitions cost about 4,500; 21% cost about 7,500;7% cost about 12,000; 8% cost about 18,000; 9% cost about 24,000; and9% cost about 31,000. Compute the weighted average of college tuitioncharged at all colleges. (See Problem 9 in the Chapter Review Problems.)Education PaysAverage annual salary gap increases byeducation level 90,000Advanceddegree 88,471 80,000 70,000Bachelor’sdegree 51,206 60,000 50,0009%8%7%High schooldiploma 27,915 40,000 30,000 20,00019751985199746%2003Source: The College BoardSource: Census BureauSECTION 3.1 3,000 to 5,99921%No diploma 18,734 10,0009%Measures of Central Tendency: Mode, Median, and MeanFOCUS POINTS Compute mean, median, and mode from raw data.Interpret what mean, median, and mode tell you.Explain how mean, median, and mode can be affected by extreme data values.What is a trimmed mean? How do you compute it?Compute a weighted average.This section can be covered quickly. Gooddiscussion topics include The Story of OldFaithful in Data Highlights, Problem 1:Linking Concepts, Problem 1; and the tradewinds of Hawaii (Using Technology).The average price of an ounce of gold is 420. The Zippy car averages 39 miles pergallon on the highway. A survey showed the average shoe size for women is size 8.In each of the preceding statements, one number is used to describe the entiresample or population. Such a number is called an average. There are many waysto compute averages, but we will study only three of the major ones.The easiest average to compute is the mode.The mode of a data set is the value that occurs most frequently.EX AM P LE 1ModeCount the letters in each word of this sentence and give the mode. The numbersof letters in the words of the sentence are5372442483434Scanning the data, we see that 4 is the mode because more words have 4 lettersthan any other number. For larger data sets, it is useful to order—or sort—thedata before scanning them for the mode.Not every data set has a mode. For example, if Professor Fair gives equalnumbers of A’s, B’s, C’s, D’s, and F’s, then there is no modal grade. In addition,
1020437 Ch03 p074-1217/13/074:55 AMPage 77Section 3.1MedianThe notation x– (read “x tilde”) is sometimesused to designate the median of a data set.P ROCEDU R EMeasures of Central Tendency: Mode, Median, and Mean77the mode is not very stable. Changing just one number in a data set can changethe mode dramatically. However, the mode is a useful average when we want toknow the most frequently occurring data value, such as the most frequentlyrequested shoe size.Another average that is useful is the median, or central value, of an ordereddistribution. When you are given the median, you know there are an equal number of data values in the ordered distribution that are above it and below it.HOW TO FIND THE MEDIANThe median is the central value of an ordered distribution. To find it,1. Order the data from smallest to largest.2. For an odd number of data values in the distribution,Median Middle data value3. For an even number of data values in the distribution,Median EX AM P LE 2Sum of middle two values2MedianWhat do barbecue-flavored potato chips cost? According to Consumer Reports,Volume 66, No. 5, the prices per ounce in cents of the rated chips are191927281835(a) To find the median, we first order the data, and then note that there are an evennumber of entries. So the median is constructed using the two middle values.181919272835middle valuesMedian 19 27 23 cents2(b) According to Consumer Reports, the brand with the lowest overall taste rating costs 35 cents per ounce. Eliminate that brand, and find the medianprice per ounce for the remaining barbecue-flavored chips. Again order thedata. Note that there are an odd number of entries, so the median is simplythe middle value.18191927 middle value28Median middle value 19 cents(c) One ounce of potato chips is considered a small serving. Is it reasonable tobudget about 10.45 to serve the barbecue-flavored chips to 55 people?Yes, since the median price of the chips is 19 cents per small serving. Thisbudget for chips assumes that there is plenty of other food!
1020437 Ch03 p074-121787/13/07Chapter 34:55 AMPage 78AVERAGES AND VARIATIONThe median uses the position rather than the specific value of each data entry.If the extreme values of a data set change, the median usually does not change.This is why the median is often used as the average for house prices. If one mansion costing several million dollars sells in a community of much-lower-pricedhomes, the median selling price for houses in the community would be affectedvery little, if at all.GUIDED EXERCISE 1Median and modeBelleview College must make a report to the budget committee about the average credit hour loada full-time student carries. (A 12-credit-hour load is the minimum requirement for full-time status.For the same tuition, students may take up to 20 credit hours.) A random sample of 40 studentsyielded the following information (in credit 2151612182019121518141617151912131215(a) Organize the data from smallest to largestnumber of credit hours.1212121212121212 12 121313131314141414 15 1515 15 15 151616 161617181819 20 201717181917 17(b) Since there are an(odd, even) numberof values, we add the two middle values anddivide by 2 to get the median. What is themedian credit hour load?There are an even number of entries. The twomiddle values are circled in part (a).(c) What is the mode of this distribution? Is itdifferent from the median? If the budgetcommittee is going to fund the school accordingto the average student credit hour load (moremoney for higher loads), which of these twoaverages do you think the college will use?The mode is 12. It is different from the median.Since the median is higher, the school will probablyuse it and indicate that the average being used is themedian.Median 15 15 152Note: For small ordered data sets, we can easily scan the set to find the location of the median. However, for large ordered data sets of size n, it is convenientto have a formula to find the middle of the data set.For an ordered data set of size n,Position of the middle value n 12For instance, if n 99, then the middle value is the (99 1)/2 or 50th data valuein the ordered data. If n 100, then (100 1)/2 50.5 tells us that the twomiddle values are in the 50th and 51st positions.
1020437 Ch03 p074-1217/13/074:55 AMPage 79Section 3.1MeanMost students will recognize thecomputation procedure for the mean as theprocess they follow to compute a simpleaverage of test grades.Measures of Central Tendency: Mode, Median, and Mean79An average that uses the exact value of each entry is the mean (sometimescalled the arithmetic mean). To compute the mean, we add the values of all theentries and then divide by the number of entries.Mean Sum of all entriesNumber of entriesThe mean is the average usually used to compute a test average.EX AM P LE 3MeanTo graduate, Linda needs at least a B in biology. She did not do very well on herfirst three tests; however, she did well on the last four. Here are her scores:586760849398100Compute the mean and determine if Linda’s grade will be a B (80 to 89 average)or a C (70 to 79 average).SOLUTION:Mean 58 67 60 84 93 98 100Sum of scores 7Number of scores560 807Since the average is 80, Linda will get the needed B.When we compute the mean, we sum the given data. There is aconvenient notation to indicate the sum. Let x represent any value in the dataset. Then the notationCOMMENT兺x (read “the sum of all given x values”)means that we are to sum all the data values. In other words, we are to sumall the entries in the distribution. The summation symbol 兺 means sum thefollowing and is capital sigma, the S of the Greek alphabet.Formula for the meanP ROCEDU R EThe symbol for the mean of a sample distribution of x values is denoted by x(read “x bar”). If your data comprise the entire population, we use the symbol m(lowercase Greek letter mu, pronounced “mew”) to represent the mean.HOW TO FIND THE MEAN1. Compute x; that is, find the sum of all the data values.2. Divide the total by the number of data values.Sample statistic x–Population parameter mx axnm axNwhere n number of data values in the sampleN number of data values in the population
1020437 Ch03 p074-121807/13/07Chapter 34:55 AMPage 80AVERAGES AND VARIATIONThis is a good time to review calculatorprocedures with students, with particularemphasis on order of operations.CALCULATOR NOTE It is very easy to compute the mean on any calculator:Simply add the data values and divide the total by the number of data.However, on calculators with a statistics mode, you place the calculator inthat mode, enter the data, and then press the key for the mean. The key isusually designated x. Because the formula for the population mean is the sameas that for the sample mean, the same key gives the value for m.We have seen three averages: the mode, the median, and the mean. For laterwork, the mean is the most important. A disadvantage of the mean, however, isthat it can be affected by exceptional values.A resistant measure is one that is not influenced by extremely high or low datavalues. The mean is not a resistant measure of center because we can make themean as large as we want by changing the size of only one data value. Themedian, on the other hand, is more resistant. However, a disadvantage ofthe median is that it is not sensitive to the specific size of a data value.A measure of center that is more resistant than the mean but still sensitive tospecific data values is the trimmed mean. A trimmed mean is the mean of the datavalues left after “trimming” a specified percentage of the smallest and largest datavalues from the data set. Usually a 5% trimmed mean is used. This implies thatwe trim the lowest 5% of the data as well as the highest 5% of the data. A similar procedure is used for a 10% trimmed mean.Resistant measureTrimmed meanHOW TO COMPUTE A 5% TRIMMED MEANP ROCEDU R E1. Order the data from smallest to largest.2. Delete the bottom 5% of the data and the top 5% of the data. Note: Ifthe calculation of 5% of the number of data values does not produce awhole number, round to the nearest integer.3. Compute the mean of the remaining 90% of the data.GUIDED EXERCISE 2Mean and trimmed meanBarron’s Profiles of American Colleges, 19th Edition, lists average class size for introductory lecture courses at each of the profiled institutions. A sample of 20 colleges and universities inCalifornia showed class sizes for introductory lecture courses to be1420202020232530303035353540404250508080(a) Compute the mean for the entire sample.Add all the values and divide by 20:x (b) Compute a 5% trimmed mean for the sample.兺x719 36.0n20The data are already ordered. Since 5% of 20 is 1,we eliminate one data value from the bottom of thelist and one from the top. These values are circled inthe data set. Then take the mean of the remaining18 entries.5% trimmed mean 兺x625 34.7n18Continued
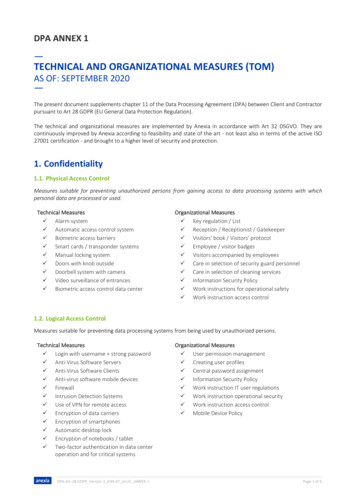
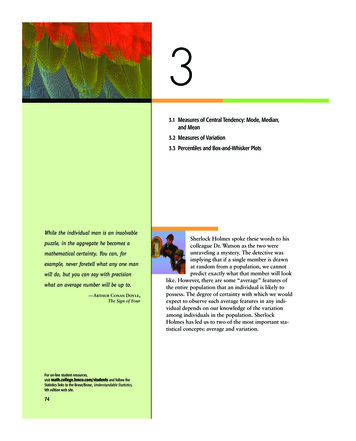
1020437 Ch03 p074-1217/13/074:55 AMPage 81Section 3.1GUIDED EXERCISE 2Measures of Central Tendency: Mode, Median, and Mean81continued(c) Find the median for the original data set.Note that the data are already ordered.Median 30 35 32.52(d) Find the median of the 5% trimmed data set.Does the median change when you trim thedata?The median is still 32.5. Notice that trimming thesame number of entries from both ends leaves themiddle position of the data set unchanged.(e) Is the trimmed mean or the original mean closerto the median?The trimmed mean is closer to the median.TE C H N OTE SMinitab, Excel, and TI-84Plus/TI-83Plus calculators all provide the mean and medianof a data set. Minitab and Excel also provide the mode. The TI-84Plus/TI-83Pluscalculators sort data, so you can easily scan the sorted data for the mode. Minitabprovides the 5% trimmed mean, as does Excel.All this technology is a wonderful aid for analyzing data. However, a measurement has no meaning if you do not know what it represents or how a change in datavalues might affect the measurement. The defining formulas and procedures forcomputing the measures tell you a great deal about the measures. Even if you use acalculator to evaluate all the statistical measures, pay attention to the informationthe formulas and procedures give you about the components or features of themeasurement.CR ITICALTH I N K I NGThe ideas at the right can be used to reviewlevels of measurement and link some ofthose concepts to the material in thissection.Data types and averagesDistribution shapes and averagesIn Chapter 1, we examined four levels of data: nominal, ordinal, interval, andratio. The mode (if it exists) can be used with all four levels, including nominal.For instance, the modal color of all passenger cars sold last year might be blue.The median may be used with data at the ordinal level or above. If we ranked thepassenger cars in order of customer satisfaction level, we could identify themedian satisfaction level. For the mean, our data need to be at the interval orratio level (although there are exceptions in which the mean of ordinal-level datais computed). We can certainly find the mean model year of used passenger carssold or the mean price of new passenger cars.Another issue of concern is that of taking the average of averages. For instance,if the values 520, 640, 730, 890, and 920 represent the mean monthly rentsfor five different apartment complexes, we can’t say that 740 (the mean of thefive numbers) is the mean monthly rent of all the apartments. We need to know thenumber of apartments in each complex before we can determine an average basedon the number of apartments renting at each designated amount.In general, when a data distribution is mound-shaped symmetrical, the values for the mean, median, and mode are the same or almost the same. Forskewed-left distributions, the mean is less than the median and the median is lessthan the mode. For skewed-right distributions, the mode is the smallest value,the median is the next largest, and the mean is the largest. Figure 3-1 shows thegeneral relationships among the mean, median, and mode for different types ofdistributions.
1020437 Ch03 p074-121827/13/07Chapter 34:55 AMPage 82AVERAGES AND VARIATIONFIGURE 3-1Distribution Types and Averages(a) Mound-shaped symmetric(b) Skewed left(c) Skewed rightMean ModeMedianMeanMedianModeMode MeanMedianWeighted AverageSometimes we wish to average numbers, but we want to assign more importance, or weight, to some of the numbers. For instance, suppose your professortells you that your grade will be based on a midterm and a final exam, each ofwhich is based on 100 possible points. However, the final exam will be worth60% of the grade and the midterm only 40%. How could you determine anaverage score that would reflect these different weights? The average you need isthe weighted average.Weighted averageWeighted averages have many real-worldapplications. This is a good time to mentionthat the sum of the weights may or maynot be 1, depending on the application.Weighted average 兺xw兺wwhere x is a data value and w is the weight assigned to that data value. Thesum is taken over all data values.EX AM P LE 4Weighted averageSuppose your midterm test score is 83 and your final exam score is 95. Usingweights of 40% for the midterm and 60% for the final exam, compute theweighted average of your scores. If the minimum average for an A is 90, will youearn an A?SOLUTION: By the formula, we multiply each score by its weight and add theresults together. Then we divide by the sum of all the weights. Converting thepercentages to decimal notation, we getWeighted average 8310.402 9510.6020.40 0.6033.2 57 90.21Your average is high enough to earn an A.TE C H N OTE SThe TI-84Plus/TI-83Plus calculators directly support weighted averages. Both Exceland Minitab can be programmed to provide the averages.TI-84Plus/TI-83Plus Enter the data into one list, such as L1, and the correspondingweights into another list, such as L2. Then press Stat Calc 1: 1-Var Stats. Enter thelist containing the data, followed by a comma and the list containing the weights.
1020437 Ch03 p074-1217/13/074:55 AMPage 83Section 3.1VI EWPOI NT83Measures of Central Tendency: Mode, Median, and MeanWhat’s Wrong with Pitching Today?One way to answer this question is to look at averages. Batting averages andaverage hits per game are shown for selected years from 1901 to 2000 (Source: The Wall Street 1A quick scan of the averages shows that batting averages and average hits per game are virtuallythe same as almost 100 years ago. It seems there is nothing wrong with today’s pitching! Sowhat’s changed? For one thing, the rules have changed! The strike zone is considerably smallerthan it once was, and the pitching mound is lower. Both give the hitter an advantage over thepitcher. Even so, pitchers don’t give up hits with any greater frequency than they did a centuryago (look at the averages). However, modern hits go much farther, which is something a pitchercan’t control.SECTION 3.1P ROB LEM S1. Statistical Literacy Consider the mode, median, and mean. Which average represents the middle value of a data distribution? Which average represents themost frequent value of a distribution? Which average takes all the specific valuesinto account?Tables and art to accompany marginanswers may be found in the back of thebook.2. Statistical Literacy What symbol is used for the arithmetic mean when it is asample statistic? What symbol is used when the arithmetic mean is a populationparameter?1. Median; mode; mean.2. Statistic, x; parameter, m.3. Mean, median, and mode areapproximately equal.4. (a) Mean, median, and mode if it exists.(b) Mode if it exists.(c) Mean, median, and mode if it exists.3. Critical Thinking When a distribution is mound-shaped symmetrical, what isthe general relationship among the values of the mean, median, and mode?5. (a) Mode 5; median 4;mean 3.8.(b) Mode.(c) Mean, median, and mode.(d) Mode, median.5. Critical Thinking Consider the numbers6. (a) Mode 2; median 3; mean 4.6.(b) Mode 7; median 8;mean 9.6.(c) Corresponding values are 5 more thanoriginal averages. In general, addingthe same constant c to each datavalue results in the mode, median,and mean increasing by c units.4. Critical Thinking Consider the following types of data that were obtained froma random sample of 49 credit card accounts. Identify all the averages (mean,median, or mode) that can be used to summarize the data.(a) Outstanding balance on each account(b) Name of credit card (e.g., MasterCard, Visa, American Express, etc.)(c) Dollar amount due on next payment2 3 4 5 5(a) Compute the mode, median, and mean.(b) If the numbers represented codes for the colors of T-shirts ordered from acatalog, which average(s) would make sense?(c) If the numbers represented one-way mileages for trails to different lakes,which average(s) would make sense?(d) Suppose the numbers represent survey responses from 1 to 5, with 1 disagree strongly, 2 disagree, 3 agree, 4 agree strongly, and 5 agreevery strongly. Which averages make sense?6. Critical Thinking: Data Transformation In this problem, we explore the effecton the mean, median, and mode of adding the same number to each data value.Consider the data set 2, 2, 3, 6, 10.(a) Compute the mode, median, and mean.(b) Add 5 to each of the data values. Compute the mode, median, and mean.(c) Compare the results of parts (a) and (b). In general, how do you think themode, median, and mean are affected when the same constant is added toeach data value in a set?
1020437 Ch03 p074-121847/13/07Chapter 34:55 AMPage 84AVERAGES AND VARIATION7.(a) Mode 2; median 3; mean 4.6.(b) Mode 10; median 15;mean 23.(c) Corresponding values are 5 timesthe original averages. In general,multiplying each data value by aconstant c results in the mode,median, and mean changing by afactor of c.(d) Mode 177.8 cm; median 172.72 cm; mean 180.34 cm.7. Critical Thinking: Data Transformation In this problem, we explore the effecton the mean, median, and mode of multiplying each data value by the samenumber. Consider the data set 2, 2, 3, 6, 10.(a) Compute the mode, median, and mean.(b) Multiply each data value by 5. Compute the mode, median, and mean.(c) Compare the results of parts (a) and (b). In general, how do you think themode, median, and mean are affected when each data value in a set is multiplied by the same constant?(d) Suppose you have information about average heights of a random sample ofairplane passengers. The mode is 70 inches, the median is 68 inches, and themean is 71 inches. To convert the data into centimeters, multiply each datavalue by 2.54. What are the values of the mode, median, and mean incentimeters?8. (a) Mean increases; median remainssame.(b) Mean decreases; median remainssame.(c) Both decrease.8. Critical Thinking Consider a data set of 15 distinct measurements with mean Aand median B.Problem 8 helps students understand howspecific data values enter into computationsof the mean, median, and mode.(a) If the highest number were increased, what would be the effect on themedian and mean? Explain.(b) If the highest number were decreased to a value still larger than B, whatwould be the effect on the median and mean?(c) If the highest number were decreased to a value smaller than B, what wouldbe the effect on the median and mean?9. Environmental Studies: Death Valley How hot does it get in Death Valley? Thefollowing data are taken from a study conducted by the National Park System,of which Death Valley is a unit. The ground temperatures (8F) were taken fromMay to November in the vicinity of Furnace Creek.9. Mean 167.3 F;median 171 F;mode 178 e the mean, median, and mode for these ground temperatures.10. x 6.2;memode 7.10. Ecology: Wolf Packs How large is a wolf pack? The following information isfrom a random sample of winter wolf packs in regions of Alaska, Minnesota,Michigan, Wisconsin, Canada, and Finland (Source: The Wolf, by L. D. Mech,University of Minnesota Press). Winter pack size:131075772432315442878Compute the mean, median, and mode for the size of winter wolf packs.11. (a) x 3.27;median 3;mode 3.(b) x 4.21;median 2;mode 1.(c) Lower Canyon mean is greater;median and mode are less.(d) Trimmed mean 3.75 and iscloser to Upper Canyon mean.11. Medical: Injuries The Grand Canyon and the Colorado River are beautiful,rugged, and sometimes dangerous. Thomas Myers is a physician at the parkclinic in Grand Canyon Village. Dr. Myers has recorded (for a 5-year period) thenumber of visitor injuries at different landing points for commercial boat tripsdown the Colorado River in both the Upper and Lower Grand Canyon (Source:Fateful Journey by Myers, Becker, Stevens).Upper Canyon: Number of Injuries per Landing Point Between North Canyonand Phantom Ranch23113469313Lower Canyon: Number of Injuries per Landing Point Between Bright Angeland Lava Falls8110672143011321(a) Compute the mean, median, and mode for injuries per landing point in theUpper Canyon.(b) Compute the mean, median, and mode for injuries per landing point in theLower Canyon.(c) Compare the results of parts (a) and (b).
1020437 Ch03 p074-1217/13/074:55 AMPage 85Section 3.185Measures of Central Tendency: Mode, Median, and Mean(d) The Lower Canyon stretch had some extreme data values. Compute a 5%trimmed mean for this region, and compare this result to the mean for theUpper Canyon computed in part (a).12. (a) x 26.3 yr; median 25.5 yr;mode 25 yr.(b) Median; answers are very close.12. Football: Age of Professional Players How old are professional football players? The 11th Edition of The Pro Football Encyclopedia gave the followinginformation. Random sample of pro football player ages in 312922282726232125212524222625322629(a) Compute the mean, median, and mode of the ages.(b) Compare the averages. Does one seem to represent the age of the pro football players most accurately? Explain.13. (a) x 136.15; median 66.50;mode 60.(b) Trimmed mean 121.28; yes.(c) Median, as well as low and highprice.13. Leisure: Maui Vacation How expensive is Maui? If you want a vacation rentalcondominium (up to four people), visit the Brase/Brase statistics site athttp://math.college.hmco.com/students, find the link to Maui, and then searchfor accommodations. The Maui News gave the following costs in dollars per dayfor a random sample of condominiums located throughout the island of 30(a) Compute the mean, median, and mode for the data.(b) Compute a 5% trimmed mean for the data, and compare it with the meancomputed in part (a). Does the trimmed mean more accurately reflect thegeneral level of the daily rental costs?(c) If you were a travel agent and a client asked about the daily cost of renting acondominium on Maui, what average would you use? Explain. Is there anyother information about the costs that you think might be useful, such as thespread of the costs?14. 87.65.14. Grades: Weighted Average In your biology class, your final grade is based onseveral things: a lab score, scores on two major tests, and your score on the finalexam. There are 100 points available for each score. However, the lab score isworth 25% of your total grade, each major test is worth 22.5%, and the finalexam is worth 30%. Compute the weighted average for the following scores: 92on the lab, 81 on the first major test, 93 on the second major test, and 85 on thefinal exam.15. 8.5.15. Merit Pay Scale: Weighted Average At General Hospital, nurses are given performance evaluations to determine eligibility for merit pay raises. The supervisorrates the nurses on a scale of 1 to 10 (10 being the highest rating) for severalactivities: promptness, record keeping, appearance, and bedside manner withpatients. Then an average is determined by giving a weight of 2 for promptness,3 for record keeping, 1 for appearance, and 4 for bedside manner with patients.What is the average rating for a nurse with ratings of 9 for promptness, 7 forrecord keeping, 6 for appearance, and 10 for bedside manner?16. (a) 67.1 mg/l.(b) No; the average chlorinecompound concentration (mg/l)seems a bit too high.16. EPA: Wetlands Where does all the water go? According to the EnvironmentalProtection Agency (EPA), in a typical wetland environment, 38% of the water isoutflow; 47% is seepage; 7% evaporates; and 8% remains as water volume in theecosystem (Reference: United States Environmental Protection Agency Case StudiesReport 832-R-93-005). Chlo
point of view, the love of learning is sufficient reason to get a college degree. However, the U.S. Census Bureau also makes another relevant point. Annually, college graduates (bachelor's degree) earn on average 23,291 more than high school graduates. This means college graduates earn about 83.4% more than