Transcription
MicrobialEcologyMonitoring Diel Variations of Physiological Status and BacterialDiversity in an Estuarine Microbial Mat: An IntegratedBiomarker AnalysisLaura Villanueva1, Antoni Navarrete1, Jordi Urmeneta1, Roland Geyer2,3, David C. White2and Ricardo Guerrero1(1) Department of Microbiology, University of Barcelona, Barcelona, Spain(2) Center for Biomarker Analysis, University of Tennessee, Knoxville, Tennessee, USA(3) Department of Environmental Microbiology, UFZ Centre for Environmental Research, Leipzig–Halle, GermanyReceived: 7 January 2007 / Accepted: 1 February 2007 / Online publication: 9 March 2007AbstractMicrobial mats are highly productive microbial systemsand a source of not-yet characterized microorganismsand metabolic strategies. In this article, we introduced alipid biomarker/microbial isolation approach to detectshort-term variations of microbial diversity, physiological and redox status, and also characterize lipid biomarkers from specific microbial groups that can befurther monitored. Phospholipid fractions (PLFA) wereexamined for plasmalogens, indicative of certain anaerobes.The glycolipid fraction was processed for polyhydroxyalkanoates (PHA) and the neutral lipid fraction was used toevaluate respiratory quinone content. Data demonstrate anincrease in the metabolic stress, unbalanced growth,proportion of anaerobic bacteria and respiratory rate afterthe maximal photosynthetic activity. Higher accumulationof polyhydroxyalkanoates at the same sampling point alsosuggested a situation of carbon storage by heterotrophsclosely related to photosynthetic microorganisms. Besides,the characterization of lipid biomarkers (plasmalogens,sphingolipids) from specific microbial groups providedclues about the dynamics and diversity of less-characterizedmat members. In this case, lipid analyses were complemented by the isolation and characterization of anaerobicspore formers and sulfate reducers to obtain insight intotheir affiliation and lipid composition. The results revealedthat temporal shifts in lipid biomarkers are indicative of anintense change in the physiology, redox condition, andPresent address of Laura Villanueva: Department of Microbiology,Morrill Science Center IV North University of Massachusetts, 639North Pleasant St., Amherst, MA 01003-9298, USACorrespondence to: Laura Villanueva; E-mail: laurava@microbio.umass.eduDOI: 10.1007/s00248-007-9224-3& Volume 54, 523–531 (2007) & *community composition along the diel cycle, and supportthe hypothesis that interactions between heterotrophs andprimary producers play an important role in the carbonflow in microbial mats.IntroductionMicrobial mats are stratified microbial systems characterized by cyclic seasonal fluctuations of flooding anddesiccation, and by diel fluctuations of temperature,light, pH, oxygen, sulfide, and nutrients. Phototrophicmats are dense communities composed by phototrophs(cyanobacteria, diatoms, purple and green (non)sulfurbacteria), anaerobic bacteria (sulfate-reducing bacteria,methanogens, fermenters) and aerobic bacteria (heterotrophs and chemolitoautotrophs). In this kind ofsystems, mat-building organisms respond to changes insteep vertical physicochemical gradients and orientatethemselves to find optimal conditions [6], which resultsin visible lamination of the resident microbial populations [10]. The community composition of microbialmats and the effects of environmental stress on theseecosystems remain active areas of research. In fact, one ofthe aims of microbial mat research is to determinewhether mats comprise a stable and predictable environment and to follow their metabolic and growth-relateddynamics under natural conditions. Studies carried outwith pure cultures isolated from natural ecosystems havecomplemented in situ analyses, but have not yieldedinsight into the diversity and interactions between microbial populations.In this study, we investigated the dynamics of anestuarine microbial mat (Ebro delta, Spain) during a dielcycle. We used a combined signature lipid biomarkerSpringer Science Business Media, LLC 2007523
524L. VILLANUEVA(SLB) analysis and microbial isolation to assess physiological status and redox conditions of the mat [41], andalso to get insight on less characterized microbialmembers. With this approach, the presence of certaingroups of microorganisms can be inferred by thedetection of unique lipids because specific phospholipidsfatty acids (PLFA) are prominent in microbial groups orsometimes certain genera. Other lipid classes serve asquantitative indicators of the physiological status of amicrobial community. One such class is bacterial poly-bhydroxyalkanoates (PHA), which accumulate underconditions of unbalanced growth. The analysis ofrespiratory quinone profile can be used to determinethe redox state of the microbial community, and providea reliable indicator of microbial biomass and communitycomposition [17, 19, 20].In this case, the analysis of plasmalogen-deriveddimethylacetals (DMA), and sphingoid bases has alsoprovided additional knowledge of community composition. The presence of plasmalogen-containing microorganisms (Clostridia, closer relatives, and severalsulfate-reducing bacteria) [31, 38] was shown to clearlycorrelate with the anoxic conditions of the mat system[36]. To further our understanding of microbial ecosystems, lipid analysis was complemented by the isolationand characterization of specific members of the community. In the present study, we characterized anaerobicspore formers and sulfate reducers (well known asimportant members of microbial mats), as little is knownabout their affiliation and lipid composition. Members ofthe genus Clostridium present in marine environmentshave been characterized [5, 26, 32, 39, 40]. However, thepresence and role of anaerobic spore formers in estuarinemicrobial mats have not been well-studied, althoughtheir saccharolytic and proteolytic activities suggestinvolvement in fermentation processes and in therecycling of organic compounds in anoxic zones [23,35]. In connection with SLB analysis, previous studiesindicated the presence of menaquinones in certain speciesof the genus Clostridium. The relevance of this finding isthat fermentative bacteria classically do not requirequinones because they do not translocate electrons acrossthe cell membranes to gain energy [12, 46].Apart from that, the dynamics of PHA turnover hasbeen evaluated as a physiological strategy to overcomeenvironmental changes, and also to increase our knowledge about microbial mats as a source of new PHAproducer and degrader species with potential biotechnological applications [3].Although the SLB approach has been previously usedto examine the community composition and metabolicstate of microbial mat samples [33, 34, 42], those studiesfocused on the polar lipid fraction. In this article, we combined expanded SLB approaches to include neutral andglycolipid fractions, and thus gain insight deeper intoET AL.:PHYSIOLOGICAL STATUSOFMICROBIAL MATS OVERADIEL CYCLEmicrobial community dynamics. This was done by: (1)monitoring microbial biomass under starvation, stress,and different redox conditions; (2) characterizing themicrobial community composition based on PLFAs,quinone content, and other specific lipids biomarkers;and (3) isolating representative strains of sulfate-reducingbacteria and anaerobic Gram-positive bacteria from matsand determining the presence of lipid biomarkers in theirbacterial membranes.Materials and MethodsSampling and lipid extraction.Samples were obtainedfrom microbial mats located in the Ebro delta, on thenortheastern coast of Spain (40-47¶N, 0-56¶E; for a moredetailed description, see [16, 30]). Samples were collectedin the fall of 2002 (October), over a day/night cycle. Theupper part of the mat was sampled every 3 h starting atmidday (12:00, 15:00, 18:00, 21:00, 24:00, 3:00, 6:00, 9:00,and 12:00 h of the following day, GMT 01:00), using a1.5-cm inner-diameter corer. Conductivity and sulfideconcentration of the overlaying water and the amount ofsolar irradiation were analyzed at each sampling time, asdescribed by Navarrete et al. [33]. Samples were extractedaccording to the method of Bligh and Dyer [4], asmodified by White et al. [43]. Total lipid extracts werefractionated into neutral, glycolipids, and polar lipids bysilicic acid chromatography [14].Lipid analysis.The polar lipid fraction was transesterified to fatty acid methyl esters (FAME) by mildalkaline methanolysis to protect cyclopropane PLFA, followed by mild acid methanolysis to release plasmalogenethers as DMA, according to the sequential method ofMayberry and Lane [28]. FAME and DMA were detectedand quantified as described by Peacock et al. [36]. The remaining phase obtained from mild acid methanolysis of theDMAs was hydrolyzed under strong acid conditions, afterwhich the organic phase was treated by methanolysis andderivatized with N,O-bis(trimethylsilyl)trifluoroacetamide(BSTFA) to detect amide-linked hydroxyl fatty acids andsphingoid bases from sphingolipids [27, 29]. Polyhydroxyalkanoates (PHB, polyhydroxybutyric acid; PHV, polyhydroxyvaleric acid) contained in the glycolipid fraction werehydrolyzed and derivatized with de (MBSTFA) following the protocol described by Elhottová et al. [9]. The spectra of theMBSTFA-derivatized b-hydroxyvalerate monomers wereobtained by analyzing the glycolipid fraction of Cupriavidusnecator cultures grown on sodium valerate as carbon source[8]. The neutral lipid fraction was examined for respiratoryubiquinone (Q), menaquinones (MK), and demethylmenaquinone (DMK) isoprenologues (-n) by liquid chromatography tandem mass spectrometry (LC-MS/MS), asdescribed by Geyer et al. [11]. The microbial divergence
L. VILLANUEVAET AL.:PHYSIOLOGICAL STATUSOFMICROBIAL MATS OVERA525DIEL CYCLEindex of ubiquinones and menaquinones (MD ub mk)and the bioenergetic divergence index (BD ub mk) werecalculated according to a previously published method[19, 21].Statistical analysis.Analysis of variance (ANOVA)and standard deviation were used to determine differencesamong lipid biomarker data in sample replicates (2sampling events 4 replicate mat cores). ANOVAs wereperformed with Statgraphics Plus 5.1 for Windows(StatPoint, Inc., Virginia).Screening and characterization of sulfate-reducingand anaerobic Gram-positive bacteria.Sulfatereducing and anaerobic spore-forming bacteria present inmat samples were screened by manipulation under anoxicconditions and culture on SRB agar plates (sulfate-reducingbacteria [SRB] agar,Scharlau Microbiolgy, Spain; amendedwith 15 g NaCl L 1], or after heat shock (80-C, 10 min) andculture on SPS agar (ScharlauMicrobiology, Spain,amended with 15 g NaCl L 1). The isolated strains werecharacterized by scanning and transmission electronmicroscopy and by 16S rRNA sequencing [2]. Total lipidswere extracted from lyophilized cultures and the polar andneutral lipid fractions were analyzed for FAME, DMA, andquinone composition as described above.ResultsTo reveal temporal changes in the microbial community ofa complex estuarine mat, biomarkers were assessed formicrobial biomass, physiological status, and general community composition during a diel cycle (24 h). Mat samplesand physicochemical data were obtained every 3 h startingat noon of a normal sunny day in fall.Physicochemical conditions.Starting at noon, thelight intensity at the sampling site decreased, reaching aminimum value between 21:00 and 6:00 h. Conductivityvalues were relatively stable (25,000–27,500 mS cm 1) withslight fluctuations during the day/night cycle. Sulfidemeasured in the overlying water reached its maximumvalue at 6:00 h (18 mM) and was below the limit ofdetection of the applied method during the rest of the day.Microbial biomass and community compositionMicrobial biomass, as measured by polar lipid fatty acids(PLFA; Table 1), ranged from 7.7 103 to 2.7 104 pmolPLFA per gram of dry weight. The minimum value oftotal PLFA occurred at 18:00 h and the maximum valueat 15:00 h. From 21:00 h to 9:00 h of the following day,PLFA values varied slightly (ca. 7%). DMA derived fromplasmalogens, indicating rather anaerobically microorganisms, were higher at 18:00 h and showed the sametrend as the PLFA biomass profile except for a time lagbetween the maximum peaks of each (Table 1). Inaddition, total quinones, measured as picomole per gram(pmol g 1), reached a minimum at 3:00 h and a maximum at 15:00 h (Table 3).Table 2 shows diel changes of the communitycomposition based on PLFA analysis. The communityconsisted mainly of Gram-negative bacteria (b-and gProteobacteria, Firmicutes, and Bacteroides groups) at12:00 h and 15:00 h, as indicated by the presence of ahigh percentage of monoenoic PLFA [45]. Minimumvalues of PLFA species, indicative of Gram-negative bac-Table 1. Physiological and redox state measurements in mat 8111Indicescyclo/w7ctrans/cisUQ/MK DMKBD ub mkQ/PLFAMD ub mkPHB/PLFAPHV/PLFA2Values1PLFA pmol g 1DMA pmol g 1PHB nmol g 1PHV nmol g111cyclo/w7c and trans/cis ratios, PHB/PLFA polyhydroxybutyrate/phospholipid fatty acids in pmol g , PHV/PLFA polyhydroxyvalerate/PLFA in pmol g ,UQ/MK DMKs 1ubiquinone to menaquinone ratio calculated with percent mole data, BD ub mk bioenergetic divergence index, Q/PLFA total quinones/PLFAin pmol g .2PLFA phospholipid fatty acids; DMA dimethylacetals; PHB polyhydroxybutyrate; PHV polyhydroxyvalerate. Decimal position avoided. Standarddeviation for PLFA, DMA, and PHA (polyhydroxyalkanoates) between replicates was less than 10%. ANOVA determined among lipid biomarker databetween mat core replicates gave p values around 1 (significantly similar).*The polar lipid fraction of the 12:00B sampling time was lost during the analyses; thus, only the quinone and PHA results of this sample were included inthe study.
526L. VILLANUEVAET AL.:PHYSIOLOGICAL STATUSMICROBIAL MATS OVEROFADIEL CYCLETable 2. Community composition by PLFA analysis (% mol)PLFA biomarkers1Nsat (All genera)BrMon-MBrSat (Anaerobes)TBrSat (Gram positives)Monoenoics (Gram-negatives)Polyenoics n between samples T10% (data obtained from n 4 replicates of microbial mat sample cores).1NSat Normal saturates; BrMon-MBrSat Branched monoenoics and Medium-branched saturates; TBrSat Terminal branched saturates.teria, were found at 18:00 h. From 12:00 to 15:00 h,terminally branched saturated fatty acids, typical ofGram-positive bacteria, increased slightly whereas lipidsrepresentative of anaerobic microorganisms (branchedmonounsaturated and mid-chain branched saturatedfatty acids) decreased. At 18:00 h, there was an inversionin the profile dominated by Gram-negative bacteria suchthat PLFA typical of anaerobic bacteria were higher atthis sampling time. At all sampling times, the abundanceof lipids representative of microeukaryotes (polyenoicPLFAs) and Gram-positive bacteria (terminally branchedsaturated PLFA) remained stable.As confirmed in previous studies [7, 19], quinoneisoprenologues act as suitable biomarkers for the classification of microorganisms. Quinone composition andchanges in the quinone profile during the day/night cycleare summarized in Table 3. Among the ubiquinones, Q-10predominated at 12:00, 15:00, and 21:00 h, whereas Q8 was the major ubiquinone at all other sampling times.Furthermore, Q-9 was also an important ubiquinone andits levels (measured as percent mole [%mol], picomoles ofcertain quinone homolog in a sample divided by thepicomole sum of all measured quinones set to 100%; datanot shown) remained relatively constant at all samplingtimes. Based on chemotaxonomic studies, b-Proteobacteria,g-Proteobacteria, and a-Proteobacteria were consideredas possible major sources of Q-8, Q-9, and Q-10,respectively. Likewise, menaquinone-9 (MK-9), commonin members of the Firmicutes, Actinobacteria, andBacteroides groups, as well as Rhodospirillaceae, was themost abundant (percent mole) among all the quinones.The relative percentages of MK-7, MK-8, and MK-10were also high in all samples. These menaquinones havebeen detected in Actinobacteria, Cytophaga-Flavobacteria,d-Proteobacteria, Firmicutes, and Euryarchaeota (MK-7and MK-8), and in green nonsulfur bacteria (MK-10). Bycontrast, levels of MK-4, MK-5, and DMK were relativelylow in all sampling points. Q-8, Q-9, and Q-10 significantlydecreased during the night and then progressively increasedagain at the beginning of the following day. A similar trendwas observed for MK-6, which is found in CytophagaFlavobacterium, d-Proteobacteria, and (-Proteobacteria.The levels of this menaquinone were higher from 12:00to 18:00 h and decreased during the night. Relative MK-7levels were highest at 15:00 h. In general, at 18:00 h, theamount of all ubiquinones decreased, except Q-8, whichslightly increased. Furthermore, the amounts of quinonesrelated to photosynthetic bacteria (plastoquinone-9 andTable 3. Quinone content as picomoles per gram of dry weight in mat 10DMK-8K1 67111,2011,566362,42634,5191Ubiquinones, menaquinones, demethylmenaquinones, and plastoquinones with n isoprene units in their side chain were abbreviated as Q-n, MK-n, DMK-n,and PQ-n, respectively. Phylloquinone was abbreviated as K1. Reproducibility of quinone analysis was within T5% (data obtained from n 4 replicates ofmicrobialmat sample cores).112:00B 12:00 A.M. sampling point of the following day2TQ Total quinones
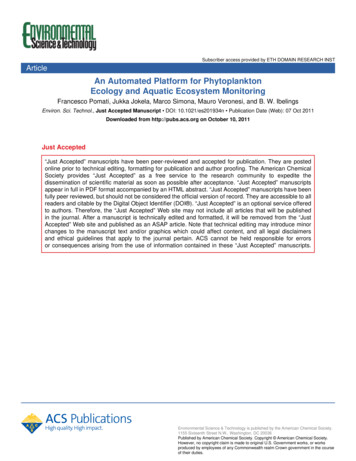
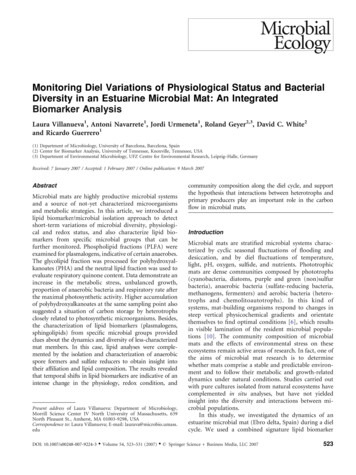
L. VILLANUEVAET AL.:PHYSIOLOGICAL STATUSOFMICROBIAL MATS OVERA527DIEL CYCLEFigure 1. Micrographs of the isolatedClostridium sp. EBD (Ebro Delta) (a)and Desulfovibrio sp. EBD (Ebro delta)(b). (a) Scanning transmission micrograph showing the central spore andthe distended cell wall; (b) Transmission electron micrograph showingcross-sectioned cells of the Desulfovibriostrain.phylloquinone) remained similar at all sampling timesand represented a considerable amount of the totalquinone content (ca. 5–10%).In addition to phospholipid fatty acids and respiratory quinones, other lipid classes can be used asbiomarkers to estimate the community composition ofenvironmental samples. In this study, a sequentialprotocol was applied to also detect and quantifysphingoid bases and amide-linked hydroxyl fatty acidsderived from sphingolipids. The most abundant sphingoid bases were C18:0 (dihydrosphingosine), C19:0, andC21:1. Furthermore, 3-hydroxy 16:0 (3-OH 16:0), 3-OH17:0, and 3-OH 18:0 were present in mat samples.The1lowest values occurred at 18:00 h (2–3.7 pmolg)andthe higher ones at 9:00 h (70.9–75.4 pmol g 1).Screening for sulfate-reducing bacteria and anaerobicspore-forming bacteria in microbial mat samples led tothe isolation of one strain representative of each group(Fig. 1). Pure cultures were sequentially isolated and their16S rRNA was sequenced. The similarities of the 16SrRNA from the isolated strains and their quinone andcellular fatty acid compositions are shown in Table 4.The phenotypic and molecular properties of the isolatedstrains were consistent with their classification asmembers of the Desulfovibrio sp. and Clostridium sp.genera, respectively. Thus, the strains were tentativelynamed Desulfovibrio sp. EBD (Ebro delta) and Clostridiumsp. EBD (Ebro delta). Analysis of the quinone content(Table 4) indicated a predominance of MK-6 (abundantin d-Proteobacteria) and also an important contributionof MK-5 in Desulfovibrio sp. EBD. Although MK-9 wasdetected in Clostridium sp. EBD, its abundance was 400fold less than that of MK-6, the main quinone inDesulfovibrio sp. EBD. Dimethylacetals derived fromplasmalogens were observed only in Clostridium sp. EBDand the detected DMA contained 16 carbons (Fig. 2).Physiological and respiratory status.As shownin Table 1, the growth rate (high cyclo/w7c FA ratio)decreased at 18:00 and 3:00 h and there was a shift to ahigher level of metabolic stress (high trans/cis FA ratio,[18]). The cyclo/w7c ratio indicated exponential tostationary growth of the mat bacteria at each samplingtime. The highest levels of metabolic stress occurred at18:00 and 3:00 h, as reflected by the cyclo/w7c ratioprofiles. In addition, PHA quantification demonstratedthat PHV values were higher than PHB at all samplingtimes. Likewise, the ratio PHB/PLFA during the day/nightcycle reflected changes in the PHB levels depending on thetime of day. The PHV/PLFA ratio was higher than thePHB/PLFA ratio; the maximum value was measured at18:00 h and the minimum at 15:00 h (Table 1). Moreover,the ubiquinone/menaquinone (UQ/MK) ratio was similarin all samples; however, the highest ratio occurred at18:00 h, which could be attributed to the more aerobiccharacter of the microbial community at that time. TheUQ/MK ratio near zero indicates long-term exposure tostrictly anaerobic conditions. Values below 1 indicateTable 4. Similarity of 16S rRNA of the isolated strains, main fatty acids, and quinones detectedStrainSimilarity (%)Closest relativeMain fatty acidsClostridium sp.1EBD(DQ218319)99Clostridium bifermentans(AF320283)Desulfovibrio sp. 1EBD(DQ218320)98Desulfovibrio acrylicus(U32578)14:0, a15:0, i16:0, 16:1w9c, 16:1w7c,16:0, i17:0, a17:0, cy17:0, 17:0,18:1w9c, 18:1w7c, 18:0, cy19:0cy17:0, 17:0, 18:1br, Me18:012Accession number of the 16S rRNA sequencesIn parentheses, quantification of the main quinone as picomoles per gram of dry weightMain quinone2MK-9 (272)5MK-6(1.06 10 )
528L. VILLANUEVAET AL.:PHYSIOLOGICAL STATUSOFMICROBIAL MATS OVERADIEL CYCLE(x100,000)1.00TIC75.00 (1.00)0.750.500.250.0034.00%34.2534.5075509743 57 7183168050100150196200222255250413307 326300anaerobic conditions with a past history of oxygenavailability [11], whereas values around 1 and aboveindicate an aerobic or microaerophilic environment.UQ/MK is considered to be proportional to the ratio ofanaerobic to aerobic respiration [36]. Besides, the ratio oftotal quinones to PLFA (Q/PLFA) is proportional to theratio of respiration/(respiration fermentation). The ratioof total quinones to PLFA (Q/PLFA) indicated a high level ofrespiratory activity and a less anaerobic character (UQ/MK)of the 12:00, 18:00, and 21:00 h-samples. Microbialdivergence indices (Table 1) were similar in all samples,but maximum divergence was detected at 18:00 h.DiscussionThese results give clues about the repeatability of the day/night trends in Ebro delta microbial mats according tothe PLFA and quinone data observed. However, futurestudies of the daily dynamics in microbial mats overconsecutive days and seasons should be performed toconclude this hypothesis. In this study, physiologicalstatus and community composition remained stable withthe exception of the 18:00 h sampling point. At this time,an increase of the starvation index was detected, whichcoincided with an increase in the metabolic stress, anincreased recovery of dimethylacetals, a higher respiration activity, a more aerobic character, and a lowerproportion of viable cell numbers as total PLFA.Moreover, the reduction in the total PLFA content inthis sampling point was selective, which can be attributedto differences in PLFA structure, resulting in a higher350400Figure 2. Detection of dimethylacetals(DMAs) in Clostridium sp. EBD(Ebro Delta). Chromatogram andmass spectra of 16DMA (dimethylacetalwith 16 carbons) with the base peak atm/z 75. The top part refers to thechromatographic separation and then,the corresponding mass spectrum of thepeak is shown.proportion of PLFA representative of anaerobic bacteria.The changes observed at this sampling point can beexplained by high oxygenic and anoxygenic photosynthetic activities during the day that provide photosynthates and osmotic solutes to the heterotrophicpopulations of the mat [13, 22]. Moreover, higher valuesof PHA at this time also suggested a situation of carbonstorage and an unbalanced growth. These data are notconsistent with previous studies performed in microbialmats [37]. In fact, several of our observations suggestthat PHA accumulation is the result of phototrophicactivity because PHA levels rise and fall with the organiccarbon supplements in the light/dark cycle, suggestingthat aerobic or facultative heterotrophic microorganismsaccumulate PHA from the excess carbon that is generated and excreted by photosynthetic microorganisms.This fact suggests a situation of excess of assimilated carbon products and changes in the carbon/nitrogen ratio,which leads to unbalanced growth during late daytime.Moreover, the higher quinone-to-PLFA (Q/PLFA) ratiorevealed a higher respiratory activity in comparison withfermentation processes, and also higher presence ofaerobic or facultative heterotrophs.The important reduction in PLFA content and theincrease in cyclopropyl and trans-monoenoic fatty acidsclearly correlated with nutrient deprivation. However, theloss of PLFA does not necessarily involve cell death, butmay instead reflect a decrease in cell volume andpreferential utilization of the cis-monoenoic fatty acids asa survival mechanism for the maintenance of membraneintegrity during starvation [15]. Nonetheless, futurestudies should take into account that a dramatic reduction
L. VILLANUEVAET AL.:PHYSIOLOGICAL STATUSOFMICROBIAL MATS OVERA529DIEL CYCLEof the PLFA content over a short time period could becaused by an important turnover of phospholipids inmicrobial mats. These results also indicate that an analysisin which only polar lipid fatty acids are measured may underestimate viable biomass because vinyl-ether-containingphospholipids may comprise a significant proportion ofthe total phospholipids in microbial mats. The higherDMA content was most likely associated with an increasein the abundance and activity of plasmalogen-forminganaerobes.As part of this study, we isolated Clostridium sp.Ebro delta (EBD). To our knowledge, this is one of thefirst isolations of Clostridium species in estuarine microbial mats. Several strict anaerobes of the Clostridia classgenerate fermentation products that are used by sulfatereducing bacteria, methanogens, and other fermentativebacteria in microbial mat systems [1, 35]. Thus, furtherstudies should focus on the importance of anaerobicspore formers in mat decomposition and carbon flowand potential syntrophic associations with other sporeforming members. Our results emphasize the importanceof the presence of spore formers in mats and their abilityto persist as dormant cells when environmental conditions become unfavorable [25]. Significant amounts ofDMA were observed in the cell membranes of Clostridiumsp. EBD. Members of this genus and its closer relativesmay have been responsible for the increase in DMAcontent and the lack of a corresponding increase inquinone homologues, as their fermenting activity do notrequire quinones. Although respiratory quinones weredetected in Clostridium sp. EBD, the main quinone,menaquinone-9 (MK-9), was present in very lowamounts. Menaquinone in Clostridia was unexpectedbut found before by other authors [12]. The dramaticdecrease in MK-9 content during the diel cycle may havebeen associated with a temporary decrease in theproportion of members of the Firmicutes, Actinobacteria,and Bacteroides groups. It is surprising to note that theincrease in the DMA content at 18:00 h did notcorrespond to a significant increase in any of the quinonehomologues characteristic of plasmalogen-containinggenera commonly detected in estuarine microbial mats.Thus, common sulfate-reducing bacteria (d-Proteobacteria)have menaquinone-6 and 7 as predominant isoprenologuesin their respiratory chains, but the content of these compounds did not increase at that sampling time. Menaquinone-9 is also found in other Firmicutes groups and inRhodospirillaceae; thus, the possibility that other microorganisms in the samples reduced their menaquinonecontent cannot be ruled out. In addition, this menaquinone is found in members of the Bacteroides genus, whichharbor a high proportion of sphingolipids in theirmembranes [24]. The presented data revealed a decreaseof hydroxyl fatty acids amide-linked to sphingolipids beforesunset, suggesting a decrease in the proportion of membersof the Bacteroides genus and reduction of part of themenaquinone-9 pool.In general, there was good correspondence of theincrease in unbalanced growth and higher metabolicstress with the decrease in total PLFA. A comparisonbetween the presented data and the data summarized inNavarrete et al. [33] reveals a similar tendency in microbial mat activities following the maximum photosyntheticactivity (maximum stress and minimum phospholipidcontent) and also during the night period (recovery ofPLFA content and balanced growth). However, differencesin data at the beginning of the day remain unclear andmight be attributed to changes between seasons relatedwith temperature, salinity, and irradiance [44]. T
storage and an unbalanced growth. These data are not consistent with previous studies performed in microbial mats [37]. In fact, several of our observations suggest that PHA accumulation is the result of phototrophic activity because PHA levels rise and fall with the organic carbon supplements in the light/dark cycle, suggesting