Transcription
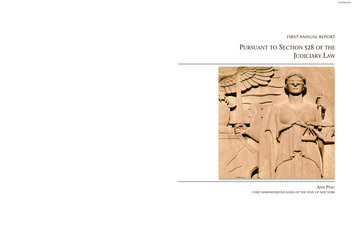
ContentsFIRST ANNUAL REPORTPURSUANT TO SECTION 528 OF THEJUDICIARY LAWANN PFAUCHIEF ADMINISTRATIVE JUDGE OF THE STATE OF NEW YORK
THE CHIEF ADMINISTRATIVE JUDGE OF THE STATE OF NEW YORKFIRST ANNUAL REPORT PURSUANTOF THE J UDICIARY L AWINTRODUCTIONI.TOSECTION 528. . . . . . . . . . . . . . . . . . . . . . . . . . . . . . . . . . . . . . . 3BACKGROUND . . . . . . . . . . . . . . . . . . . . . . . . . . . . . . . . . . . . . 3A. New York’s Juror Qualification and Summoning ProceduresB. Section 528 Juror Demographics Data Collection ProceduresII. OVERVIEW OF DATARACE . . . . . . . . . . . . . . . . . . . 7. . . . . . . . . . . . . . . . . . . . . . . . . . . . . . . . . . . . . . . . 7. . . . . . . . . . . . . . . . . . . . . . . . . . . . . . . . . . . . . . . . . . 8HISPANIC, LATINO OR SPANISH ORIGINAGE. . . . . . . 4. . . . . . . . . . . . . . . . . . . . . . . . . . . . . . . . . . 6III. JURY DEMOGRAPHICS AND CENSUS DATA .GENDER . . . . . . . . 3. . . . . . . . . . . . . . . . . . . . . 8. . . . . . . . . . . . . . . . . . . . . . . . . . . . . . . . . . . . . . . . . . . 9ENGLISH LANGUAGE PROFICIENCYIV. DISCUSSION. . . . . . . . . . . . . . . . . . . . . . . 10. . . . . . . . . . . . . . . . . . . . . . . . . . . . . . . . . . . . . . 11APPENDIX: County by County Data Tables . . . . . . . . . . . . . . . . . . . . . . 13TABLE A: Jurors Served and Cards Completed by CountyTABLE B: Gender by County. . . . . . . . . . . . . . . . . . . . . . . . . . . . 15TABLE C: Hispanic Origin of Any Race by County .TABLE D: Race by County . . . . . . . . . . . 14. . . . . . . . . . . . . . . 16. . . . . . . . . . . . . . . . . . . . . . . . . . . . . 17TABLE E: Age Groups for Available Counties. . . . . . . . . . . . . . . . . . 19* Errata corrected on pages 5 and 14 on December 9, 2011.
Contents1 ST ANNUAL REPORT PURSUANT TO SECTION 528 OF THE JUDICIARY LAW3INTRODUCTIONSECTION 528 OF THE JUDICIARY LAW DIRECTS EACH COMMISSIONER OF JURORS to collect information about therace, ethnicity, age and sex of persons “who present for jury service.” The statute also requires theChief Administrative Judge to submit an annual report on this demographic data to the Governor,Speaker of the Assembly, President of the Senate, and the Chief Judge of the State of New York. Thisis the first annual report.I. BACKGROUNDA. NEW YORK’S JUROR QUALIFICATION AND SUMMONING PROCEDURESNew York has a two-step jury system: first, jurors must be qualified to serve; once qualified,they become eligible to serve and may be summoned for service. Jury personnel are responsible forassuring that source lists used for finding prospective jurors are representative and that proceduresfor qualifying and summoning jurors are unbiased. Individuals are selected at random to receivequestionnaires or summonses.1 Courtroom dynamics, including decisions and actions of counsel,the parties, the judge, and the jurors themselves all affect the ultimate composition of individualjuries.New York is a recognized leader in implementing procedures designed to increasing jury participation.2 New York meets or exceeds every standard that has been recommended for maximizingjury representativeness by such institutions as the American Bar Association and the National Centerfor State Courts:3USE OF MULTIPLE SOURCE LISTS New York uses five source lists to compile thepool of prospective jurors.4REGULAR UPDATING OF JUROR LIST New York obtains new source listsfrequently and the pool of qualified jurors is updated continuously.5REGULAR CHANGE OF ADDRESS UPDATING Every 90 days, New York uses theUS Postal Service National Change of Address (NCOA) technology to assure theaccuracy of addresses.1Judiciary Law §507 requires random selection of names of prospective jurors.2Testimony of Professor Valerie Hans, Public Hearing on Jury Diversity held by the Assembly Standing Committees on Judiciary and Codes in New York City, April 30, 2009.3See generally, ABA PRINCIPLES FOR JURIES AND JURY TRIALS (July 2005), Paula Hannaford-Agor, SYSTEMATIC NEGLIGENCE IN JURY OPERATIONS: WHY THE DEFINITION OF SYSTEMATIC EXCLUSION IN FAIRCROSS SECTION CLAIMS MUST BE EXPANDED, 59 DRAKE LAW REVIEW 761 (2011), Munsterman, G. Thomas,et al., JURY TRIAL INNOVATIONS. 2d edition (2006).4The source lists used in New York are the lists of registered voters, holders of New York State driver’s licenses orDMV-issued identification cards, tax filers, unemployment insurance recipients, and recipients of family assistance or home relief.5Commissioners of Jurors send over five million juror qualification questionnaires each year.
Contents4THE CHIEF ADMINISTRATIVE JUDGE OF THE STATE OF NEW YORKMULTIPLE FOLLOW-UP NOTICES At least two follow-up mailings are sent toquestionnaire non-responders, depending on county.ELIMINATION OF EXEMPTIONS At the request of the court system, all statutoryexemptions from jury service were eliminated in 1996.6SHORT TERMS OF SERVICE The term of service is one day or one trial in 60 outof 62 counties, with an average term of service of 1.9 days.7HIGH JUROR COMPENSATION New York’s jury fee of 40 per day is higher thanany other state except New Mexico, which pays 41.20 per day.8In addition, New York encourages juror participation through a variety of measures, includingjuror-friendly tools such as completing qualification questionnaires and requesting postponementonline or by telephone.B. SECTION 528 JUROR DEMOGRAPHICS DATA COLLECTION PROCEDURESBeginning on September 13, 2010 (the effective date of section 528), each person who appearedfor jury service at any county or city courthouse in the state has been asked to complete a scannabledata collection card.9 The card states that New York State Judiciary Law §528 requires the court tocollect data about jurors. Each juror is asked to:fill in the dateindicate genderindicate whether she or he was summoned to serve as a trial juror or a grandjuroranswer questions about race, Hispanic origin, and year of birth, andindicate county of serviceThe questions about Hispanic origin and race are the same as those used in the 2010 census.106L. 1995, c. 867New York and Bronx Counties call jurors for two days or one trial.8Several states (including Connecticut, Massachusetts, North Dakota and South Dakota) pay 50 per day beginning on the 2nd, 4th , or 6th day of service. Hon. Gregory E. Mize, Paula Hannaford-Agor, and Nicole L. Waters,THE STATE-OF-THE-STATES SURVEY OF JURY IMPROVEMENT EFFORTS: A COMPENDIUM REPORT, April2007 at 12. Available at www.nsconline.org/D Research/cjs/pdf/SOSCompendiumFinal.pdf.9Section 528 applies to “jurors who present for jury service,” and therefore data is not collected for people whowere temporarily excused or postponed their service, or those who failed to respond to questionnaires or summonses. Temporary excusals are granted by commissioners contingent upon receiving adequate documentation. Excusal categories include: caregiver (up to 5 years); medical; inconvenience or hardship due to financialor transportation issues, inconvenience or hardship to the public (granted to military stationed away fromhome county and others whose service would jeopardize public health, welfare or safety).10 The census directed respondents to answer both the Hispanic origin question and the race question, notingthat: “For this census, Hispanic origins are not races.” This instruction was inadvertently omitted from thequestionnaire used during the first year of data collection; it has been added to the questionnaire for the second year beginning in September 2011. The fact that 6% of juror information card responders identified as Hispanic, Latino or Spanish origin and also did not respond to the race question may be explained by thisinadvertent omission.
51 ST ANNUAL REPORT PURSUANT TO SECTION 528 OF THE JUDICIARY LAWThe question about Hispanic origin asks if the juror is of Hispanic, Latino or Spanish origin and allows for three specific affirmative responses (Mexican, Puerto Rican, or Cuban) and other Hispanicorigins. The next question asks “What is your race?” and instructs the juror to “fill in one or morecircles” providing 15 choices and permits the juror to write in other responses. Finally, the juror isasked “In what year were you born?” and to indicate the county of jury service.A total of 464,158 cards were completed and successfully scanned. As of October 10, 2011, thestatewide automated Jury Management System reported that 485,227 jurors had served between September 13, 2010 and September 9, 2011. Juror type (trial or grand) was missing from 438 cards. Thesecards were removed from the analysis. Thus, the final data compilation is based on 463,720 completed juror information cards collected and scanned between September 13, 2010 and September 9,2011. As can be seen in the table below, approximately 97% of trial jurors and 80% of grand jurorscompleted scanned cards. The lower participation rate of grand jurors probably results from the factthat grand juries are often empanelled in locations away from the direct control of commissionersof jurors.table 1Compare Number of Jurors Who Appeared in Court to Completed CardsNEW YORK STATE JURORS: SEPTEMBER 13, 2010 — SEPTEMBER 9, 2011TRIAL JURORSGRAND JURORSAppeared in Court455,16930,058Completed Scanned Cards139,57324,14797%80%% who completed cardsAppendix TABLE A on page 14 contains a county-by-county distribution of jurors served andjuror cards submittedErrata on TABLE 1 and on TABLE A (page 14) were corrected on December 9, 2011. Jurors servedduring the relevant time period originally reported as 491,382 has been reduced to 485,227. There wereno changes to jury card data.
Contents6THE CHIEF ADMINISTRATIVE JUDGE OF THE STATE OF NEW YORKII. OVERVIEW OF DATATHE TABLES BELOW SUMMARIZE THEdue to non-responses.table 2table 3table 4table 5RESPONSESfor each demographic question. Totals do not add to 100%
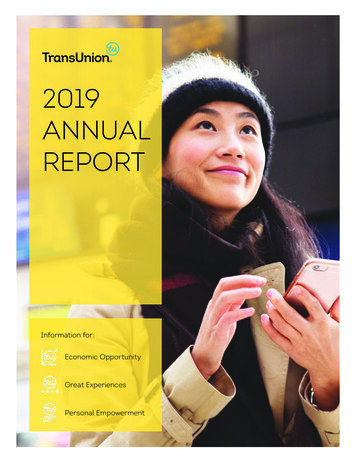
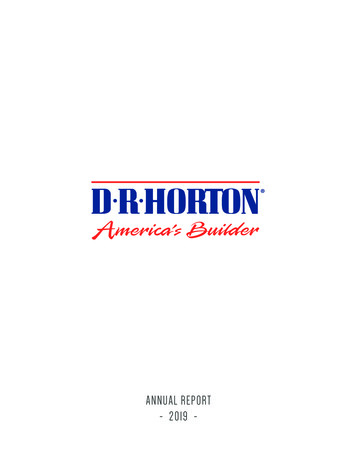
Contents1 ST ANNUAL REPORT PURSUANT TO SECTION 528 OF THE JUDICIARY LAW7III. JURY DEMOGRAPHICS AND CENSUS DATASECTION 528 DOES NOT REQUIRE that this report compare the results of the jury demographics survey toNew York’s population. Nonetheless, to provide some context, this report will present some demographic data from the census.It must be strongly cautioned, however, that the jury-eligible population is not the same as thegeneral population as reported in the census. Specifically, the following categories of persons are,by statute, not eligible for jury service:11Persons under the age of 18Non-citizensPersons who cannot understand and communicate in EnglishPersons who have been convicted of a felony.While the census does provide data on the 18-and-over population,12 there are currently no detailed data available regarding citizenship, English language fluency, or felony status by ethnicity orrace. To the extent that any racial or ethnic group is disportionately affected by any of these eligibilitystandards, the demographic makeup of the jury-eligible population will differ from that of the census. In the absence of data with respect to those three eligibility categories, it is not possible to knowthe exact ethnic and racial makeup of the jury-eligible population.Finally, it is important to note that persons convicted of felonies are, during the period of incarceration, counted as residents of the county of incarceration. For a number of upstate countieswith large incarcerated populations, the result can be a significant demographic difference betweenthe county’s jury-eligible population and the county’s population as reflected in the census.GENDERFifty two percent (52%) of those responding identify themselves as female, which is the samepercentage of women in New York’s 18-and-over population, while 45% identified themselves as maleand 3% failed to respond to the question. County-by-county figures for males and females, comparedto the 18-and-over population, are included in Appendix TABLE B on page 15.CHaRt 1GENDER: JUROR DEMOGRAPHICS AND POPULATION 18 COMPAREDJury totals do not equal 100% due to non-responses11Judiciary Law Section 510.12 US Census, Table B01001: SEX BY AGE -Universe: Total population; 2010 American Community Survey 1-Year Estimates
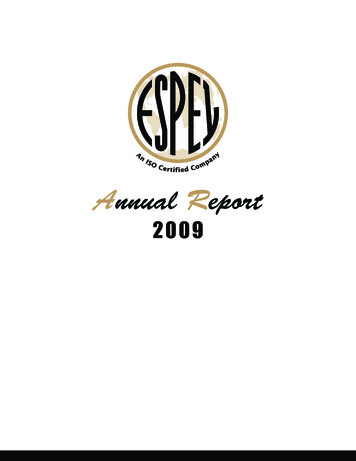
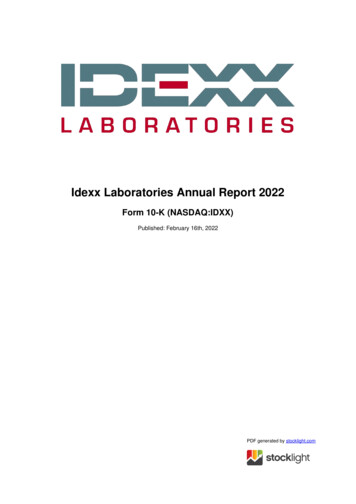
Contents8THE CHIEF ADMINISTRATIVE JUDGE OF THE STATE OF NEW YORKHISPANIC, LATINO OR SPANISH ORIGINSixteen percent (16%) of New York State’s 18-and-over population is of Hispanic origin, while15% of information card responders indicated that they are of Hispanic origin. People of Hispanic,Latino or Spanish origin can be of any race.13CHaRt 2HISPANIC ORIGIN (of any race):JUROR DEMOGRAPHICS AND POPULATION 18 COMPAREDENDER TABLE BJury totals do not equal 100% due to non-responsesSixteen percent (16%) of jurors failed to answer the question concerning Hispanic ethnicity.Among those who identified themselves as Hispanic, 40% (or 6% of the total juror information cardresponders) did not answer the question about race.14According to U.S. Census reports, people of Hispanic or Latino origin comprise 17.6% of NewYork State’s total 2010 population: 43% (or 7.4% of the total population), identify themselves as whitealone and 9% (or 1.5% of the total population) identify themselves as black alone. The remainder ofHispanics identify themselves as members of other races alone or some combination of races.County-by-county figures comparing the percentage of Hispanics in New York State’s 18-andover population and in the jury population are included in Appendix TABLE C on page 16.RACEWith respect to race, 61% of information card responders self-identified as white, while the2010 census reports that 67% of New Yorkers 18-and-over are white. Among juror information cardresponders, 17% self-identified as black, compared to 15% in New York’s 18-and-over population. Similarly, 9% of information card responders said they were Asian, while the 2010 census reports that8% of New York’s 18-and-over population is Asian.One notable area of difference between juror responders and the 18-and-over census figuresconcerns those who identify themselves as members of some other race or more than one race. Thisgroup accounts for 10% of the 18-and-over population and 6% of juror information card responders.Here again, inclusion of ineligibles in the 18-and-over population may have an impact. In addition,there is no way of knowing the racial makeup of the 7% who failed to respond to the race question.13 Table QT-P3 Race and Hispanic or Latino Origin 2010 Census Summary File 1.14 Table QT-P6 Race Alone or in Combination and Hispanic or Latino Origin 2010 Census Summary File 1.
Contents1 ST ANNUAL REPORT PURSUANT TO SECTION 528 OF THE JUDICIARY LAW9RACE: JUROR DEMOGRAPHICS AND POPULATION 18 COMPAREDCHaRt 3ENDER TABLE BJury totals do not equal 100% due to non-responsesAppendix TABLE D on page 17 contains a county-by-county comparison of the racial makeupof New York State’s 18-and-over population and of the jury population.AGEJurors were asked to indicate the year of their birth. There were 42,781 jurors who did not doso. For those who did respond, age was calculated electronically. The age distribution among the responding jurors is close to the estimated percentage in that group according to the American Community Survey. One group in which there is a notable difference between the juror population andthe 18-and-over population are those aged 75 and over. This difference may be the result of a higherrate of excusal for medical, financial and transportation reasons among this segment of the population.table 6AGE: JUROR DEMOGRAPHICS AND POPULATION 18 COMPAREDAppendix TABLE E on page 19 contains a county-by-county comparison of age distribution forthe 39 counties for which detailed 18-and-over census data are available.
Contents10THE CHIEF ADMINISTRATIVE JUDGE OF THE STATE OF NEW YORKENGLISH LANGUAGE PROFICIENCYThe New York State Judiciary Law requires that jurors be United States citizens and also ableto “understand and communicate in the English language.” There are no 2010 census data at thistime regarding English language fluency by ethnicity or race. Thus, there is no way to know whatpercentage of New York State residents are not qualified to serve due to language status.However, the 2010 census data concerning the “Estimated percentage of households where noone age 14 or over speaks English only or speaks English ‘very well’” reports that 8.2% of New YorkState households are included in this category.15 Counties in and around New York City have thelargest percentage of households with no one over 14 speaking English only or very well: in Bronx,Kings and Queens, 17% to 18% of households are in this category, and, in Manhattan, 9%. In Richmond,Rockland, Westchester and Nassau, between 5% and 7% of households have no one over 14 speakingonly English or English very well. These data do not predict the English language fluency of prospective jurors. However, they provide an indicator of the extent to which a community includes a largenumber of prospective jurors who may not meet the statutory English language requirement.table 7Households With No One 14-or-Over With English Fluency — Selected Counties15 U.S. Census Table: S1602 Estimated percentage of households in each county where no one age 14-and-over speaksEnglish only or speaks English “very well”.
Contents1 ST ANNUAL REPORT PURSUANT TO SECTION 528 OF THE JUDICIARY LAW11IV. DISCUSSIONON A STATEWIDE BASIS, the results of the juror demographics study track the 18-and-over census datafairly closely. For example, 15% of responding jurors identified themselves as black, while the percentage of blacks in the statewide 18-and-over population is 15%. Similarly, 16% of responding jurorsidentified themselves as Hispanic or Latino, while this group comprises 15% of the statewide population 18-and-older.On a county-by-county basis there is more variation. In certain counties, the demographicmakeup is virtually identical. For example, in the Bronx and Kings, the percentages of blacks in the18-and-over population and in the jury population are identical: 36% in the Bronx and 34% in Kings.Queens and Manhattan show very slight differences between the jury population and the 18-andover population: in Queens 17% of the jury population identified themselves as black, compared to18% in the 18-and-over population; and, in New York County, 13% identified themselves as black compared to 15% in the 18-and-over population.In New York City, there appears to be a somewhat larger gap between the percentage of jurorsidentifying themselves as Hispanic, Latino, or of Spanish heritage, and the percentage of this groupin the 18-and-over population. For example, in the Bronx, 47% of the jurors identified themselves asHispanic, Latino, or Spanish heritage compared to 51% in the population, while in New York Countythe numbers are 17% and 23%, and in Queens, 17% and 26%. Similarly, in certain counties outsideNew York City, the raw data show a divergence between the demographic profile based on the 18and-over census data and jurors’ racial and ethnic self-identification.As discussed above, these differences may be due, at least in part, to racial and ethnic differenceswith respect to the juror eligibility. For example, the racial and ethnic makeup of the eligible jurorpool in Bronx , Kings and Queens Counties is certainly affected by the fact that, according to the2010 Census, in 17 to 18 percent of households in these counties, no one over the age of 14 speaksonly English or speaks English very well. Similarly, the fact that the census counts incarcerated felonsas residents of the county of incarceration has a significant impact in small upstate counties withlarge incarcerated populations. The lack of detailed data makes it impossible to precisely calculatethe impact that the statutory requirements regarding citizenship, English language competence, andfelony status have on racial and ethnic makeup of the eligible jury pool. There is no doubt, however,that in many counties, these statutory eligibility requirements do have an impact.Another factor may be differences in non-deliverable and non-response rates between communities in certain counties. A study of juror demographics in Monroe County offers some insightinto this factor.In 2010, independent of the requirements of section 528, the Office of Court Administrationundertook a comprehensive demographic study of questionnaire and summons response and nonresponse in Monroe County.16 The same demographic questions as were asked in the statewide datacollection card were answered by 1,619 Monroe County questionnaire responders, 976 trial jurors,and 336 grand jurors.16 The study was conducted by the OCA Office of Court Research, in consultation with Professor Valerie Hans ofCornell Law School, Paula Hannaford-Agor, Director of the Center for Jury Studies at the National Center forState Courts, and G. Thomas Munsterman, Director Emeritus of the Center for Jury Studies.
12THE CHIEF ADMINISTRATIVE JUDGE OF THE STATE OF NEW YORKMonroe County’s jury-eligible black population was estimated to be 12%, based on 2000 and2006-08 census data.17 Among Monroe County responses to race questions, 9.5% of questionnaire responders identified themselves as black, as did 7.2% of people appearing for trial jury service and 8.6%of people appearing for grand jury service. The study concluded that non-response to questionnairesand non-deliverable questionnaires was a factor in the difference between actual and expected percentages of jurors from communities with larger percentages of black and low-income people. In addition, there was evidence that blacks had a higher rate of temporary excusal at the summons stage.18Communities in Monroe County with high percentages of low-income people and blacks are overrepresented among non-responders and non-deliverables. While 18% of Monroe residents lived in communities with a 1999 median income under 30,000,19 these communities accounted for 44% of theundeliverable questionnaires and 35% of the non-responses to questionnaires. Similarly, while 7% ofMonroe residents lived in communities with 60% or greater black population, these communities accounted for 15% of the undeliverable questionnaires and 22% of the non-responses to questionnaires.The Monroe County study thus suggested that, at least in some geographic areas, non-deliverablemailings and non-response to juror mailings might impact representativeness. There are a numberof possible approaches to reducing the impact of non-deliverable and non-responses to mailings,some of which could be implemented administratively and others that require legislation.One administrative approach is a public outreach program that would seek to increase jury participation in areas with high undeliverable and non-response rates, by such means as working withcommunity organizations to identify ways to improve communication with and response rates fromthese communities. Another administrative approach would be to increase the use of non-complianceproceedings, pursuant to section 527 of the Judiciary Law, against persons who fail to respond to ajuror qualification questionnaire or summons.Other approaches to increasing response rates from communities with high rates of undeliverable questionnaires and non-response require legislative authorization. One such approach is “targeted replacement mailing,” under which each mailing that is undeliverable or to which no responseis received is replaced by a mailing to a randomly selected address in the same zip code or census tract.Another approach requiring legislative authorization is “weighted random sampling,” under whichan increased number of juror notices is mailed to communities with high undeliverable and non-response rates. Each of these approaches replaces true random selection with oversampling from communities with higher undeliverable and non-response rates, and thus represents a shift away fromthe long-standing public policy, embodied in statute,20 that fairness and representativeness require apure random selection process. Detailed study would be required to assure that a targeted mailingapproach would not adversly affect juror representation or subject some citizens to more frequentjury service.17 2010 census data were not yet available when the study was completed and analyzed. Note that this estimate ofthe jury-eligible population does not account for the impact, if any, of ineligibility due to felony status.18 Among 901 jurors qualified in the study who were later summoned to serve, 11% of summoned whites and 20% ofsummoned blacks received temporary excusals from service. There was no difference in the postponement rateof each group.19 The 1999 income data was the most recent income data available at the Census tract level at the time of comple-tion of the Monroe County report.20 Judiciary Law §507.
Contents1 ST ANNUAL REPORT PURSUANT TO SECTION 528 OF THE JUDICIARY LAW13APPENDIXCOUNTY BY COUNTY DATA TABLESTHE FOLLOWING PAGES CONTAIN FIVE TABLES showing each county’s number of responses, and percentageof each demographic characteristic. For each table, the data are compared to 2010 census data forthe 18-and-over population.Table A:Jurors Served and Cards Completed by County. . . . . . . . . . . . . . . . . . . . . . .14Table B:Gender by County. . . . . . . . . . . . . . . . . . . . . . . . . . . . . . . . . . . . . .15Table C:Hispanic Origin of Any Race by County .Table D:Race by CountyTable E:Age Groups for Available Counties. . . . . . . . . . . . . . . . . . . . . . . . . . .16. . . . . . . . . . . . . . . . . . . . . . . . . . . . . . . . . . . . . . . .17. . . . . . . . . . . . . . . . . . . . . . . . . . . . . .19
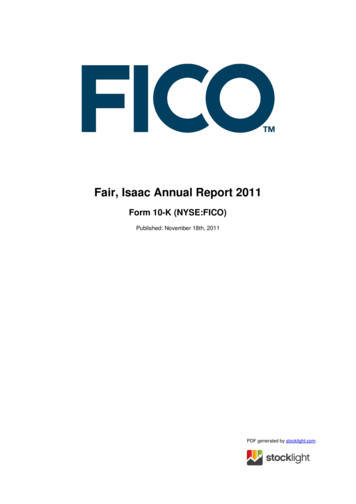
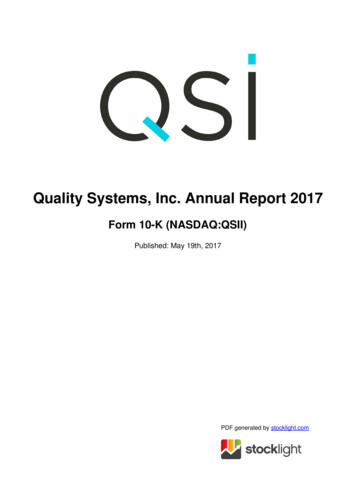
Contents14THE CHIEF ADMINISTRATIVE JUDGE OF THE STATE OF NEW YORKTable A: Jurors Served and Cards Completed by County TableA: Jurors Served and Cards Completed by CountySeptember 13, 2010 to September 9, 2011 September 13, 2010 to September 9, 2011Table updated 12Ͳ9Ͳ2011. Original report released 12Ͳ6Ͳ2011. Numbers of jurors served has changed from 542,024 to 485,227; numbers of completed cards remained the same. County ALBANY ALLEGANY BRONX BROOME CATTARAUGUS CAYUGA CHAUTAUQUA CHEMUNG CHENANGO CLINTON COLUMBIA CORTLAND DELAWARE DUTCHESS ERIE ESSEX FRANKLIN FULTON GENESEE GREENE HAMILTON HERKIMER JEFFERSON KINGS LEWIS LIVINGSTON MADISON MONROE MONTGOMERY NASSAU NEW YORK NIAGARA Completed Cards Served 8,723 8,829286 289Jurors County Completed Jurors Served Cards ONEIDAONONDAGA 3,008 6,467 2,6156,22548,040 45,063ONTARIO 2,475 2,2014,952 4,196ORANGE 8,804 5,1891,047 763 1,237 2,888 373 1,783 969 354 1,079 5,132 17,755 433 653 727 1,356 500 84 422 1,267 84,675 566 799 561 19,227 1,091 35,494 71,592 2,771 871,9632,502781 1,513 820 1,007 49,802 2,660 14,848 5,698 1,670 1,755 3,523 316 258 459 1,005 30,077 2,365 828 1,118 4,293 1,491 1,257 1,145 16,896 754 535 485,227 RENSSELAERRICHMONDROCKLANDST HINGTONWAYNEWESTCHESTERWYOMINGYATESTOTAL * Source of jurors is Jury Management System, October 11, 2011. In twelve counties there are more cards than jurors served. This discrepancy is caused by records processing (i.e., some records for jurors who served by September 9, 2011 were not completely processed by October 11, 2011). In three New York City counties ͲͲ Kings, New York, and Richmond ͲͲ 171,115 juror service records were completed and 175,476 juror cards were completed. The other nine counties are Albany, Allegany, Columbia, Erie, Essex, Greene, Montgomery, Schenectady and Warren. In these nine counties 34,771 juror service records were completed 37,385 cards were completed.
Contents1 ST ANNUAL REPORT PURSUANT TO SECTION 528 OF THE JUDICIARY LAWTable B:Gender by County15
Contents16THE CHIEF ADMINISTRATIVE JUDGE OF THE STATE OF NEW YORKTable C: Hispanic Origin of Any Race by County
Contents1 ST ANNUAL REPORT PURSUANT TO SECTION 528 OF THE JUDICIARY LAWTable D: Race by County17
18THE CHIEF ADMINISTRATIVE JUDGE OF THE STATE OF NEW YORKTable D: Race by County continued
Contents1 ST ANNUAL REPORT PURSUANT TO SECTION 528 OF THE JUDICIARY LAWTable E: Age Groups for Available Counties19
FIRST ANNUAL REPORTPURSUANT TO SECTION 528 OF THEJUDICIARY LAWANN PFAUCHIEF ADMINISTRATIVE JUDGE OF THE STATE OF NEW YORK
tees on Judiciary and Codes in New York City, April 30, 2009. 3 See generally, ABA PRINCIPLES FOR JURIES AND JURY TRIALS . holders of New York State driver's licenses or DMV-issued identification cards, tax filers, unemployment insurance recipients, and recipients of family assis- . NEW YORK STATE JURORS: SEPTEMBER 13, 2010 — SEPTEMBER .