Transcription
CLASS OF 2021FULL-TIME MBA EMPLOYMENT REPORT
The next business model. The next wave of technology.Here, we are intently focused on the future of business.Class of 2021 Full-Time EmploymentClass Profile . . . . . . . . . . . . . . . . . 4Employment Summary . . . . . . . . . . . . . . . . . . . . 5Function Details . . . . . . . . . . . . . . . . . . . . . . . . . . 9Location Details . . . . . . . . . . . . . . . . . . . . . . . . . 10Industry Summary . . . . . . . . . . . . . . . . . . . . . . . . 6Hiring OrganizationsIndustry Details . . . . . . . . . . . . . . . . . . . . . . . . . . 7Recent Employers . . . . . . . . . . . . .12Function Summary . . . . . . . . . . . . . . . . . . . . . . . . 8Top Hiring Firms . . . . . . . . . . . . . .13Class of 2022 Summer InternshipsClass Profile . . . . . . . . . . . . . . . .14Internship Summary . . . . . . . . . . . .15Industry and Function Details . . . . . . . .16Location Details . . . . . . . . . . . . . .183
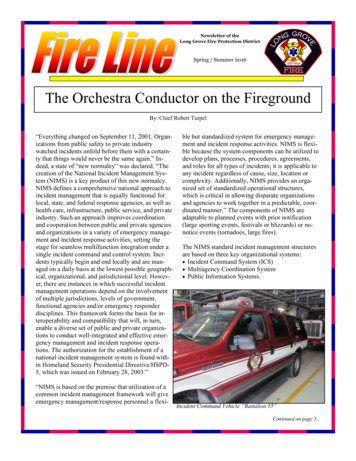
C LASS P RO FILECLASS OF 2021 FULL-TIME EMPLOYMENTDEMOGRAPHIC PROFILESUMMER INTERNSHIP EXPERIENCES (SUMMER 2020)Total Applicant Pool . . . . . . . . . . . . . . . . . . . . . . . . . . . . . . . . . . . . . . . . 2,817FTMBA Class of 2021 students spent the summer of 2020 (between their first and second years) doing internshipsin the following industries and functions.Number of Entering Class . . . . . . . . . . . . . . . . . . . . . . . . . . . . . . . . . . . . 360INDUSTRY BREAKDOWN PERCENT OF INTERNSHIPSAverage Years of Work Experience . . . . . . . . . . . . . . . . . . . . . . . . . . . . . . . 5Women . . . . . . . . . . . . . . . . . . . . . . . . . . . . . . . . . . . . . . . . . . . . . . . . . . . . 34%OtherTransportation/Logistics ServicesRetailEnergy / UtilitiesInvestment ManagementOther Financial ServicesPrivate Equity/Venture CapitalInternational Citizens . . . . . . . . . . . . . . . . . . . . . . . . . . . . . . . . . . . . . . . . 33%Countries Represented . . . . . . . . . . . . . . . . . . . . . . . . . . . . . . . . . . . . . . . . 37Joint Degree Graduates* . . . . . . . . . . . . . . . . . . . . . . . . . . . . . . . . . . . . . . . . . . . . . 8* * There were eight graduates who obtained a joint degree with the following graduate programs at UCLA:computer science, law, medicine, public health, public policy and urban planning. 2.0%0.9%0.9%1.8%2.7%3.0%3.6%Real Estate 3.9%UCLA Anderson is a member of the Consortium, and there were 20 Fellows in the Class of 2021. For moreinformation, go to http://cgsm.org/.32.0% TechnologyEntertainment/Media 7.5%TOP PRE-MBA EXPERIENCES BY INDUSTRYTechnology . . . . . . . . . . . . . . 26%Consumer Goods . . . . . . . . . . 7%Consumer Products 9.0%Finance . . . . . . . . . . . . . . . . . . 25%Public Sector / Non-Profit . . . 5%Healthcare 9.9%Consulting . . . . . . . . . . . . . . . 20%Real Estate . . . . . . . . . . . . . . . . 4%Healthcare . . . . . . . . . . . . . . . 10%Entertainment / Media . . . . . 3%Investment Banking 10.2%12.6% ConsultingFUNCTION BREAKDOWN PERCENT OF INTERNSHIPSEMPLOYMENT PROFILETotal StudentsPermanent Non-PermanentNumberU.S. WorkU.S. Workof StudentsAuthorization Authorization25289341Percentof TotalStudents100.0%Students Reporting Employment InformationSeeking EmploymentNot Seeking EmploymentCompany SponsoredStarting Own CompanyOther ReasonsNo Information Available4LawBusiness Intelligence / AnalyticsReal Estate FinanceReal Estate DevelopmentInvestment ManagementVenture Capital / Private Equity 0.6% 1.5% 1.5% 1.8% 2.7% 3.6%17.1% ConsultingBrand Management .2%3030.9%Business / Corporate Development 4.5%Operations/Logistics 5.4%14.7% Product ManagementGeneral Management 5.7%Marketing - Other 6.0%Corporation Finance /Financial Analysis / FP&A 6.3%Strategic Planning 6.6%10.5% Investment Banking7.2% Product Marketing
JOB OFFERSNumberof StudentsPercentof Students1By graduation . . . . . . . . . . . . . . . . . . . . . . . . . . . . 247 . . . . . . . . 81.8%3Permanent U.S. Work Authorization . . . . . . . . 186 . . . . . . . . 61.6%COMPENSATION SUMMARYPercent of StudentsReporting Salary Data2Annual Base SalaryNon-Permanent U.S. Work Authorization . . . . . . 61 . . . . . . . . 20.2%By 3 months after graduation3 . . . . . . . . . . . . . . . 281 . . . . . . . . 93.0%Permanent U.S. Work Authorization . . . . . . . . 209 . . . . . . . . 69.2%By 6 months after graduation . . . . . . . . . . . . . 296 . . . . . . . . 98.0%4Permanent U.S. Work Authorization . . . . . . . . 183 . . . . . . . . 60.6%Non-Permanent U.S. Work Authorization . . . . . 59 . . . . . . . . 19.5%By 3 months after graduation3 . . . . . . . . . . . . . . 280 . . . . . . . . 92.7%Permanent U.S. Work Authorization . . . . . . . . 208 . . . . . . . . 68.9%Non-Permanent U.S. Work Authorization . . . . . 72 . . . . . . . . 23.8%By 6 months after graduation4 . . . . . . . . . . . . . 293 . . . . . . . . 97.0%Percentages were calculated from the number of students who were seeking employment.1 Percentages were calculated from the number of students who accepted employment within threemonths after graduation.2 Graduation date was June 11, 2021, so three months post graduation was September 11, 2021.3 Data collected after three months post graduation is not part of the MBA CSEA Employment Standards.4 UCLA Anderson bounced back strongly from the COVID-relatedchallenges in 2020 with significant increases in the number ofoffers received by graduation and post three months.Percentage of 2021 graduates receiving stock and/or equity as partof their compensation increased to 36.1% from 30.6% in 2020.46.1% of graduates’ full-time job acceptances came from theirsummer internships, 5% more than in 2020.Range95.7% 135,273 130,000 31,650- 190,00096.6% 137,514 135,000 80,000- 175,000Non-Permanent U.S. Work Authorization93.1% 128,549 125,000 31,650- 190,00072.8% 29,877 30,000 2,000- 75,000Permanent U.S. Work Authorization74.1% 29,516 30,000 2,000- 65,000Non-Permanent U.S. Work Authorization68.7% 31,043 30,000 5,000- 75,000Graduates receiving stock and/or equity as part of their compensation package . . . . . . . . . . . . . . . 36.1%JOB ACCEPTANCESBy graduation3 . . . . . . . . . . . . . . . . . . . . . . . . . . . . 242 . . . . . . . . 80.1%MedianPermanent U.S. Work AuthorizationSigning BonusNon-Permanent U.S. Work Authorization . . . . . 72 . . . . . . . . 23.8%MeanE MP LOYME NT S U MMARYE M PLOYMEN T SUM M ARYSOURCE OF EMPLOYMENTPercent of Students2UCLA Anderson-Facilitated Resources . . . . . . . . . . . . . . . . . . . . . . . . . . . . . . . . . . . . . . . . . . . . . . . . . . . . . . . . . . . . . 63.2%Summer Internship Employer (internship was found through campus recruiting program) . . . . . . . . . . . . . . . . . . . 34.3%myCareer Job Postings . . . . . . . . . . . . . . . . . . . . . . . . . . . . . . . . . . . . . . . . . . . . . . . . . . . . . . . . . . . . . . . . . . . . . . . . . . . . . . . . 8.6%Summer Internship Employer (internship was found through other UCLA Anderson resources) . . . . . . . . . . . . . . . . 6.1%Campus Recruiting Program (including myCareer Resume Collections) . . . . . . . . . . . . . . . . . . . . . . . . . . . . . . . . . . . . . 5.4%UCLA Anderson Alumni(ae) and Classmates . . . . . . . . . . . . . . . . . . . . . . . . . . . . . . . . . . . . . . . . . . . . . . . . . . . . . . . . . . . 4.3%Other Parker CMC Resources (advisors, events, resume database, spring virtual career fair, etc.) . . . . . . . . . . . . . . 1.4%UCLA Anderson Resources – Clubs (Career Night, DOJs/treks, etc.) . . . . . . . . . . . . . . . . . . . . . . . . . . . . . . . . . . . . . . . 1.1%UCLA Anderson Resources – Faculty and Research Centers . . . . . . . . . . . . . . . . . . . . . . . . . . . . . . . . . . . . . . . . . . . . . . . 1.1%National MBA Career Conferences (Consortium, Forte, ROMBA, NBMBAA, Prospanica, etc.) . . . . . . . . . . . . . . . . . 0.7%Other UCLA-Related Resources/Contacts . . . . . . . . . . . . . . . . . . . . . . . . . . . . . . . . . . . . . . . . . . . . . . . . . . . . . . . . . . . . . . 0.4%Non-UCLA Anderson-Facilitated Resources . . . . . . . . . . . . . . . . . . . . . . . . . . . . . . . . . . . . . . . . . . . . . . . . . . . . . . . . 36.8%Other Website / Online Resources (LinkedIn, Indeed.com, etc.) . . . . . . . . . . . . . . . . . . . . . . . . . . . . . . . . . . . . . . . . . . . 8.6%Company Website . . . . . . . . . . . . . . . . . . . . . . . . . . . . . . . . . . . . . . . . . . . . . . . . . . . . . . . . . . . . . . . . . . . . . . . . . . . . . . . . . . . 8.2%Family/Friend / Personal/Undergraduate Network (non-UCLA Anderson-related) . . . . . . . . . . . . . . . . . . . . . . . . . . 5.7%Summer Internship Employer (internship was found through non-UCLA Anderson resources) . . . . . . . . . . . . . . . . . 5.7%Direct Company Contact (not facilitated by UCLA Anderson) . . . . . . . . . . . . . . . . . . . . . . . . . . . . . . . . . . . . . . . . . . . . . 3.6%Other Resources / Contacts (non-UCLA Anderson-related) . . . . . . . . . . . . . . . . . . . . . . . . . . . . . . . . . . . . . . . . . . . . . . . 3.2%Pre-MBA Employer Network . . . . . . . . . . . . . . . . . . . . . . . . . . . . . . . . . . . . . . . . . . . . . . . . . . . . . . . . . . . . . . . . . . . . . . . . . . 1.8%12 ercentages were calculated from the number of students who were seeking employment.PPercentages were calculated from the number of students who accepted employment within three months after graduation.5
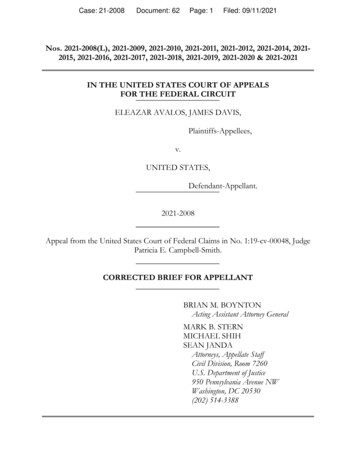
IN DU STRY S UMMARYCLASS OF 2021 FULL-TIME EMPLOYMENTIND USTRY SUM M ARYINDUSTRY CHOICES, 2016 TO 202135.0%Technology; 33.2%30.0%2021 graduates joining the financialservices industry increased to 18.9%from 14.4% in 2020.% of Job Acceptances25.0%20.0%Financial Services: 18.9%Consulting Services: 16.4%Class of 2021 Graduates startedtheir own companies during theirtime at UCLA Anderson in thefollowing industries:15.0%ApparelDigital MediaE-CommerceFood and Beverage10.0%Health Care: 7.9%Consumer Products: 7.5%Entertainment/Media: 6.1%5.0%Other: 3.5%Real Estate: 3.5%Energy/Utilities: 2.5%0.0%6Consulting, financial services and technologycontinue to be the top industries of choice,combining for 68.5% of job acceptancesby 2021 graduates.Education/Nonprofit: t / MediaTechnologyVenture Capital
ANNUAL BASE SALARY 2SIGNING BONUS 2Percent ReceivingPercent ReceivingPercent of ptions2Signing BonusConsulting16.4% 154,783 160,000 110,000- 175,00093.5% 27,907 30,000 10,000- 50,0002.2%Consumer ProductsApparel / TextilesBeverages / Food / Household GoodsOther (including Luxury Goods and Toys)7.5%1.8%4.3%1.4% 117,114 122,200 113,867 120,500 120,000 120,000 110,000 120,000 85,000- 140,400 120,000- 131,000 85,000- 140,400 115,000- 127,00071.4%80.0%66.7%75.0% 25,000 20,000 28,750N/A2 20,000 20,000 32,500N/A2 15,000- 50,000 20,000- 20,000 15,000- 50,000N/A219.0%0.0%42.8%25.0%Energy / UtilitiesAlternative EnergyUtility ServicesOther (including EV Infrastructure)2.5%1.1%0.4%1.1% 126,286N/A2N/A2N/A2 125,000N/A2N/A2N/A2 115,000- 140,000N/A2N/A2N/A271.4%33.3%100.0%100.0% 21,500N/A2N/A2N/A2 20,000N/A2N/A2N/A2 5,000- 50,000N/A2N/A2N/A214.3%33.0%0.0%0.0%Entertainment / MediaGamingGeneral (Broadcast, Film, Music, Publishing)Sports ManagementOther (including Advertising, Digital Media)6.1%1.4%2.5%0.7%1.4% 108,854 103,754 109,521N/A2N/A2 117,500 107,500 120,000N/A2N/A2 31,650- 140,000 80,000- 120,016 31,650- 140,000N/A2N/A247.1%75.0%28.6%50.0%50.0% 9,313N/A2N/A2N/A2N/A2 5,000N/A2N/A2N/A2N/A2 2,000- ncial ServicesInvestment Banking / BrokerageInvestment ManagementPrivate Equity / Venture CapitalOther Financial Services18.9%10.7%3.3%2.5%2.5% 143,873 152,069 135,000 137,857 126,071 150,000 150,000 137,500 140,000 120,000 100,000- 175,000 100,000- 175,000 100,000- 160,000 120,000- 165,000 125,000- 160,00062.3%90.0%11.1%14.3%57.1% 45,606 51,296N/A2N/A2 22,500 50,000 50,000N/A2N/A2 22,500 5,000- 65,000 40,000- 65,000N/A2N/A2 5,000- gy / PharmaceuticalMedical DevicesProviders and ServicesOther (including Digital Health)7.9%1.8%1.4%2.1%2.5% 125,838 127,520N/A2 115,000 131,429 125,000 124,200N/A2 120,000 130,000 80,000- 155,000 115,000- 150,000N/A2 80,000- 130,000 120,000- 155,00072.7%100.0%100.0%83.3%42.9% 20,813 25,000N/A2 25,600N/A2 17,500 30,000N/A2 30,000N/A2 8,000- 35,000 15,000- 30,000N/A2 8,000- 35,000N/A238.1%40.0%100.0%40.0%37.5%Non-Profits / Social l EstateCommercialGeneral3.6%2.1%1.4% 121,500 120,000 123,750 120,000 122,500 120,000 110,000- 145,000 110,000- 130,000 110,000- A2N/A2N/A250.0%33.2%4.6%12.9%6.8%0.7%8.2% 134,287 140,725 133,267 125,389N/A2 119,077 131,000 151,850 130,000 130,000N/A2 119,000 87,000- 190,000 95,000- 160,000 97,760- 190,000 87,000- 145,000N/A2 55,000- 155,00073.1%53.8%75.0%78.9%100.0%53.8% 31,411 21,429 34,554 39,200N/A2 29,143 30,000 20,000 30,000 40,000N/A2 25,000 5,000- 75,000 15,000- 30,000 13,950- 60,000 20,000- 75,000N/A2 12,000- 55,00080.9%69.2%86.1%78.9%0.0%87.0%Transportation / Logistics Services1.4% 143,750 145,000 125,000- 160,00050.0%N/A2N/A2N/A275.0%Other (including Agribusiness, Construction Services)1.4%0.0%N/AN/AN/A0.0%TechnologyEquipment / Hardware / NetworkingGeneralInternet Services / E-CommerceMultimedia Products and ServicesSoftwareN/A2N/AN/A22222IN DU STRY B R EAK DOW NB ROK EN D OW N BY I N D U ST RY71Percentages were calculated from the number of students who accepted employment within three months after graduation.2Compensation data is self-reported. Salary data is not provided for functions with fewer than four data points available.
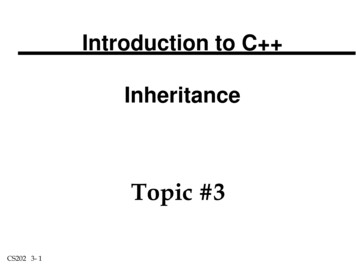
FU N C TIO N S UMMARYCLASS OF 2021 FULL-TIME EMPLOYMENTFUNCTION SUM M ARYPercent of Hires1TOP 12 FUNCTIONS . . . . . . . . . . . . . . . . . . . . . . . . . . 83.5%Product Management . . . . . . . . . . . . .16.8%Management Consulting . . . . . . . . . . .16.1%Investment Banking . . . . . . . . . . . . . .10.7%Corporation Finance/FP&A . . . . . . . . . . . . . . . . . . . . . 8.2%Rotation Program . . . . . . . . . . . . . . . . . . . . . . . . . . . . . . 5.4%Business/Corporate Development . . . . . . . . . . . . . . 4.6%Brand Management . . . . . . . . . . . . . . . 4.6%Corporate Strategy/ Strategic Planning . . . . . 4.6%Investment Management . . . . . . . . . . . . 3.2%Product Marketing . . . . . . . . . . . . . . . 3.2%Project Management . . . . . . . . . . . . . . 3.2%VC/PE . . . . . . . . . . . . . . . . . . . . . 2.9%All Others* . . . . . . . . . . . . . . . . . . .16.5%* See Function Specifics page for full list of the various functions Class of2021 FTMBA graduates joined upon graduation.Percentages were calculated from the number of students who accepted employmentwithin three months after graduation.1 4.4% of Class of 2021 graduates were sponsored and returnedto their pre-MBA employers in the following job functions:Business DevelopmentCommercial BankingCorporate Finance / TreasuryCorporate Strategy8General ManagementInvestment ManagementManagement ConsultingPercentage of graduates enteringthe product management functionincreased from 10.2% in 2020 to16.8% in 2021.Top 12 functions chosen by 2021graduates made up 83.5% of all jobacceptances, an increase from77.2% in 2020.
ANNUAL BASE SALARY 2SIGNING BONUS 2Percent ReceivingRangeSigning BonusPercent of Hires1MeanMedianConsulting18.2% 152,224 160,000 97,000- 175,000Internal2.1% 124,750 131,000 97,000- 140,000Management / StrategyFinance / AccountingCorporation Finance / FP&A / TreasuryPercent ReceivingStock/Equity/Options2MeanMedianRange90.2% 27,609 30,000 10,000- 50,0007.8%50.0%N/A2N/A2N/A250.0%16.1% 154,667 160,000 110,000- 175,00095.6% 27,907 30,000 10,000- 50,0002.2%26.8% 139,783 150,000 100,000- 175,00069.3% 38,423 40,000 10,000- 65,00018.7%8.2% 129,064 125,000 110,000- 157,00082.6% 26,474 25,000 10,000- 40,00027.9%10.7% 145,000 150,000 110,000- 150,00083.3% 55,500 52,500 50,000- 70,0000.0%Investment Management3.2% 132,778 125,000 100,000- 160,00033.3%N/A2N/A2N/A20.0%Real Estate Finance1.8% 123,750 122,500 120,000- 130,00040.0%N/A2N/A2N/A20.0%Venture Capital / Private Equity2.9% 140,625 140,000 120,000- 165,00012.5%N/A2N/A2N/A225.0%40.0%Investment BankingGeneral Management8.9% 125,194 127,500 97,760- 155,00076.0% 26,763 30,000 2,000- %Project Management3.2% 124,807 130,000 97,760- 155,00077.8% 25,857 25,000 2,000- 50,00077.8%Rotational Program5.4% 123,671 125,000 110,000- 140,40080.0% 27,292 30,000 5,000- 40,00020.0%29.6% 126,816 127,000 31,650- 190,00067.5% 26,482 20,000 5,000- 75,00055.4%Brand Management4.6% 109,309 110,000 80,000- 125,00084.6% 24,091 20,000 5,000- 50,0007.7%Marketing Research / Analytics1.8% 127,500 130,000 115,000- 135,00080.0% 12,500 15,000 5,000- 15,00080.0%16.8% 131,953 130,000 31,650- 190,00063.8% 26,267 22,500 5,000- 60,00057.4%3.2% 133,022 130,000 120,000- 156,00088.9% 29,375 25,000 5,000- 60,000100.0%Sales / Account Management2.5% 120,571 125,000 87,000- 150,00028.6%N/A2N/A2N/A257.1%Other keting / SalesProduct ManagementProduct MarketingOperations / Logistics2.9% 126,250 127,500 120,000- 135,00062.5% 36,000 40,000 20,000- 30,00075.0%13.6% 130,678 131,000 80,000- 165,00044.7% 22,732 20,000 2,500- 50,00055.3%Business / Corporate Development4.6% 133,538 131,000 110,000- 160,00023.1%N/A2N/A2N/A253.8%Business Intelligence / Analytics0.8% 113,313 119,500 70,000- 130,00037.5%N/A2N/A2N/A250.0%Customer Success / Client Solutions1.8% 124,400 120,000 109,000- 145,00080.0% 28,750 30,000 20,000- 35,000100.0%Real Estate porate Strategy / Strategic Planning4.5% 133,005 132,500 104,050- 156,00053.8% 19,136 20,000 10,000- 30,00053.8%Other (including Engineering and duates entering the investment bankingfunction more than doubled from 2020 to 2021.12FU N C TIO N B R EAK DOW NBROK EN DOW N BY FU N C T I O NPercentages were calculated from the number of students who accepted employment within three months after graduation.Compensation data is self-reported. Salary data is not provided for functions with fewer than four data points available.9
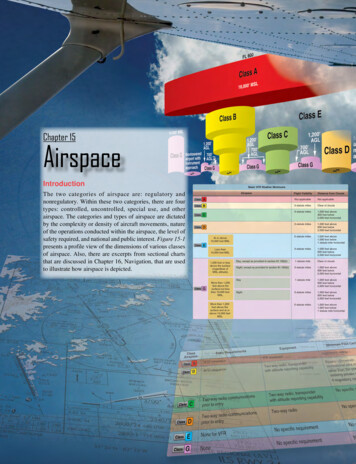
LO C ATIO N S UMMARYCLASS OF 2021 FULL-TIME EMPLOYMENTLOCATIO N SUM M ARYClass of 2021 FTMBA graduates landed in jobsoutside of the US in the following countries:LOCATION CHOICES – GLOBAL REGIONS, 2016 – 202112%10%CanadaChileChina8%IndiaJapanMexicoSouth KoreaSwitzerlandUnited Kingdom6%Organizations outside of the U.S. that have hiredor sponsored FTMBA Class of 2021 students:4%2%0%AsiaLatin America20162017EMEA20182019International Total20202021LOCATION CHOICE – U.S. REGIONSMid-Atlantic South Southwest Midwest 0.7%1.8%2.5%4.3%Southern California 40.4%Northeast 10.7%West (excluding California) 11.4%Northern California 21.8%10Bain & Company, Inc.BC World Pharm Co., Ltd.Boston Consulting Group, TheCYVSADaiwa Asset Management Co. Ltd.DeliverooExport-Import Bank of KoreaKorea Financial Telecommunications & Clearings InstituteKorea Securities DepositoryLandfair Capital AGMcKinsey & CompanyMeituan DianpingSouth Korea Ministry of Science & ICTSamsung C&T CorporationSamsung Global Strategy GroupSamsung Life InsuranceSECOM CO., LTD.Sony Pictures Entertainment Inc.University of Tokyo Edge Capital Partners
ANNUAL BASE SALARY 2SIGNING BONUS 2UNITED STATESCaliforniaPercent of Hires1MeanMedianPercent ReceivingSigning BonusRangeMeanMedianPercent ReceivingStock/Equity/Options2Range62.1% 137,000 137,500 80,000- 175,00067.2% 27,047 25,000 2,000- 65,00038.5%Southern40.4% 132,976 130,000 80,000- 175,00063.7% 26,208 25,000 5,000- 62,50020.4%Northern21.8% 144,495 147,500 95,000- 175,00073.8% 28,389 25,000 2,000- 65,00072.1%West (excluding California)11.4% 127,339 130,000 87,000- 190,00087.5% 39,036 40,000 15,000- 75,00065.6%Northeast10.7% 142,663 150,000 80,000- 175,00070.0% 32,881 30,000 5,000- 60,00016.7%Midwest4.3% 129,000 126,500 110,000- 165,00097.1% 33,636 35,000 15,000- 50,00025.0%Southwest2.5% 142,143 150,000 110,000- 165,00042.9% 34,167 30,000 25,000- 47,50014.3%South1.8% 118,250 116,500 115,000- 125,00080.0% 22,250 22,500 10,000- /A2N/A20.0%U.S. TOTAL93.5% 136,153 133,250 80,000- 190,00071.0% 29,944 30,000 2,000- 75,00037.8%10.0%LO C ATIO N B R EAK DOW NE MPLOYMEN T LO C AT I O N D ETAI L SINTERNATIONALAsia3.6% 113,183 120,000 31,650- 170,00050.0% 30,700 30,000 25,000- 40,000Central & South A2N/A2N/A2100.0%N/A2N/A2N/A20.0%INTERNATIONAL TOTAL5.4% 118,669 120,000 31,650- 175,00053.3% 30,181 29,250 13,950- 50,00013.3%DID NOT REPORT LOCATION11.1% Percentages were calculated from the number of students who accepted employment within three months after graduation.2 Compensation data is self-reported. Salary data provided for locations with fewer than four data points available.11
H IR IN G O RGAN IZ ATIO N S12CLASSES OF 2021 AND 2022 HIRING ORGANIZATIONSRECENT E M P LOY ER STh e fo l l ow i n g fi rm s h ave h i red a t l ea st ONE U CL A A nde rso n st ude nt during t he 2020-2021 scho o l ye ar (co mbining bo t h full-ti me empl oymen t a n d s u mmer i n ter n s h i ps):AA E NetworksAB InbevABL Space SystemsAccentureActive Apparel GroupAmerica LLCActivision / Blizzard Inc.Adobe Systems Inc.ADPAdvanced FarmsAirbus VenturesAllen & OveryAmazon StudiosAmazon, Inc.AmcorAMed VenturesAmgen Inc.Amyris, Inc.Analysis Group Inc.Anheuser-BuschAnonymous ContentApple IncArtisan PartnersAtlassianAtom & MatterAurora Capital PartnersAutodesk Inc.Avivar CapitalBBain & Company, Inc.Bank of America CorporationBarclaysBayWa r.e. Renewable EnergyBeijing Kaku Cartoon SatelliteTV Co. Ltd.Benedict Canyon EquitiesBevBig Fish Games, Inc.BitwardenBliss Point MediaBlizzard EntertainmentBlue Land PartnersBoehringer IngelheimBoston Consulting Group, The(BCG)Boxxie PartyBrightwood Capital AdvisorsBroadcom CorporationCCain BrothersCalzada Capital PartnersCanyon Partners Real EstateLLCCapital GroupCapital OneCapricorn Investment GroupCarusoCerebralChartis Group, TheChewy, Inc.Children’s Hospital of LosAngelesCIGNA Corp.CIM Group Inc.Cisco Systems, IncCitiClear Bridge, LLCClorox Company, TheCMR Capital GroupCognizant BusinessConsultingColgate-PalmoliveConstellation Brands, Inc.CoROSCourseraCreateMeCreative Artists Agency(CAA)Credit SuisseCrediversoCrosscut VenturesCure HydrationCyngnCypress Equity InvestmentsCYVSADDAFNA Capital ManagementDaring FoodsDaVita Inc.Daylight CommunityDevelopmentDeliverooDeloitteDelta Air LinesDiageoDigniFiDL Capital PartnersDocuSignDom Food GroupdotOrgDouble Helix OpticsDr. SquatchEE. & J. Gallo WineryEden HealthEdwards LifesciencesElectronic ArtsEmile LearningEnphase EnergyEpson America, Inc.Erewhon MarketESFDEsports OneEstée Lauder Companies, TheEV Connect, Inc.Evercore PartnersEVgoExperian HealthEY-ParthenonFFAB9Facebook, Inc.FarfetchFeature.fmFeinaki (Beijing) CulturalCommunication Co., Ltd.FilmlightFlexFood Is GoodFormativeFortive CorporationFTI ConsultingFunimationJanuary AIJefferies, LLCJohnson & Johnson CompanyJosh Bersin Academy, TheJPMorgan Chase & Co.Juna MediaGGartner Inc.Gemdale USA CorporationGenentech Inc.General MillsGoldman Sachs & Co.GoodRxGoogle Inc.Green Street AdvisorsGreystarGridiron CapitalGrupo OrfanoGuosen SecuritiesKK Fund Capital ManagementKarmaCheck Inc.Kelsey, TheKennedy WilsonKing’s Hawaiian Holding Co.,Inc.KPMG LLPKPOP Foods, Inc.HHBO MaxHiCap AltaHighway BenefitsHorizon TherapeuticsHoulihan LokeyHouseplantHuawei Technologies Co., Ltd.HuluIIA CollaborativeImperfect FoodsInfineon TechnologiesIntel CorporationIntuit Inc.Intuitive Surgical Inc.InvescoInvesco Real EstateIQVIAJJam City (Formerly SGNGames)LL.E.K. Consulting LLCLandfair Capital AGLatham & Watkins LLPLazard Freres & CO.LeadsOnlineLeonardo247Lincoln InternationalLionstone InvestmentsLogitechL’Oreal USALos Angeles RamsMMadison Square GardenEntertainment Corp.Marvista EntertainmentMattel Inc.McKinsey & CompanyMeituan DianpingMerck & Co.MetropolisMGM Resorts InternationalMicro Focus, Inc.Microsoft Corp.Million Dollar Baby Co.Mira HealthMoelis & CompanyMondelez International IncMoonshot BrandsMorgan StanleyMorpheus VenturesMotic USAMuse CapitalNNational GridNational Parks ServicenaviHealthNeuberger BermanNextEra Energy, Inc.Nike, Inc.Nile AI, Inc.North Island VenturesNorthrop GrummanCorporationNortonLifeLock Inc.NOVA InfrastructureNvidia CorporationOOndaOptiwattOptumOrange County Soccer ClubOvertime SportsPPaladin Realty Partners LLCPalm Tree, LLCParis Hilton EntertainmentPearlX InfrastructurePerch CreditPerspective Law GroupPing An Technology, PAICPiper Sandler (formerly knownas Piper Jaffray)Platypus AdvisorsPlayQPlexo CapitalPointCarePowerPlant VenturesPrecursor VenturesProcter & GambleProphetPurlinPwCQQatalyst PartnersQualtricsQuant Group, TheQuantime Inc.RRBC Capital MarketsRedflag AIReflekt SkincareRepublic ServicesResearch NarrativeResMedRexRightsTrade LLCRingCentralRiot GamesRivian Automotive LLCROBLOXRocana VenturesRokuRose Hill LLCRothschild & Co.SSalesforce.com, Inc.Samsung Global StrategyGroupScopelySEGA of AmericaSensei AgSerotoninServiceNowSilverstripe AdvisorsSitelogIQSkanskaSnap Inc.
Sony Interactive EntertainmentPlayStationSony Pictures Entertainment Inc.StarNews MobileStrandview CapitalStruumSumitomo Mitsui BankingCorporationSun Capital PartnersSurveyMonkeySwet TailorTTata Consultancy ServicesTeleo CapitalTempoTencentTenOneTen VenturesTerrafuse Inc.Terreno Realty CorporationTiaTillamook County CreameryAssociationTransom Consulting Group, LLCTreePeopleTubi TVTucker Tooley EntertainmentUUBSUCLA Anderson School ofManagementUCLA Fielding School of PublicHealthUnibail-Rodamco-WestfieldUpfulUTEC – The University of TokyoEdge Capital PartnersVVamosVenturesVerizonVerkadaViacomCBS11 more organizations hired UCLA Andersonfull-time MBA graduates and interns in 2020-2021than during the previous year.Visa Inc.VistaprintVMware Inc.WWalmart, Inc.Walt Disney Company, TheWarnerMediaWatertower VenturesWavefront DynamicsWayfairWedbush VenturesWells FargoWelltowerWestcove Partners, LLCWestern Asset ManagementCompanyWestern DigitalWhip Media GroupWhirlpool CorporationWilson Perumal & CompanyWilson Sonsini Goodrich & RosatiWindfall DataWisk AeroWonderful Company, TheWoodside CapitalXXepelinTO P H I R I N G F I R M SZZephyr PartnersZoomZS AssociatesThe following organizations have hired FIVE OR MORE full-time MBAstudents during the 2020-2021 recruiting season (combining bothfull-time employment and summer internships):20 OR MORE STUDENTS:10-14 STUDENTS:Amazon, Inc.Bank of America CorporationMicrosoft Corporation15-19 STUDENTS:Boston Consulting Group, TheDeloitteGoogle Inc.McKinsey & CompanyH IR IN G O RGAN IZ ATIO N S41.8% of all accepted offers for full-timeemployment and summer internships were bycompanies on our Top Hiring Firms list (see inset).5-9 STUDENTS:Adobe Systems Inc.Amgen, Inc.Bain & Company, Inc.Cisco Systems, Inc.CitiCredit SuisseCrediversoEpson America, Inc.EY-ParthenonFacebook, Inc.General MillsIntel CorporationIntuitive SurgicalMattel Inc.Nike, Inc.PwCThe Wonderful CompanyVMWare, Inc.Walmart, Inc.ZS Associates13
IN TER N S H IP C LASS P RO FILECLASS OF 2022 SUMMER INTERNSHIPSDEMOGRAPHIC PROFILEEMPLOYMENT PROFILETotal Applicant Pool . . . . . . . . . . . . . . . . . . . . . . . 2,862Number of Entering Class . . . . . . . . . . . . . . . . . . . 360Average Years of Work Experience . . . . . . . . . . . . 4.5Women . . . . . . . . . . . . . . . . . . . . . . . . . . . . . . . . . . . 40%U.S. Minorities . . . . . . . . . . . . . . . . . . . . . . . . . . . . . 30%International Citizens . . . . . . . . . . . . . . . . . . . . . . . 36%Countries Represented . . . . . . . . . . . . . . . . . . . . . . . 40PermanentU.S. WorkAuthorizationNon-PermanentNumberU.S. Workof StudentsAuthorizationPercentof TotalStudentsTotal Students26585 350 100.0%Seeking Employment25276 328 93.7%Not Seeking EmploymentSummer Internship ACCEPTS13251922 6.3%76 327 99.7%TOP PRE-MBA EXPERIENCE BY INDUSTRYEntertainment/Media 5%Real Estate 6%Healthcare 6%Technology 26%Public Sector/Nonprofit 10%Consumer Goods 10%Finance 22%Consulting 15%14
SOURCE OF INTERNSHIPCOMPENSATION SUMMARYPercent of StudentsReporting Salary Data1Monthly Base Salary93.2%Monthly Salary2MeanMedian 8,086 8,000Percent of Hires1RangeUCLA Anderson-Facilitated Resources . . . . . . . . . . . . . . . . . . . .70.7%Campus Recruiting Program (including myCareer Resume Collections) . . . . . . . . . . . . . . . .
FULL-TIME EMPLOYMENT. INDUSTRY SUMMARY. Class of 2021 Graduates started . their own companies during their . time at UCLA Anderson in the . following industries: Apparel. Digital Media. E-Commerce. Food and Beverage. Healthcare. Entertainment / Media. Technology. Venture Capital. INDUSTRY CHOICES, 2016 TO 2021. 2021 graduates joining the financial