Transcription
Elena Delavega, PhD, MSWAssistant ProfessorDepartment of Social WorkSchool of Urban Affairs andPublic Policy223 McCord HallMemphis, TN 281522015 Memphis Poverty Fact Sheet(Data from 2014 ACS)Who are the Memphis Poor?Memphis has a poverty rate of 29.8%. Child poverty is 46.9%, while poverty rates for people over age 65are the lowest at 14.5%. Poverty rates for Blacks are 34.4%, and 45.5% of Latinos are poor, while thepoverty rate among non-Hispanic Whites is 13.5%.The Poverty Rate in Memphis and ShelbyCounty Compared to National RatesIn general, poverty rates for the City of Memphis are higher than poverty rates in Shelby County forevery category. Both are higher than poverty rates in Tennessee, and Tennessee poverty rates arehigher than U.S. poverty rates in almost every category (racial and ethnic groups, and age groups). Theexception to this is the poverty rate for non-Hispanic Whites, which is lower in Shelby County thanelsewhere. However, poverty rates for non-Hispanic whites are higher in Memphis and Shelby Countythan in 2013.Table 1 – Diverse Poverty Rates in Memphis, Shelby County, Tennessee, and the United 3.5%Shelby United States15.5%22.7%14.6%2013 Poverty RateOverallUnder 1818-64Over % Elena Delavega, Department of Social Work, School of Urban Affairs and Public Policy, University of Memphis2015 Memphis Poverty Fact Sheet1
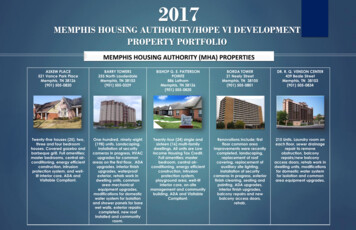
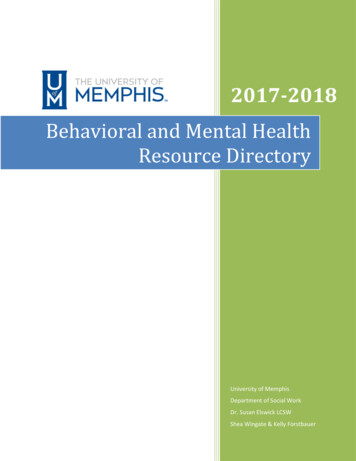
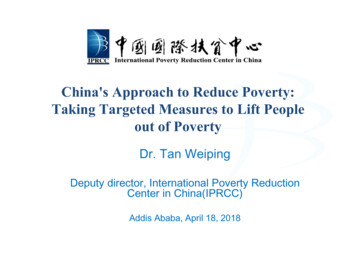
New in 2015Poverty has caught up with non-HispanicWhites. Poverty rates among the membersof this group have increased dramatically inboth Memphis and Shelby County.Figure 1 – Percent of the Population under PovertyNot-So-New in 2015For the second year in a row, while povertyrates have declined for the U.S., they haveincreased in Memphis, Shelby County, andTennessee.Poverty rates in Memphis and ShelbyCounty are higher than poverty rates forthe United States and for Tennessee.Good News for LatinosIn Memphis and Shelby County as in theUnited States as a whole, poverty ratesamong Latinos decreased. It is too early toconclude that this is a trend, however. Thismay indicate a positive trend, or it may justbe the result of a statistical anomaly.Chart by the author from data from the 2013 and 2014 ACS 1-Y Estimates (Tables C01001 and C17001), September 17, 2015.Figure 2 – Poverty Rates in 2013 and 2014 in Memphis and Shelby CountyChart by the author from data from the 2013 and 2014 ACS 1-Y Estimates (Tables C01001 and C17001), September 17, 2015. Elena Delavega, Department of Social Work, School of Urban Affairs and Public Policy, University of Memphis2015 Memphis Poverty Fact Sheet2
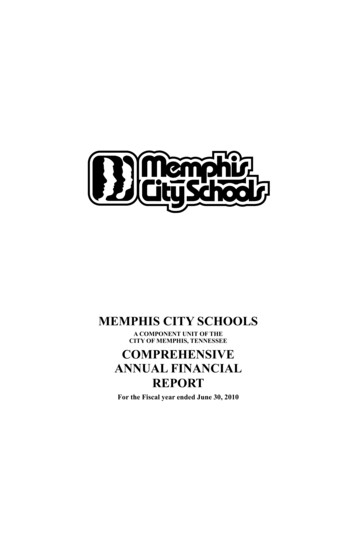
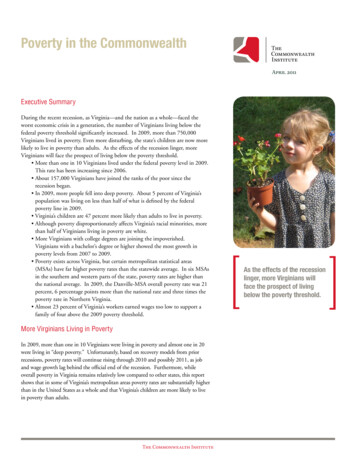
Figure 3 – Percent Change in Poverty RatesChart by the author from data from the 2013 and 2014 ACS 1-Y Estimates (Tables C01001 and C17001), September 17, 2015.Tables 2-4 – Poverty Rates by Age, Race, and LocationMemphis, TN-MS-AR Metro AreaAll Ages20.3%The Intersection ofAge and RaceAll Racesnon-Hispanic WhiteBlackLatinoThe Intersection ofAge and RaceAll Racesnon-Hispanic WhiteBlackLatinoUnder 1830.8%18-6465 34.4%45.5%Under 1818-6446.9%12.9%52.9%64.8%25.7%16.1%28.3%34.2%65 14.5%4.8%21.3%N/AAll Ages22.9%8.6%31.1%37.6%18.3%14.0%29.7%34.7%Under 1826.2%17.5%44.8%46.1%16.7%Under 1835.5%7.7%47.8%51.8%18-6465 20.0%10.3%25.5%29.0%10.6%3.7%19.3%N/AUnited StatesTennesseeAll Ages34.9%AsianShelby CountyMemphis CityAll AgesLatino18-6417.4%14.3%25.2%28.2%65 10.1%8.7%18.1%9.9%All Ages15.5%10.6%25.8%23.7%Under 1822.7%12.8%37.6%31.6%18-6465 14.6%10.9%22.4%19.9% Elena Delavega, Department of Social Work, School of Urban Affairs and Public Policy, University of Memphis2015 Memphis Poverty Fact Sheet9.5%7.1%17.1%19.1%3
Poverty RankingsIn 2014, Memphis retained the unfortunate top spot in both overall and child (under 18) poverty ratesamong Metropolitan Statistical Areas (MSA) with populations greater than 1,000,000, a rather unsavoryachievement. When including MSA with populations greater than 500,000, Memphis has shown anincrease in overall poverty rates, moving from fourth place to third. Worse still, even as child povertyrates continue to decline at the national level, the child poverty rate in Memphis has increased.Memphis appears to have lost ground in every case, getting closer to the first spot in every demographiccategory (cities over 500,000, MSA over 500,000, and MSA over 1,000,000).The rank number denotes the position of a city or MSA relative to others. The higher the rank number,the higher the poverty rate for that locality. In other words, a higher ranking is not desirable. Rankchange denotes the number of “spots” a city or MSA has moved up or down in the rankings.Table 5 – Memphis’ Rank in Poverty Rates2013MemphisAmong Cities with PopulationsGreater than 500,000 (34 Cities)Among MSA with PopulationsGreater than 500,000 (104 MSA)Among MSA with PopulationsGreater than 1,000,000 (52 MSA)PovertyRateOverallUnder 18OverallUnder 18OverallUnder erty .8%PovertyRankRankChange% 0.7%326511Table 6 – Highest Poverty Rates in Cities and MSA in the United StatesHighest Poverty RatesRank 12013Rank 1Among Cities withPopulations Greater than500,000 (34 Cities)OverallDetroit city, MichiganUnder 18Among MSA withPopulations Greater than500,000 (104 MSA)OverallAmong MSA withPopulations Greater than1,000,000 52 MSA)OverallDetroit City, MichiganMcAllen-EdinburgMission, TX Metro AreaMcAllen-EdinburgMission, TX Metro AreaMemphis, TN-MS-ARMetro AreaMemphis, TN-MS-ARMetro AreaUnder 18Under ertyRateRankChangeDetroit city, Michigan39.3%-----3.4%Detroit City, MichiganMcAllen-EdinburgMission, TX Metro AreaMcAllen-EdinburgMission, TX Metro AreaMemphis, TN-MS-ARMetro AreaMemphis, TN-MS-ARMetro --2.5%30.8%----0.7%Rank 1 Elena Delavega, Department of Social Work, School of Urban Affairs and Public Policy, University of Memphis2015 Memphis Poverty Fact Sheet4%Change
What the Rankings MeanThe cities and MSA that ranked first in overall and child (under 18) poverty rates retained their dubiousfirst places. However, poverty rates in general did not increase or decrease. The exception was the child(under 18) poverty rate in the Memphis MSA (among MSA with populations over 1,000,000), whichincreased 3% from 2012 to 2013, a disheartening fact given the direction of other poverty rates.Memphis Has the Highest PovertyRates, But Not for EveryoneThe Relationship between Poverty and RaceIt has now been observed for several years that the poverty rate among non-Hispanic Whites only ismuch lower in Shelby County than in the state or the nation as a whole. Although in 2014 the povertyrate for non-Hispanic Whites increased both in Memphis and Shelby County, the poverty rate for thisgroup continues to be lower in Shelby County than in the rest of the nation. It is important to note,however, that the poverty rate for this group is also bucking the national trend and increasing. Povertyrates for Blacks and Latinos are dropping nationwide even as they have increased in Tennessee.The poor in Memphis tend to be minorities. The poverty rates for Blacks and Latino are higher than theoverall poverty rate, and poverty rates for minorities are higher in every age category than poverty ratesfor non-Hispanic Whites. Moreover, poverty rates for non-Hispanic Whites are lower in Memphis andShelby County than in Tennessee as a whole or the United States in every age category.Table 7 – Comparison of Poverty Rates and Poverty Trends for non-Hispanic Whites Only and BlacksOnlyMemphisnon-Hispanic Whites OnlyAmong Cities with Populations Greater than 500,000(34 Cities)Among MSA with Populations Greater than 500,000(104 MSA)Among MSA with Populations Greater than 1,000,000(52 MSA)2014OverallPoverty RateOverallPoverty Ranknon-HispanicWhitePoverty Ratenon-HispanicWhitePoverty 5ndIt is very interesting to note that while Memphis ranks first among large metro areas (population greaterthan 1,000,000), when the poverty rate for non-Hispanic Whites is considered by itself, Memphis ranksmuch lower. The differences between the poverty rates of minority groups and non-Hispanic Whites arestriking. Elena Delavega, Department of Social Work, School of Urban Affairs and Public Policy, University of Memphis2015 Memphis Poverty Fact Sheet5
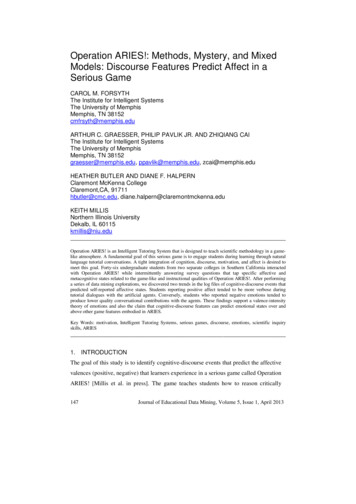
Figures 4-5 – Comparison of Poverty Rates and Poverty Trends for non-Hispanic Whites Only andBlacks OnlyChart by the author from data from the 2012 ACS 1-Y Estimates, September 30, 2013.Chart by the author from data from the 2012 ACS 1-Y Estimates, September 30, 2013.Trends in Poverty RatesThe poverty rates for non-Hispanic Whites are better in Memphis and Shelby County than for the samegroup in Tennessee or the United States, while the rates for Blacks are worse. It is also interesting tonote that for non-Hispanic Whites, the worst poverty rates are at the state level. A caveat for 2014 isthat poverty rates for non-Hispanic Whites in Memphis are much higher than in 2013, although it is tooearly to tell if the increase means anything.Poverty Trends – Has Poverty Gotten Worse?Since 2005, poverty rates in Memphis have risen and the 2008 economic crisis resulted in increasedpoverty rates for all racial and age groups at that time. It is important to note that some groups wereable to recover much sooner. Note that poverty rates among people over age 65 are lower than for therest of the population. This is attributed to Social Security. In 2012 there was an increase in the povertyrate for people over 65. Given 2014 figures, the hopeful decrease in poverty among senior Americansappears to have reversed itself.The Widening GapSince their highest point in 2009, poverty rates for non-Hispanic Whites alone have decreased in everyage category (although elevated in 2014, this may be a statistical anomaly), but poverty rates for Blacksand Latinos have remained high and the increase in the poverty rate for Latinos appears to haveaccelerated. A decline in the poverty rate for Latinos observed in the 2011 ACS is now attributed to astatistical anomaly. An interesting observation is that poverty rates among non-Hispanic Whites are nowmuch lower in Memphis and Shelby County than in the state or the nation as a whole. This relationshipis not expected.Minorities suffer greater rates ofpoverty than non-Hispanic Whites inMemphis and Shelby County Elena Delavega, Department of Social Work, School of Urban Affairs and Public Policy, University of Memphis2015 Memphis Poverty Fact Sheet6
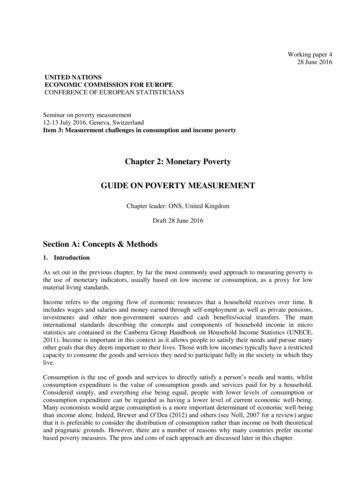
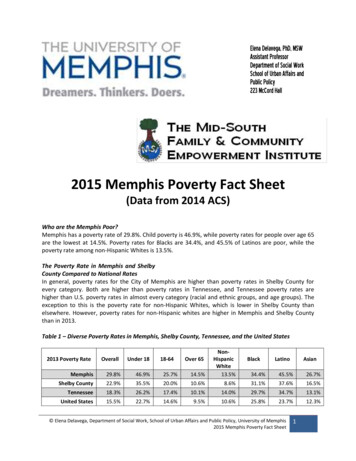
Figure 6 – Trends in Poverty Rates by Age, MemphisChart by the author from data from the 2005, 2006, 2007, 2008, 2009, 2010, 2011, 2012, 2013, and 2014 ACS 1-Y Estimates and ACS 3-Y Estimates, September 30, 2013to September 17, 2015.Figure 7 – Trends in Poverty Rates by Age, Shelby CountyChart by the author from data from the 2005, 2006, 2007, 2008, 2009, 2010, 2011, 2012, 2013, and 2014 ACS 1-Y Estimates and ACS 3-Y Estimates, September 30, 2013to September 17, 2015.Children continue suffering the greatestrates of poverty Elena Delavega, Department of Social Work, School of Urban Affairs and Public Policy, University of Memphis2015 Memphis Poverty Fact Sheet7
Figure 8 – Trends in Poverty Rates by Race, MemphisChart by the author from data from the 2005, 2006, 2007, 2008, 2009, 2010, 2011, 2012, 2013, and 2014 ACS 1-Y Estimates and ACS 3-Y Estimates, September 30, 2013to September 17, 2015.Figure 9 – Trends in Poverty Rates by Race, Shelby CountyChart by the author from data from the 2005, 2006, 2007, 2008, 2009, 2010, 2011, 2012, 2013, and 2014 ACS 1-Y Estimates and ACS 3-Y Estimates, September 30, 2013to September 17, 2015.It is too early to tell whether we aremoving toward racial equality. Elena Delavega, Department of Social Work, School of Urban Affairs and Public Policy, University of Memphis2015 Memphis Poverty Fact Sheet8
The Department of Social Work in the School of Urban Affairs and Public Policy at the University of Memphis isdedicated to understanding poverty and its causes through research and engaged scholarship. Our purpose is toidentify the most effective ways to eliminate poverty and promote social and economic development for our region.If you would like more information on Memphis poverty, please contact Dr. Elena Delavega atmdlavega@memphis.eduSources:Data obtained from the US Bureau of the Census, September 17, 2015All Data except Latino (Hispanic): 2013 and 2014 ACS 1-Y Estimates (Table S1701: Poverty Status in the Past 12 Months. Other Tables: DP03,C01001); 2005, 2006, 2007, 2008, 2009, 2009, 2011, & 2012 American Community Survey 1-Year Estimates (US Bureau of the Census)Latino (Hispanic) Data: 2007, 2008, 2009, 2010, & 2011 American Community Survey 3-Year Estimates (US Bureau of the Census). Elena Delavega, Department of Social Work, School of Urban Affairs and Public Policy, University of Memphis2015 Memphis Poverty Fact Sheet9
It is very interesting to note that while Memphis ranks first among large metro areas (population greater than 1,000,000), when the poverty rate for non-Hispanic Whites is considered by itself, Memphis ranks