Transcription
RESEARCH FOUNDATION2019 OPERATING PLANMay 8, 2018
Research Foundation 2019 Operating PlanTable of ContentsExecutive Summary . 3Implementing RF Strategy in FY 2019. 4Funding the FY 2019 Operating Plan . 5Campus Activity . 6Agency Activity . 7Corporate Reserve . 8Investment Income and Undistributed Investment Income . 8Fringe Pool . 9Central Office Budget . 10Sponsored Program Revenue Projections. 11Projected Campus Administrative Cost Assessment for FY 2019 . 12Glossary . 132 P a g e
Research Foundation 2019 Operating PlanExecutive SummaryThe RF issues an annual Operating Plan that presents our operating roadmap and budget for the fiscal year, incompliance with our 1977 Agreement with SUNY. The following is the RF Operating Plan for Fiscal Year 2019 (FY2019).We move into FY 2019 guided by the four themes of Chancellor Kristina M. Johnson’s vision for SUNY: Innovationand Entrepreneurship, Individualized Education, Sustainability, and Partnerships.Our FY 2019 Operating Plan and our strategies for the years ahead mobilize the organization to reduce theadministrative burden on faculty and effectively and cost-efficiently serve our campuses.GoalsWe have set our course with three goals: Provide Superior Service: We will meet principal investigator needs and exceed sponsor expectations byempowering our people, recognizing and rewarding service, and acting on input.Be Effective: We will do the right work that adds value to our campuses and principal investigators,measuring RF outcomes and impact.Increase Cost Efficiency: We will streamline processes and cut costs, ensuring that the RF enterprise isas lean as it can be, without compromising quality.Plan HighlightsThe major focus of this FY 2019 Operating Plan is to reach clarity on the roles and responsibilities of SUNY, RF,and our campuses as they relate to the business and operation of research administration, together with the truecost of this activity across SUNY. We will develop individual campus profiles and risk assessments which willprovide valuable guidance, and we will follow four strategies in pursuit of our goals: Empower: Empower individuals with knowledge, authority, and tools to solve problems at the point ofservice.Build: Build on organizational strengths: flexibility, scale, internal controls, core functions, customer servicefocus, and dedicated, competent people across the enterprise with deep institutional knowledge.Improve: Remove administrative layers and barriers to principal investigator success through a disciplineof measurable continuous improvement.Partner: Tailor research administration processes to accommodate new and different types ofpartnerships, especially with industry and private foundations.BudgetThis year’s plan achieves a 10% reduction in the Central Office budget from FY 2018. These savings are realizedthrough shared services and holding tight headcount and salaries in the wake of the FY 2018 Voluntary RetirementProgram, with a commitment to retain, retrain, and redeploy remaining staff.3 P a g e
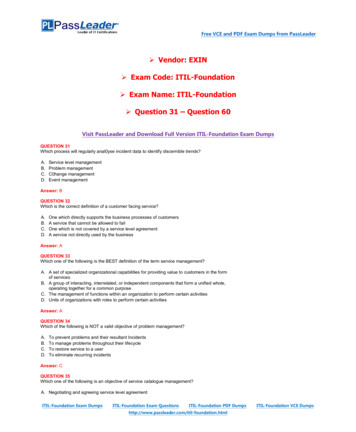
Research Foundation 2019 Operating PlanNewDollars 1.3millionImplementing RF Strategy in FY EREmpower individuals withknowledge, authority, andtools to solve problems at thepoint of service.Build on organizationalstrengths: flexibility, scale,internal controls, core functions,customer service focus, anddedicated, competent peopleacross the enterprise with deepinstitutional knowledge.1. Evolve stakeholder groups toCommunities of Practice(CoPs) across the enterpriseto promote benchmarking andbest practices within andacross research administrationcommunities (e.g., SPMC,UCRC, HRO, TTD).Remove administrativelayers and barriers toPrincipal Investigatorsuccess through adiscipline of measurablecontinuous improvement.Tailor researchadministration processes toaccommodate new anddifferent types ofpartnerships, especially withindustry and privatefoundations.1. Pilot an EnterpriseConsulting model atUniversity at Buffalo.2. Implement automatedsolutions and streamlinepolicies and procedures toimprove efficiency, reducecosts, and promotepaperless transactions.2. Create Communities ofPractice for: 1.) startupdevelopment and 2.) researchbased business development.1. Conduct ten processimprovement projectsemploying the “RapidCycle Change” method.2. Pilot pre-awardCustomer Discovery atfive locations.2. Conduct a strategicassessment of RFenterprise-wide IP portfoliofor bundling, enforcement,and monetizationopportunities.3. Develop new methods ofcosting and communicationfor nonfederal sponsors.3. Implement new Post-DoctoralAssociate Fringe Benefit Rate.Full descriptions, budgets, and status for Operating Plan work is available on the website at: www.rfsuny.org/projects4 P a g ePACSRollover 470KDevelop a living RF operations profile and risk assessment for each campus to clarify roles and responsibilities,and detail expenditures, effective F&A recovery, staffing, and agency and affiliate activity.1. Hold a ResearchAdministrators’ Symposiumfor learning anddevelopment, networking,and recognition.ActivitiesFY 2018Rollover 450K
Research Foundation 2019 Operating PlanFunding the FY 2019 Operating PlanThe following table presents the campus research and agency revenue for each of the periods presented. Projectedamounts are primarily based on campus estimates.Campus ActivityGrants and Contracts Direct Costs805.02018Estimate(in millions)692.4723.2Grants and Contracts Indirect Costs134.9133.2137.1138.5Investment Income (gross)15.210.08.911.8Other Campus Activity 5184.8177.67.67.47.87.4Total Agency Activity203.5207.9192.6185.0Total All Activity1193.21065.71088.41105.42017 ActualTotal Campus ActivityAgency ActivityAgency Services Direct CostsAgency Services Indirect Costs2018 Plan2019 Plan750.6The following table presents the corporate chargebacks to the campuses to fund the Operating Plan.2017 ActualCorporate ChargebacksCentral Office Cost Allocation2018Estimate(in millions)2018 Plan2019 Plan24.224.521.222.2SUNY Strategic Plan Assessment2.52.52.52.5Agency Services Cost Allocation3.13.23.02.8Campus Initiatives1.31.41.41.331.131.628.128.8Investment Advisory & TreasuryOperations (funded by investment income)0.70.70.70.5Corporate Reserve (funded by investment0.00.00.00.031.832.328.829.3Total Campus Cost Allocationincome)Total Corporate Chargebacks5 P a g e
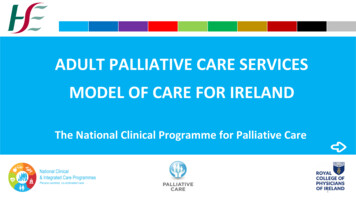
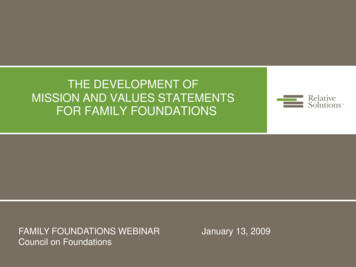
Research Foundation Fiscal Year 2019 Operating PlanCampus ActivityCampus activity consists of grants and contracts direct and indirect costs, investment income, and income fromother campus activity such as royalty income, equity distributions, and fees paid by third party service centers.Campuses project grants and contracts direct and indirect costs by sponsor type. See below for sponsored programrevenue by sponsor type. See page 11 for sponsored program revenue by campus.Direct and Indirect Activity by Sponsor TypeTotal Sponsored Program Revenue by Sponsor TypeFY 2012 ‐ 2019Chart Title(in 123939,899535,473281,966277,402180,917181,740FY 2012 18237,716163,119FY 2013 Act.Federal6 P a g e860,256102,730FY 2014 Act.FY 2015 Act.State and Local150,389FY 2016 Act.122,460FY 2017 Act. FY 2018 Proj. FY 2019 Proj.Private/OtherTotal
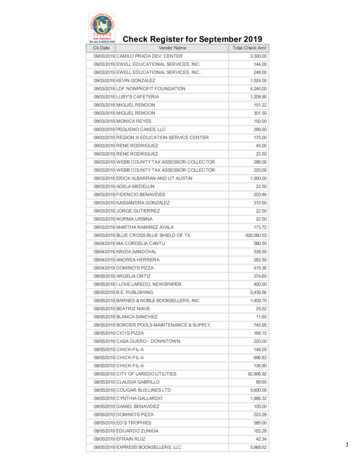
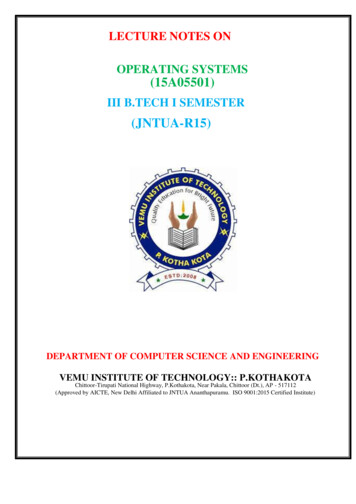
Research Foundation Fiscal Year 2019 Operating PlanAgency ActivityWith systems already in place to support sponsored programs, the RF generates funds by providing agencyservices to campus-related organizations. Agency services include human resources, payroll, and purchasingservices provided to clinical practice plans, outpatient facilities, affiliated health care facilities, and campus-basedfoundations. Examples of campus related organizations are Stony Brook’s Clinical Practice Management Plan(CPMP) and the Binghamton University Foundation. Campuses project agency services direct and indirect activityby source of funds.Total Agency (Direct & Indirect) Revenue by 1FY 2012 ‐ 2019Chart Title(in 028177,6217,407FY 2012 Act. FY 2013 Act. FY 2014 Act. FY 2015 Act. FY 2016 Act. FY 2017 Act. FY 2018 Proj. FY 2019 Proj.Agency Direct7 P a g eAgency IndirectTotal
Research Foundation Fiscal Year 2019 Operating PlanCorporate ReserveThe following table shows the activity related to the corporate reserve:Corporate Reserve (in thousands)Opening balanceAllocable from undistributed investmentincome ending balanceEnding balance2018Estimated 9,4542019Projected 9,45400 9,454 9,454Investment Income and Undistributed Investment IncomeThe following tables show the projected activity related to investment income and the undistributed investmentincome balance:Investment Income(in thousands)Investment incomeTreasury/investment expensesNet investment incomeFunding to corporate reserveFunding to campus initiativesTo undistributed investment income2018Estimated 8,868(488)8,38000 8,3802019Projected 11,796(522)11,27400 11,274Undistributed Investment Income(in thousands)Opening balanceInterest charge to campusesFunding from investment incomeEnding balance2018Estimated 18,9318,3328,380 35,6432019Projected 35,6435,75311,274 52,6708 P a g e
Research Foundation Fiscal Year 2019 Operating PlanFringe PoolThe RF recovers the funds needed for the cost of employee fringe benefit programs, which include healthinsurance, retirement, Social Security, and other costs, by applying fringe benefit rates to accounts that fundemployee salaries and wages. Included within the other costs charged to the fringe benefit pool are 1.4 millionincurred by the RF Central Office to administer and provide additional fringe benefits. These rates are negotiatedeach year with the U.S. Department of Health and Human 15.50PostDoctoralEmployees****25.0025.0025.00* The 2020 rate is a provisional rate and the 2021 and 2022 rates are projections for budgeting purposes only.** New rate beginning in 2020.9 P a g e
Research Foundation Fiscal Year 2019 Operating PlanCentral Office BudgetWhat is Central Office?The RF Central Office exists to support SUNY faculty, staff, and students at 30 SUNY campus locations as well asprograms around the world. Staff at Central Office provide the administrative, legal, financial, regulatory, andtechnical infrastructure required to manage sponsored programs and technology transfer that otherwise would haveto be performed at individual sites, necessitating additional FTEs, equipment, tools, and systems at each location.Funding Central OfficeThe following tables provide a reconciliation of the Corporate Chargebacks per the Operating Plan to the funding ofthe Central Office budget. The surplus is to address contingencies, partially fund the transition to a new assessmentmodel, or be returned to the campuses.32.32018Estimate(in .00.00.029.125.626.32018 PlanFunding of Central Office BudgetCorporate ChargebacksSUNY Strategic Plan AssessmentInvestment Advisory & TreasuryOperations (funded by investment income)Corporate ReserveExternal BorrowingTotal2018 PlanCentral Office Budget ExpensesSalaries (including Fringe and net ofreimbursements)Campus Initiatives and ExternalBorrowingIT (outsource and pass thru)2018Estimate(in millions)2019 Plan29.32019 0.8Insurance/Fees1.11.11.2Other Costs2.11.91.629.125.326.30.00.30.0TotalSurplus / (Deficit)10 P a g e
Research Foundation Fiscal Year 2019 Operating PlanSponsored Program Revenue ProjectionsProjectionsActualCampus Name11 P a g e20122013201420152016201720182019University at AlbanySUNY Polytechnic Institute (CNSE)Binghamton UniversityUniversity at BuffaloStony Brook UniversitySUNY Downstate Medical CenterUpstate Medical UniversitySUNY BrockportBuffalo State CollegeSUNY CortlandSUNY FredoniaSUNY GeneseoOld WestburySUNY New PaltzCollege at OneontaSUNY OswegoSUNY PlattsburghSUNY PotsdamPurchase CollegeSUNY Polytechnic Institute (SUNYIT)Empire State CollegeAlfred State CollegeSUNY CantonSUNY CobleskillSUNY DelhiFarmingdale State CollegeMorrisville State CollegeSUNY ESFMaritime CollegeCollege of OptometrySys. Admin - Provost 106,885,405 87,376,569 89,065,519 80,774,763 89,272,408 102,993,269 ,90291,204,104 0024,210,000Grand Total 930,160,728 983,229,277 1,003,875,997 899,299,704 920,270,746 939,898,996 860,255,587 889,174,538
Projected Campus Administrative Cost Assessment for FY 2019Sponsored Program Revenues, Distributed Investment Income, Royalty, LLC, Gift and OthersAssessment base weighted average revenue FY2016 - 20%; FY2017 - 30% and FY2018 - 50%Weighted Ave. FY16-18Sponsored Program,Invest Inc Dist, rvicesCostLLC & Gift Income2.33%1.0%AllocationCampusBudget Based Assessment ModelTotal CampusSystem-Wide rollServicesFY 2019Centralized ePayablesProjectedTTORebateBudget BasedServicesRevenueAssessmentUniversity Centers and DoctoralDegree Granting Institutions 752,971,984 17,544,247 185,802 2,610,615 686,100 1,549 36,476 (154,402) ,910University CollegesSUNY BrockportBuffalo State CollegeSUNY CortlandSUNY FredoniaSUNY GeneseoSUNY New PaltzOld WestburyCollege at OneontaSUNY OswegoSUNY PlattsburghSUNY PotsdamPurchase CollegeEmpire State ,32758,555Technology CollegesAlfred State CollegeSUNY CantonSUNY CobleskillSUNY DelhiFarmingdale State CollegeMorrisville State CollegeSUNY POLY - SUNYITMaritime 17292,29711,221195,65446,62629,90322,969SUNY System AdministrationSys. Admin - ,279University at AlbanySUNY POLY - CNSEBinghamton UniversityUniversity at BuffaloStony Brook UniversitySUNY Downstate Medical CenterUpstate Medical UniversitySUNY ESFCollege of OptometryGrand Total12 P a g e 846,898,630 19,732,738 -690,702 2,761,977 2,258,916 2,540,696 22,599,580 730,340 1,201,309 25,726,113 821,443 1,380,850 789,608 14,408 245,448 (197,338) 28,780,532
Research Foundation Fiscal Year 2019 Operating PlanGlossaryAgency Services Direct CostsCampus-related organizations using RF human resources, payroll, and purchasing services (for example,clinical practice plans and campus-based foundations).Corporate ChargebacksIn fulfilling its responsibilities, the RF charges the campuses for the services it provides through either anassessment formula, allocation of costs, or direct offset to investment income.Corporate ReserveThe RF maintains and periodically funds a corporate reserve to provide additional liquidity to cover cashflow and contingencies.Fees Paid by Third Parties for Service CentersThe RF recovers costs from businesses and industries using RF-owned facilities, such as an MRI facility ornanotechnology clean room.Grants and Contracts Direct CostsGrants and contracts to faculty researchers and scholars provide direct dollars for expenditures that can beidentified with a particular sponsored project. Examples include salaries, supplies, equipment, and travel.Grants and Contracts Indirect CostsGrants and contracts to faculty researchers and scholars provide indirect costs for overhead, or “facilitiesand administrative” costs. Cost recoveries come in the form of reimbursements by sponsors for things thatcannot be directly and uniquely assigned to any particular project such as utilities and libraries.Investment IncomeInvestment income is projected based upon an assumed average investment balance and a targeted longterm investment return.Royalties from LicenseesIntellectual property commercialization generates royalties from companies that have licensed RF-ownedintellectual property.Royalties Paid to InventorsThe SUNY Patent Policy dictates that 40-45% of royalties be paid to the inventor of intellectual property.SUNY Strategic Plan AssessmentSUNY System Administration receives a formula-based allocation that may be used in support of itsstrategic plan.13 P a g e
Agency Activity Agency Services Direct Costs 195.9 200.5 184.8 177.6 Agency Services Indirect Costs 7.6 7.4 7.8 7.4 Total Agency Activity 203.5 207.9 192.6 185.0 Total All Activity 1193.2 1065.7 1088.4 1105.4 The following table presents the corporate chargebacks to the campuses to fund the Operating Plan.