Transcription
SAFETY METRICSPeer-ReviewedEXPERIENCEMODIFICATIONRATEas a PrequalificationCriterion for SafetyPerformanceBy Ahmed Jalil Al-Bayati, Kevin O’Barr, SungJoon Suk, Alex Albert and Jarred ChappellTTHE PREQUALIFICATION PROCESS is often used byhiring firms to evaluate the ability of contractorsto execute the work successfully (Truitt, 2012).Considering safety performance as one of the prequalification standards is essential to ensure that anacceptable level of safety performance is achieved(Tappura, Sievänen, Heikkilä et al., 2015; Truitt,2012). Generally, firms with satisfactory safety performance records have a well-defined procedure toidentify and eliminate possible hazards in the workplace to minimize work-related incidents (Huang &Hinze, 2006). These firms are expected to achievesuperior safety performance with a lower likelihoodof work-related incidents (Brahmasrene & Smith,2008). The likelihood positively impacts budget,completion time, work quality and reputation (Abu-KEY TAKEAWAYSZONECREATIVE/ISTOCK/GETTY IMAGES PLUSExperience modification rate (EMR) is commonly used as a pre qualificationcriterion to assess the capabilities of bidders in ensuring workplace safety.This study investigates factors that contribute to firms’ EMR to evaluatethe reliability and validity of EMR as a safety prequalifi-cation criterion. The survey results strongly suggest that severalnon-safety-related factors contribute to EMR such as firm size interms of the number of employees and post-injury management.Accordingly, utilizing EMR as a prequalification criterion withoutconsidering the contributing factors may not be reliable. Thus, theauthors suggest recommendations and best practices to help therecruitment of safe firms and to guarantee that EMR is utilized appropriately by safety personnel. dayyeh, Fredericks, Butt et al., 2006; Jallon, Imbeau& de Marcellis-Warin, 2011; Ladewski & Al-Bayati,2019; Votano & Sunindijo, 2014).As a result, national and international agenciessuch as American Society of Civil Engineers (ASCE)and U.K.’s Health and Safety Executive (HSE) havesuggested the adoption of specific safety best practices to ensure superior safety performance (Liang,Zhang & Su, 2018). However, the proposed bestpractices have been designed to be used internallywithin organizations, and hiring firms (e.g., generalcontractors) often do not have access to the information. Consequently, hiring firms have limitedcapability to evaluate the overall safety performanceof bidders. Written safety programs and experience modification rate (EMR) have been suggestedas prequalification criteria (Alzahrani & Emsley,2013). There is a positive correlation between safetyperformance and the implementation of the well-established safety program (Gilkey, del Puerto, Keefeet al., 2012). However, it is difficult to assess the leveland quality with which firms execute and enforcethe safety plan on the basis of a written program;Wilbanks (2018) suggests that utilizing written safety programs as a prequalification is questionable,which leaves EMR as the most reliable prequalification criterion. EMR popularity and acceptance as aprequalification criterion have increased rapidly inrecent years (Clayton, 2016).EMR is a numeric representation that indicates theamount of money a firm has spent on work-relatedassp.org JULY 2020 PROFESSIONAL SAFETY PSJ 31
incidents against the average spending by similar firms (i.e.,dividing actual losses by expected losses). EMR is determined based on the injury claims for previous years that donot include the most recent year and essentially providesincentives for firms with good safety performance (Brahmasrene & Smith, 2008; Everett & Thompson, 1995; Hinze,Bren & Piepho, 1995; Hoonakker, Loushine, Carayon et al.2005; Rouse, 1997; Taggart & Carter, 1999). For example,if an employer’s EMR is below 1.0, firms using EMR as aprequalification criterion would consider the employersafer than the average. Similarly, an employer with an EMRgreater than 1.0 is considered riskier and must pay a higherpremium. For example, a firm with a 1.10 EMR needs topay a 10% additional premium, while a firm with a 0.85EMR receives a 15% premium credit.EMR has been considered a well-established incentivemechanism based on firms’ safety performance (Al-Bayati,Albert & Ford, 2019; de la Garza, Hancher & Decker, 1998;Hatush & Skitmore, 1997; Imriyas, Low, Teo et al., 2008).Thus, EMR has been one of the practical indicators thatare often used to measure safety performance (de la Garza, Hancher & Decker, 1998; Hinze, Thurman & Wehle,2013; Jaselskis, Anderson & Russell, 1996; Ng, Cheng &Skitmore, 2005; Votano & Sunindijo, 2014). Abudayyeh etal. (2006) found a positive relationship between EMR andmanagement commitment to safety. Similarly, Al-Bayati etal. (2019) found a negative correlation between construction safety culture and EMR. Alzahrani and Emsley (2013)concluded that EMR is a critical indicator of successfulsafety and health performance that promotes the completion of a project without major incidents.However, EMR has never been intended to act as a qualification criterion. It is designed as a tool for insurance carriersto adequately recoup costs on future premiums. Therefore,utilizing EMR as a tool to evaluate the recent safety practicesof an employer should be carefully examined. Specifically,EMR does not adequately depict what firms have done tocorrect unsafe conditions after any incident has occurred.In addition, EMR is based on a no-fault instrument wherebythe employer is responsible for the injury regardless of theinjury’s cause and circumstances. For example, if an employee is injured in an auto incident while at work, the employer’s workers’ compensation will be the primary payer on thatinjury, even if the other driver may have been at fault. Thiswould impact EMR without consideration of its nature evenif it is not the fault of the employer, which would cause aninaccurate depiction of firms’ safety performance.EMR CalculationsThere are a few differences in EMR calculation betweenstates due to the fact that states manage workers’ compensation differently. Most states have designated NationalCouncil on Compensation Insurance (NCCI) as theirlicensed rating and statistical organization. However, theresearch presented in this article was based entirely inone state, North Carolina, which utilizes an independentlicensed bureau for rating and statistics. Thus, the calculation examples presented in this section may differ slightlyin a different state or region.There are two types of claims in the EMR world: 1)medical-only claims, which resulted in job restrictionor transfer; and 2) temporary or permanent disability32 PSJ PROFESSIONAL SAFETY JULY 2020 assp.orgclaims, which resulted in days away from work. A medical-only claim means that the injured employee willreceive medical attention, but will return to work withoutany indemnity payments (i.e., lost wages). Generally, indemnity payments do not start until after the 7th day ofmissed work. For medical-only claims, only 30% of theclaim’s amount counts against the employer, while thefull dollar amount of temporary or permanent disabilityclaims counts in the EMR calculation.For example, identical firms A and B experienced twoincidents that cost 10,000 each. However, firm A broughtthe injured employee back to perform light-duty work thenext day, while firm B did not. In this case, for firm A, the 10,000 claim would only count on the EMR as a 3,000claim (i.e., 30%). The EMR would only increase by roughly0.01 points and costs the employer about 3,000 over 3years in additional premium. On the other hand, for firmB, the 10,000 claim would count on the EMR as a 10,000claim since it resulted in 1 day’s worth of lost wages. Basedon the North Carolina system, firm B’s EMR goes up byroughly 0.05 points, and the firm will pay 10,000 over the3 years. Thus, two identical claims concerning the cost (i.e., 10,000) have a different impact on EMR values. The difference in the impact is due to the differences in the claimseverity and management practices.The second important factor that contributes to theEMR calculation is the actual primary losses (APL). TheAPL value is the first 16,500 paid out on a claim in thestate of North Carolina. The APL is weighted more heavily in the EMR calculation than the rest of the claim paidout after the first 16,500. For example, if firm A had one 33,000 claim, it would show on the EMR as 16,500 inthe APL. On the other hand, if firm B had two claimsof 16,500 each, it would show on the EMR as 33,000in APL. Thus, even though the total value of the actualclaims for the two firms is identical, firm B would be penalized more harshly due to the higher primary losses.Thus, the contributing factor in this scenario is the frequency of cases with values equal to or higher than APL.However, if firm B accommodated light-duty work forthe two injured employees, then the total APL would be 9,900 (i.e., 16,500 x 30% x 2), which is less than the totalAPL of firm A.Finally, the EMR calculation is more forgiving forlarger firms. For example, firm A has 200,000 in payrollannually (e.g., five workers) with an expected loss rate of5%. This means that firm A is expected to have 10,000 inclaims in a year. On the other hand, firm B has 2,000,000in payroll annually (e.g., 50 workers) with a class codesimilar to firm A (i.e., an expected loss rate of 5%). Thismeans that firm B is expected to have 100,000 in claimsin a year. Therefore, if both firms had a claim during ayear that paid out 20,000 (all else being equal), then firmA has doubled its expected loss rate, while firm B is onlyat one-fifth of its expected loss rate. In this scenario, firmA would end up with an EMR higher than firm B.These examples indicate that several non-safety-relatedfactors contribute to EMR. These factors have not beenfully explored in previous studies such as Abudayyeh etal. (2006), Everett and Thompson (1995), and Hinze et al.(1995). Thus, there is a need to understand these and otherfactors to assess the validity and reliability of using EMR
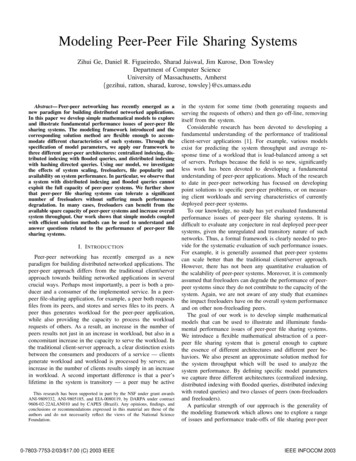
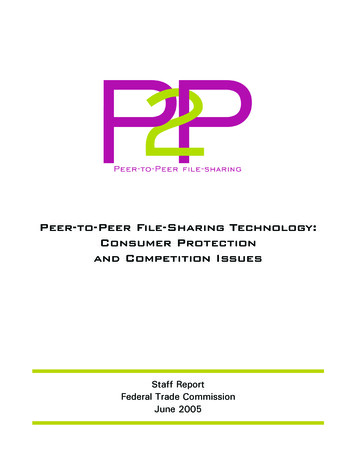
as a prequalification criterion. Accordingly, this studyseeks to answer several questions:1) What are the safety practices, nature of incidents andstructure of employers that currently have or had an EMRhigher than 1.5?2) What are the factors that contribute the most towardthe reduction of firms’ EMR?MethodologyTo answer the research questions, a partnership withthe North Carolina Department of Labor’s (NCDOL)Occupational Safety and Health Division ConsultativeServices Bureau was established to reach businesseswhose EMR exceeded 1.5 in the past 3 years. In 1992,the North Carolina state legislature passed a law (NCGS§95-250-259) requiring employers with an EMR of 1.5 orhigher to develop written safety and health policies andto establish a safety committee for employers with morethan 10 employees. The law also requires NCDOL to notify businesses when their EMR exceeds 1.5. Accordingly,the researchers developed a survey to answer the studyquestions. After the research team developed the surveyinstrument and its protocol, the survey instrument wassubmitted to Western Carolina University’s Human Subject Institutional Review Board for review and approval.Once approved, the research team invited 1,300 employers via mail to participate in the survey. The mailings weresent directly by the NCDOL Consultative Services Bureauto ensure employers’ confidentiality. Invited employershad workers’ compensation policies with an EMR of 1.5or higher during 2015, 2016 and 2017. Participants had theoption to complete a hard copy of the survey or an onlinesurvey through a link provided to them in the mail.Survey ResultsThe survey was administered throughout September2018 and 138 firms participated in the study (i.e., 10.6%response rate). The design of the survey did not preventparticipants from skipping questions if they so desired.Thus, the number of responses received for each questionis reported in the discussion of the results.The job title of individuals who completed the surveyfell within the following categories: 53 (38.1%) were owners, presidents or executive directors; 24 (17.3%) wereaccountants or other office roles; 19 (13.6%) were humanresources managers; 11 (7.9%) were safety managers/coordinators; 21 (15.1%) were others including vice president,general manager and operating partner.In addition, the specialization of participating firms fellwithin the following categories: 39 (28.3%) were in construction businesses, mostly special trades businesses; 27(19.6%) were in manufacturing; 12 (8.7%) were in healthand education; 10 (7.2%) were in sales businesses; and theremaining were in a range of businesses such as restaurants and cleaning services (Table 1).The reported number of workers at the firms were asfollows: 12 (8.9%) had fewer than 10 workers; 72 (53.3%)had between 10 and 50 workers; 19 (14.1%) had between50 and 100 workers; 23 (17%) had between 100 and 250workers; and 9 (6.7%) had more than 250 workers.The reported estimated revenue of participants’ firmswas as follows: 12 (9.3%) were less than 500,000; 10(7.8%) between 500,000 and 1 million; 99 (76.7%) be-TABLE 1STUDY SAMPLE DEMOGRAPHICSThe number of responses per question varies.CharacteristicsRevenueLess than 500,000 500,000 to 1 million 1 million to 5 millionMore than 5 millionNumber of employeesFewer than 1010 to 5050 to 100100 to 250More than 250Establishment typeConstructionManufacturingHealth and educationSalesOthersYears of experienceFewer than 10 years10 to 30 years30 to 50 yearsMore than 50Number (%)12 (9.3 %)10 (7.8 %)99 (76.7%)8 (6.2%)12 (8.9%)72 (53.3%)19 (14.1%)23 (17%)9 (6.7%)39 (28.3 %)27 (19.6 %)12 (8.7%)10 (7.2%)50 (36.2%)15 (11.4%)50 (37.9%)34 (25.8%)33 (25%)TABLE 2CHANGE IN PERCENTAGESOF SHWP & SHCCharacteristics Before After (currently)SHWP68.9%89.1%SHC46.3%66.7%TABLE 3SAFETY MANAGER VS.SHWP CROSS-TABULATIONSafety Total3999138assp.org JULY 2020 PROFESSIONAL SAFETY PSJ 33
TABLE 4NUMBER (PERCENTAGE) OF CASES THAT LED TO EMR VALUE GREATER THAN 1.5Firm sizeFewer than 10 workers10 to 50 workers50 to 100 workers100 to 250 workers250 to 500 workersMore than 500 workersOne incident4 (44.5%)25 (42.4%)4 (26.7%)6 (33.4%)00Two incidents2 (22%)23 (39%)7 (46.6%)5 (27.8%)00tween 1 million and 5 million; and 8 (6.2%) were morethan 5 million.Finally, the reported years of experience was as follows:15 (11.4%) had less than 10 years’ experience; 50 (37.9%)had between 10 and 30 years; 34 (25.8%) had between30 and 50 years; and 33 (25%) had more than 50 years.Accordingly, the study sample represents a wide range offirms (Table 1, p. 33).Safety Characteristics of the Study SampleThis section discusses the safety practices and structureof employers that participated in the study. It is vital touncover the safety practices and structure of employersbefore and after the firms reached an EMR value of 1.5 tohelp identify the characteristics that led to a higher EMR,as well as those that would help reduce it. EMR values ofa large percentage of participants (65.2%) have fallen below 1.5, which means the study sample has an acceptableexperience with the factors that contribute to EMR value.According to North Carolina law, each firm that reaches1.5 EMR must establish a safety and health written program (SHWP) and safety and health committee (SHC).SHWPs provide adequate systematic policies, proceduresand practices to ensure a safe and healthful working environment that allows employees to recognize job-relatedsafety and health hazards (OSHA, 2019a).The SHC is an integral part of the SHWP that helps ensure effective implementation of the program at the establishment level (OSHA, 2019b). The law in North Carolinaonly requires employers with more than 10 employees toestablish an SHC. Thus, calculations related to SHC haveexcluded firms with 10 or fewer employees. Table 2 (p.33) shows the change in the percentages of written safetyprograms and safety committees within the study sample.The findings indicate that 20.2% of the study sample hasinitiated a safety and health written program and only20.4% has initiated a safety committee between the timetheir EMR values increased to more than or equal to 1.5and now. Furthermore, the organizations that already hada written program improved it after their EMR increased(i.e., 68.9%). This could mean that the EMR policy encourages employers to improve their overall safety performanceto ensure that the EMR value remains at an acceptable level. As a result, the data indicates that 90 (65.2%) firms havesuccessfully reduced their EMR below 1.5.To better understand the relationship between SHWPand SHC, the odds ratio was calculated by using the number of firms that currently have written safety programsand those that do not, along with their current SHC existence. Of all participants, 138 firms provided informationabout the status of their SHWP and SHC. The odds ratioof establishing SHC among firms that have an SHWP is6.4 (95% CI, 1.59 to 25.57), which means that firms with an34 PSJ PROFESSIONAL SAFETY JULY 2020 assp.orgThree incidents3 (33.5%)8 (13.5%)2 (13.4%)7 (38.8%)2 (67%)1 (25%)Four incidents03 (0.1%)2 (13.4%)01 (33%)3 (75%)SHWP are 6.4 times more likely to have an SHC. Furthermore, the odds ratios between SHWP and SHC, and theability to reduce EMR were calculated. Of all participants,133 firms provided information about the status of theirSHWP and SHC as well as EMR value (i.e., lower than 1.3).The odds ratio of reducing the EMR value among firms thathave an SHC is 0.923 (95% CL, 0.4 to 2.1). This would meanthat firms with safety committees were 0.92 times morelikely to reduce their EMR than firms that do not have asafety committee. In other words, having a safety committee within the study sample does not influence EMR values.On the other hand, the odds ratio of reducing the EMR value among firms that have an SHWP is 1.053 (95% CL, 0.33to 3.29), which means that within the study sample, SHWPhelped firms reduce their EMR values by 1.053 times.The participants were asked to provide informationabout who manages safety and health in their firms. Thefindings indicate that 71.7% of participants do not have asafety manager/coordinator. Additionally, the participantswere asked about the safety certification carried by theindividual who manages safety and health in their firms.The question provided the following options: certified safety professional (CSP), associate safety professional (ASP),construction health and safety technician (CHST), OSHAcard, none and other. The results show that the individualswho manage safety and health of 84 (61.8%) firms have nosafety certification, while only 31 (22.8%) have OSHA cardsand 21 (15.4%) have other certifications. Additionally, theodds ratio was calculated by using the number of firmsthat currently have and do not have safety personnel, alongwith their current EMR values (lower than 1.5 or not). Ofall participants, 133 firms provided information about theircurrent EMR values and safety personnel. The odds ratioof having safety personnel in firms that lowered their EMRversus firms that do not is 2.29 (95% CI, 1 to 5.556). Thisresult means that a firm with safety personnel is 2.29 timesmore likely to reduce its EMR value compared to a firm thatdoes not have a safety manager/coordinator. The overallfindings regarding safety managers/coordinators and theircredentials may explain the cause for having an EMR valueabove 1.5. On the other hand, the job titles of individualswho manage safety and health included human resourcesmanager, workers’ compensation administrator, uppermanagement, operations manager and facility maintenance.The odds ratio was calculated to assess the relationshipbetween safety managers/coordinators and the presence ofan SHC. The odds ratio of having SHC in firms that havesafety personnel versus firms that do not is 2.65 (95% CI,1.04 to 6.745). This result means that a firm with safety personnel is 2.65 times more likely to have an SHC comparedto a firm that does not have a safety manager/coordinator.Finally, the collected data suggest that 100% of the firmswith a safety coordinator have an SHWP (Table 3, p. 33).
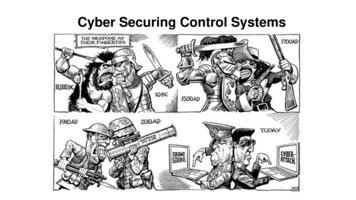
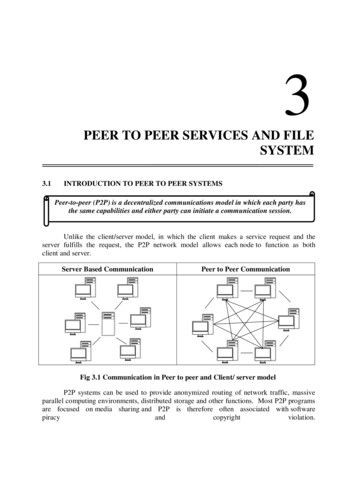
TABLE 5SAMPLE OF FOCUS GROUPS’ FEEDBACKIncident employerresponsibilityNonpreventableAuto incidentsFalse claimsFeedback example We had an injury involving an employee who was extremely allergic to bee stings andwas hospitalized for several days. Employees at fault, not following proper safety procedures. An employee injured during manual labor. The employee states that the injury couldhave been prevented if the employee was using proper method of work. During the time that the EMR was so high, there was no one handling the safetyprogram. Also, employees’ morale was low. All of this contributed to high EMR. One incident is a cut finger, only with safety glass that cuts tendon. He was paid for 2years to stay at home. Error on our part to allow that which is due to bad/no advicefrom previous workers’ compensation company. Subcontractor's insurance lapsed and we were not notified by the insurance company. A girl fell off one step and twisted her ankle, and she dealt with it for 3 years withsurgery after surgery. This incident was not our fault. It was faulty building on the builder’s end. Board wasnot nailed down properly in a ceiling. Wind blowing debris into eyes. Employee fell off stepladder, subcontractor's insurancelapsed, and we were not notified by insurance company. Employee hit by a car while working. We had one large claim that was the result of a traffic incident that was notpreventable as a city bus ran a red light and hit us. Our vehicle was struck by another vehicle (i.e., hit and run). An employee intentionally fell off ladder because, I later found out, her supervisor hadseen her practicing tipping over the ladder. If I had known she had two other suchoccurrences at other jobs, I probably would have not hired her. A gentleman who was known to play soccer came in from long Memorial Dayweekend to work. We had inventory that day. He was on hands and knees on floorpicking up trash and said he put his knee on a bolt on the floor and ended up with twoknee replacements. Due to one employee’s back injury 3 years ago our EMR increased. After 3 years, theyfound he has no back injury.EMR Calculation & Contributing FactorsThe survey asked participants whether they understandhow EMR is calculated and the EMR’s reliability as anindicator of firms’ overall safety performances. The results indicate that 63.8% of participants understand theEMR calculation method; however, the survey instrumentcannot validate this belief. It is anticipated that the number is much lower when actually pressed to explain thedetails of how it works. Furthermore, only 30.3% of theparticipants agreed that EMR is a good indicator of safetyperformance. Following is a sample of participants’ comments about why they do not believe EMR is a good safetymeasurement of safety performance:“Our overall safety performance has been satisfactory. Two incidents that took place in 2013 and2014 just happened to settle in 2016 at the sametime. In looking at the facts of each incident, Ithink one could determine that these incidentsdo not represent our overall safety performance.“I feel that our current rating is largely the result ofbad luck and poor decisions regarding our insurancecompany’s choosing to contest a claim, rather thanbeing the result of poor safety practices in our plant.”“I agree if the work environment is large enoughto support the EMR calculation.”“Being a smaller company, if a single incident isrecordable, our EMR is affected significantly.”Participants were asked about the number of incidentsthat led to the EMR value higher than 1.5. The responsesindicate that the EMR value of smaller firms (fewer than100 workers) is significantly impacted by one or two incidents (Table 4). Three incidents are more likely to impactthe EMR of midsize firms (100 to 250 workers). Lastly,the EMR value of larger firms (more than 250 workers)often gets impacted by four incidents or more (Table 4).A Mann-Whitney U test was conducted to determinewhether there were statistical differences in the numberof incidents that led to higher EMR between smaller firmsand midsize and larger firms. The test results indicatedthat number of incidents for smaller firms (mean rank 55.48) and midsize and larger firms (mean rank 72.43)are significantly different (U 898, Z -2.399, p .016).This finding confirms that the EMR of smaller firms isvulnerable to fewer numbers of work-related incidentsthan larger firms.Participants were asked about the factors that contribute to lower EMR. Safety training, safety meetings, SHCassp.org JULY 2020 PROFESSIONAL SAFETY PSJ 35
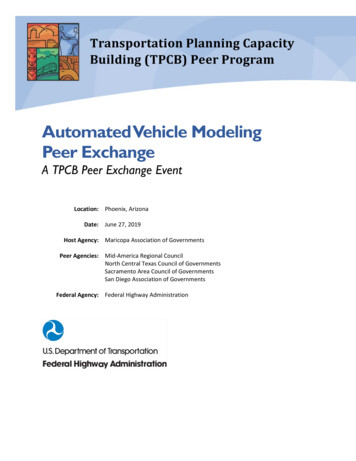
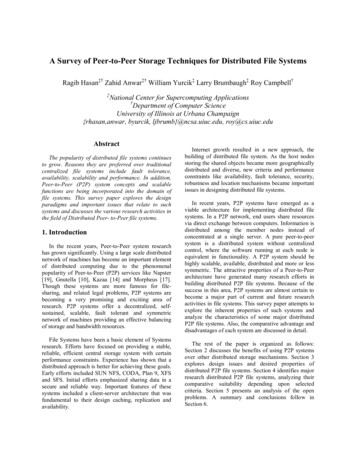
and SHWP have been suggested as the most contributingfactors to lower EMR. Additionally, the participants wereasked about the actions that would prevent EMR fromincreasing in the future. The participants’ recommendations include training and education, communicatingsafety requirements and practices, involving employeesand subcontractors in the safety program and improvinghuman resources management. Following is a sample ofparticipants’ comments:“Having an open-door policy and discussing safety with all employees regularly.”“Having production/field employees on thecommittee.”“The policy itself, education of staff and providing examples of unsafe behaviors.”“Safety meetings and on-site safety inspection.”“Sharing the impact of unsafe practices withemployees.”The Nature of IncidentsParticipants were asked to provide information about thenature of incidents that led to a higher EMR in their firms.Table 5 (p. 35) provides a sample of these incidents. Thenature of reported incidents could be classified as follows: Preventable incidents that could be categorized as follows:a) Preventable, employee responsibility: These types ofincidents could be prevented by employees’ safe actions.These incidents include slips, falls, improper use of tools,and not following guidelines and safety protocol. However, further investigation is needed to learn whetherthe employers have provided the required training andenforcement to encourage employees’ safe actions. Theseincidents would not be the employees’ responsibility ifemployers did not provide the needed training and enforcement (Al-Bayati, 2019). These types of incidents werementioned 76 times in participants’ comments.b) Preventable, employer responsibility: These types ofincidents could be prevented by employers’ commitmentto safety. These incidents have been identified when participants stated that more safety management or trainingshould have been implemented to prevent injuries. Nonpreventable: These incidents have been consideredcatastrophic or claimed to be nonpreventable. Non-work-related incidents: Most of these incidentshappened away from the workplace or while undertakingnon-work-related activities, such as auto incidents duringtraveling between the firm’s workplaces. However, theymust be reported to the insurance and paid from theworkers’ compensation fund. False claims: Fake injuries to gain workers’ compensation were reported by participants. These cases couldbe eliminated by better hiring processes (e.g., new hirescreening). For example, it is essential to hire individualswho have an acceptable career history with no previoussuspicious workers’ compensation claims.Besides the incidents’ nature, the handling of incidentsappears to be a factor. Poor management could easily leadto a higher number of days away from work, which significantly impacts the EMR value, as discussed. Followingis a sample of participants’ feedback that illustrates theinfluence of poor management:36 PSJ PROFESSIONAL SAFETY JULY 2020 assp.org“The number of incidents was very low, only oneor two, but the days away from work were high.”“New management with little institutionalknowledge.”“Physical impairment or limitation not communicated to or perceived by company management.”“The primary driver was our insurance company’sdecision to deny a knee injury claim. The decisionresulted in the employee hiring an attorney. Theclaim was eventually settled for 20,000, but significant legal fees were incurred.”Discussion & RecommendationsEMR has been used by many firms as a prequalifier toensure acceptable safety performance. However, few, ifany, studies validate the utilization of EMR. Accordingly,the survey reveals several factors that would help bothhiring firms as well as firms seeking to be hired beyondthe factor suggested by Abudayyeh et al. (2006), Everettand Thompson (1995), and Hinze et al. (1995). The studyreveals the importance of having a safety manager/coordinator on overall safety performance. A safety manager/coordinator increases the probability of having SHWP by100% and SHC by 3.81 times. As a result, the likelihoodof improving the overall safety performance increases by2.29 when having full-time safety personnel. The importance of safety personnel on EMR value as well as safetyculture has been suggested by Al-Bayati et al. (2019).The study indicates that SHWP increases the likelihood of SHC by 8.3 times and the likelihood of reducedEMR by 1.03. Thus, having effective SHWP is crucial. Thefindings also suggest that the influence of SHC withinthe study sample is small (Figure 1). The findings suggesta significant role for the safety manager/coordinator ininitiating and maintaining a higher than average levelof safety performance and better incident management.Figure 1 illustrates the significant role of the safety manager/coordinator revealed in this study. Conversely, theabsence of a safety manager/coordinator in 71.7% of thestudy sample could explain the fact that these firms hador currently have
EMR calculation is the actual primary losses (APL). The APL value is the first 16,500 paid out on a claim in the state of North Carolina. The APL is weighted more heav-ily in the EMR calculation than the rest of the claim paid out after the first 16,500. For example, if firm A had one 33,000 claim, it would show on the EMR as 16,500 in the APL.