Transcription
NEXT GENERATION FIREWALL COMPARATIVE REPORTPerformanceJULY 17, 2018Author – Thomas SkybakmoenTested ProductsBarracuda Networks CloudGen Firewall F800.CCE v7.2.0Check Point 15600 Next Generation Threat Prevention (NGTP) Appliance vR80.20Cisco Firepower 4120 Security Appliance v6.2.2Forcepoint NGFW 2105 Appliance v6.3.3 build 19153 (Update Package: 1056)Fortinet FortiGate 500E V5.6.3GA build 7858Palo Alto Networks PA-5220 PAN-OS 8.1.1SonicWall NSa 2650 SonicOS Enhanced 6.5.0.10-73nSophos XG Firewall 750 SFOS v17 MR7Versa Networks FlexVNF 16.1R1-S6WatchGuard M670 v12.0.1.B562953EnvironmentNSS Labs Next Generation Firewall Test Methodology v8.0NSS Labs SSL/TLS Performance Test Methodology v1.3NSS Labs Evasions Test Methodology v1.1This report is Confidential and is expressly limited to NSS Labs’ licensed users.
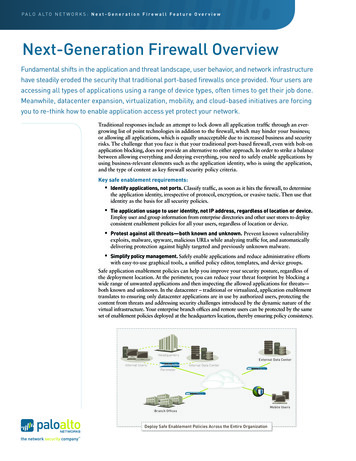
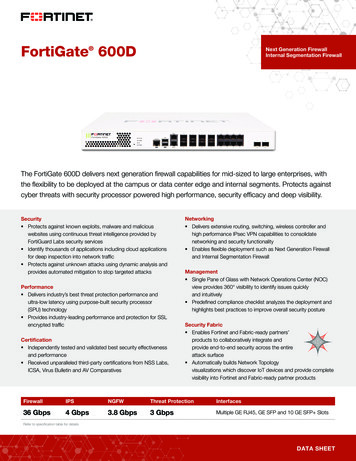
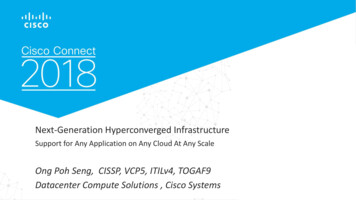
NSS LabsNext Generation Firewall Comparative Report – Performance 071718OverviewImplementation of next generation firewall (NGFW) devices can be a complex process, with multiple factorsaffecting the overall performance of the device.The following factors should be considered over the course of the useful life of the NGFW: Where will it be deployed and managed?What is the throughput for the target environment?What is the predominant traffic mix?Concurrency and connection ratesWhat security policy is applied?There is frequently a trade-off between security effectiveness and performance. Because of this trade-off, it isimportant to judge a product’s security effectiveness within the context of its performance and vice versa. Thisensures that new security protections do not adversely impact performance and that security shortcuts are nottaken to maintain or improve performance.Sizing considerations are critical, as vendor performance claims (where protection typically is not enabled) can varysignificantly from actual performance (where protection is enabled). Figure 1 depicts NSS-Tested Throughput andMaximum TCP Connections per Second. NSS-tested throughput is calculated as a weighted average of the trafficthat NSS Labs expects an NGFW to experience in an enterprise environment. For more details, please see theScorecard section in the individual test reports.200,000SophosCiscoMaximum TCP Connections per Second180,000160,000140,000Versa NetworksBarracuda 00Check PointPalo Alto 03,0004,0005,0006,0007,0008,000NSS-Tested Throughput (Mbps)Figure 1 – Throughput and Connection RatesMaximum TCP connections per second (CPS) increases toward the top of the y axis. NSS-Tested Throughput (Mbps)increases toward the right side of the x axis. Products with low connection/throughput ratios run the risk ofexhausting connection tables before they reach their maximum potential throughputs.This report is Confidential and is expressly limited to NSS Labs’ licensed users.2
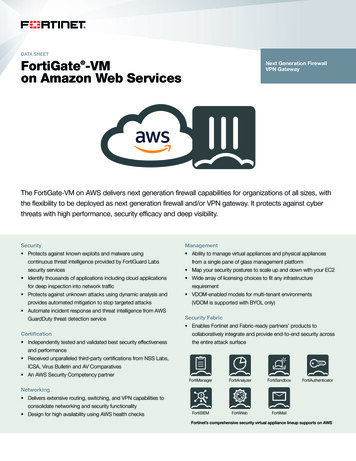
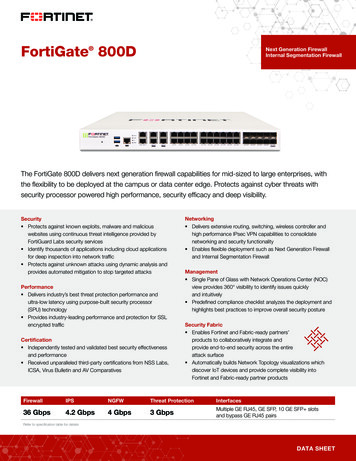
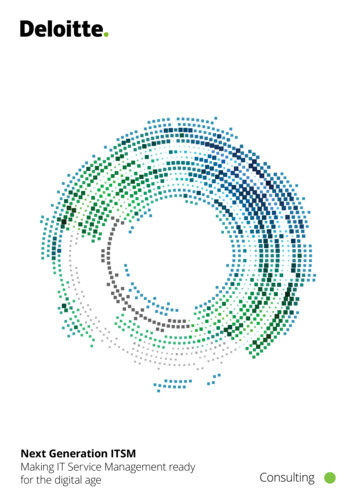
NSS LabsNext Generation Firewall Comparative Report – Performance 071718020,000Barracuda net69,79038,500Palo Alto Networks85,00051,00010,0109,971181,0009,200Versa 22,980Check m TCP Connections per SecondMaximum HTTP Connections per SecondFigure 2 – Connection DynamicsPerformance is not just about raw throughput. Connection dynamics are also important and will often provide anindication of an inspection engine’s effectiveness. If devices with high throughput capabilities cannot set up andtear down TCP or application-layer connections quickly enough, their maximum throughput figures can rarely berealized in a real-world deployment.Furthermore, if bypass mode is enabled, the NGFW engine could be allowing uninspected traffic to enter thenetwork once system resources are exhausted, and administrators would never be informed of threats insubsequent sessions.This report is Confidential and is expressly limited to NSS Labs’ licensed users.3
NSS LabsNext Generation Firewall Comparative Report – Performance 071718Table of ContentsTested Products . 1Environment . 1Overview. 2Analysis . 6UDP Throughput and Latency. 6Maximum Capacity . 8HTTP Capacity . 10Application Average Response Time at 90% Maximum Capacity . 13HTTP Capacity with HTTP Persistent Connections . 13SSL/TLS Performance . 15Single Application Flows. 15Test Methodology . 20Contact Information . 20This report is Confidential and is expressly limited to NSS Labs’ licensed users.4
NSS LabsNext Generation Firewall Comparative Report – Performance 071718Table of FiguresFigure 1 – Throughput and Connection Rates . 2Figure 2 – Connection Dynamics . 3Figure 3 – Vendor-Claimed Throughput vs. NSS-Tested Throughput (Mbps) . 6Figure 4 – UDP Throughput by Packet Size (Mbps) . 7Figure 5 – UDP Throughput by Packet Size (Mbps) . 7Figure 6 – UDP Latency by Packet Size (Microseconds [μs]) . 8Figure 7 – Concurrency and Connection Rates (I). 9Figure 8 – Concurrency and Connection Rates (II). 10Figure 9 – Maximum Throughput per Device with 44 KB Response (Mbps) . 11Figure 10 – Maximum Throughput per Device with 21 KB Response (Mbps) . 11Figure 11 – Maximum Throughput per Device with 10 KB Response (Mbps) . 11Figure 12 – Maximum Throughput per Device with 4.5 KB Response (Mbps) . 12Figure 13 – Maximum Throughput per Device with 1.7 KB Response (Mbps) . 12Figure 14 – Maximum Connection Rates per Device with Various Response Sizes. 12Figure 15 – Application Latency (Milliseconds) per Device with Various Response Sizes . 13Figure 16 – HTTP 250 Capacity with HTTP Persistent Connections (CPS) . 13Figure 17 – HTTP 500 Capacity with HTTP Persistent Connections (CPS) . 14Figure 18 – HTTP 1000 Capacity with HTTP Persistent Connections (CPS) . 14Figure 19 –Single Application Flow: Telephony (Mbps). 15Figure 20 –Single Application Flow: Financial (Mbps) . 15Figure 21 –Single Application Flow: Email (Mbps) . 16Figure 22 –Single Application Flow: File Sharing (Mbps) . 16Figure 23 –Single Application Flow: File Server (Mbps). 17Figure 24 –Single Application Flow: Remote Console (Mbps) . 17Figure 25 –Single Application Flow: Video (Mbps) . 18Figure 26 –Single Application Flow: Meeting (Mbps) . 18Figure 27 –Single Application Flow: Database (Mbps) . 19This report is Confidential and is expressly limited to NSS Labs’ licensed users.5
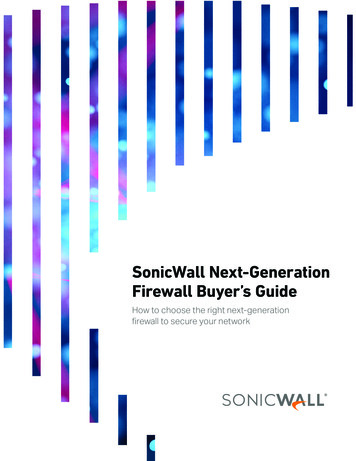
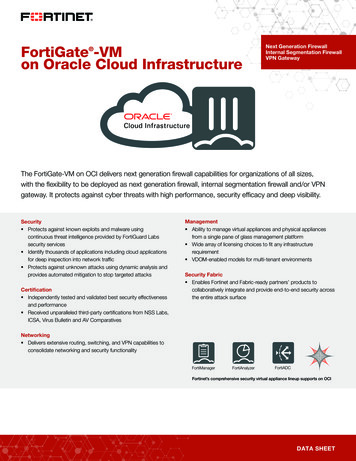
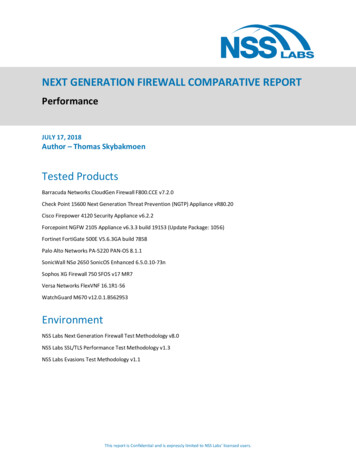
NSS LabsNext Generation Firewall Comparative Report – Performance 071718AnalysisNSS research indicates that NGFWs are typically deployed to protect users rather than data center assets and thatthe majority of enterprises will not separately tune intrusion prevention system (IPS) modules within their NGFWs.Therefore, during NSS testing, NGFW products are configured with the vendor’s pre-defined or recommended (i.e.,“out-of-the-box”) settings in order to provide readers with relevant security effectiveness and performancedimensions based on their expected usage.5,037Barracuda Networks7,7005,5995,2005,291Check ,7537,888Palo Alto ,661Versa 8,000NSS-Tested Throughput laimed Throughput (Mbps)Figure 3 – Vendor-Claimed Throughput vs. NSS-Tested Throughput (Mbps)Figure 3 depicts the difference between NSS-Tested Throughput 1 and vendor performance claims as vendor testsare often performed under ideal or unrealistic conditions. Where vendor marketing materials list throughputclaims for both TCP (protection-enabled numbers) and UDP (large packet sizes), NSS selects the TCP claims, whichare more realistic. Therefore, NSS-Tested Throughput typically is lower than vendor-claimed throughput—andoften significantly so, since it more closely represents how devices will perform in real-world deployments.UDP Throughput and LatencyThis test uses UDP packets of varying sizes generated by test equipment. A constant stream of the appropriatepacket size along with variable source and destination IP addresses is transmitted bidirectionally through each portpair of the device.Each packet contains dummy data and is targeted at a valid port on a valid IP address on the target subnet. Thepercentage load and frames per second (fps) figures across each inline port pair are verified by network monitoringtools before each test begins. Multiple tests are run and averages are taken where necessary.This traffic does not attempt to simulate any “real-world” network condition. The aim of the test is to determinethe raw packet processing capability of each inline port pair of the device as well as the device’s effectiveness at1NSS-Tested Throughput is calculated as a weighted average of the traffic that NSS expects an NGFW to experience in an enterpriseenvironment. For more details, please see the Scorecard section in the individual test reports.This report is Confidential and is expressly limited to NSS Labs’ licensed users.6
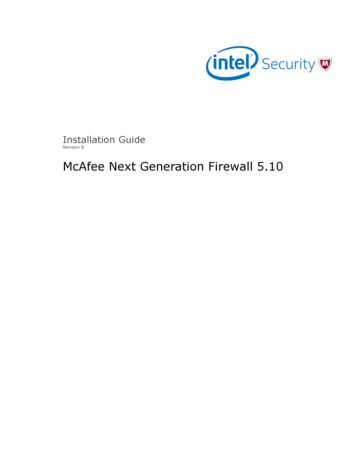
NSS LabsNext Generation Firewall Comparative Report – Performance 071718forwarding packets quickly, in order to provide the highest level of network performance with the least amount oflatency. Figure 4 and Figure 5 depict the maximum UDP throughput (in megabits per second) achieved by eachdevice using different packet 004,0002,000064 Byte Packets128 Byte Packets256 Byte Packets512 Byte Packets1024 Byte PacketsBarracuda NetworksCheck PointCiscoForcepointFortinetPalo Alto NetworksSonicWallSophosVersa NetworksWatchGuard1514 Byte PacketsFigure 4 – UDP Throughput by Packet Size (Mbps)The ability to provide the highest level of network performance with the least amount of latency has long beenconsidered a minimum requirement for legacy firewalls, but it has often caused significant problems for NGFW(and IPS) devices because of the deep inspection they are expected to perform.Throughput etsBarracuda Networks1,6382,6884,3376,1318,0308,979Check 20
NSS Labs Next Generation Firewall Comparative Report – Performance_071718 This report is Confidential and is expressly limited to NSS Labs’ licensed users. 7 forwarding packets quickly, in order to provide the highest level of network performance with the least amount of latency. Figure 4 and Figure 5 depict the maximum UDP throughput (in megabits per second) achieved by each